RESULTS OF TUYERE COKE SAMPLING WITH REGARD TO APPLICATION
OF APPROPRIATE COKE STRENGTH AFTER REACTION (CSR)
FOR A BLAST FURNACE
J.-S. Shiau *, Y.-C. Ko, C.-K. Ho, M.-T. Hung
China Steel Corporation, Iron and Steel Research and Development Department, Kaohsiung, Taiwan
(Received 16 March 2016; accepted 17 January 2017) Abstract
Raising pulverized coal injection (PCI) will decrease coke rate, but increase the residence time of coke and abrasion in the blast furnace (BF). Thus, insufficient coke strength will generate more coke fines in the lower BF and result in lower permeability and production of hot metal (HM). For understanding the behavior of coke at various HM productivities, a tuyere coke sampler was used to collect the coke samples for measuring the coke strength.
Firstly, the difference of sampled coke under the conditions of various HM productivities was explored. Secondly, the BF operating conditions and causes of generating more coke fines was correlated by testing the coke reaction rate after reaction. Finally, according to the above analysis results, the relative regression equations had been obtained for sampling coke properties, BF operation conditions and BF permeability. Furthermore, the coke strength after reaction (CSR) quantitative target and its online system at various blast conditions were set to provide some reference for coke and HM production.
Keywords: Blast furnace; Coke sampling; Coke properties; Coke strength after reaction (CSR); Reaction rate.
* Corresponding author: [email protected]
S e c t i o n B : M e t a l l u r g y
DOI:10.2298/JMMB160316003S 1. Introduction
The functions of coke in the blast furnace (BF) can be roughly divided into heat source, reducing agent, and medium through which gas and liquid pass. To decrease the BF fuel cost, the BF operation aims by promoting pulverized coal injection rate (PCR) resulting in the reduced feed coke rate. Because of the coke longer stay in the blast furnace, and increasing the loading of coke acting as a BF medium. Therefore, it is necessary to reduce the ratio of coke fines and maintain a certain level of the coke quality for a smooth BF operation. Inadequate coke strength will make a more coke fines generated in the lower BF, and increasing gas permeability resistance resulted in the decreases of hot metal (HM) productivity. It is an effective method for understanding the coke property and powder coal combustion, confirming hearth cleanliness, and obtaining real messages in BF by making use of the BF tuyere coke sampling. Generally speaking, there are bosh coke, raceway coke, bird’s nest coke and deadman coke along hearth radius from tuyere, and the percentages of coke in the four radial districts mainly vary with the BF operation conditions.
It was shown that the average particle size of the sampling coke sharply declined, and a dramatically
increase occurred in the coke fines at these regions below the cohesion zone to the top of raceway. Larger amount of coke fines significantly affected the gas and liquid permeability in the lower part of BF, and it was sufficient to show the importance of coke strength [1]. The study of sampling coke in Rautaruukki and Nippon Steel (NSC) showed that the coke strength is lower in raceway, and its strength become higher with the closer to BF center at the tuyere level [2, 3]. It was also found that the sampling coke strength decreased with the increase of PCR in the POSCO research [4]. In addition, it indicated that the SiO2 change in the sampling coke was small at higher temperature zone, however, it increased with the declined temperature of coke at lower temperature zone [5], and according to the literature [6], the temperature of coke sampled from tuyere almost kept steady in raceway zone and it raised with the increase of hearth radius from tuyere in deadman. Therefore, the SiO2content of sampling coke was virtually not changed in raceway zone and it increased with the increasing distance from tuyere in deadman zone.
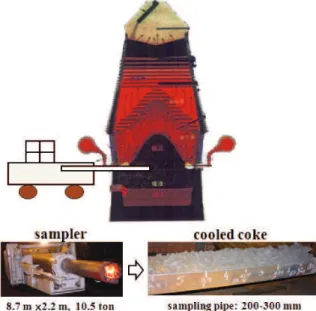
critical value which is defined on the surface reaction amount of sampling coke. The coke critical reaction rate was determined about 30%, which was according to a reacted (or abrasive) coke surface resulted in a suddenly large decrease of coke size [7]. The carbon-steel pipe of sampler which has 200-300 mm diameter was inserted into the furnace to conduct a planned coke sampling at the tuyere level for matching with the routine repair of No.3 and No.4 BF in China Steel (CSC). The sampling cokes were focused on the tests of coke strength and reaction rate to examine these coke properties correlating with different BF HM productivity and operation conditions, and find appropriate index for coke strength after reaction (CSR) at various BF HM productivities.
2. Experimental
Fig. 1 shows a schematic diagram of the high-temperature coke sampled from tuyere in this study, and sampling coke need to be cooled to room-temperature for executing the following test and analysis, the entire research and experimental procedure are illustrated in Fig. 2.
2.1 Size analysis of sampling coke
Each sampling coke was needed to be allocated and numbered carefully corresponding to the real position in BF, and the entire samples were divided into several segments at intervals of 300 mm length. Each sample was screened with 3.35, 15, 25, 38 and 50 mm sieves for size analysis. The amount of +3.35 mm coke samples were separated from slag by hand,
and the residual one is used for determining the fraction of coke fines.
2.2 Coke strength measurement
The samples strength can be test by I-type drum used for measuring CSR equipment because they had high-temperature gasification reactions inside BF. The coke size ranged 19 mm to 25 mm in each segment were loaded into I-type drum to rotate 600 times, then measuring the fraction of +m coke.
2.3 Coke reaction rate measurement
The samples reaction rate can be also test by I-type drum used for measuring CSR equipment, and the coke size ranged 25 mm to 38 mm in each segment were loaded into I-type drum to sequentially rotate 100, 200, 500, 1000 times, then the coke size was measured after finishing the rotation. In addition, the residual fines detached from coke surface was tested for find the ash content and crystalline size (Lc) of coke. The reaction rate and thickness of the individual layer can be obtained from ash content, as follows:
The weight of ash before reaction equals to the weight of ash after reaction.
W0‧a0= W‧a ...(1)
W = (1-f)‧W0 ...(2)
f = 1-a0/a ...(3) where W0: the weight of ash before reaction; W: the weight of ash after reaction; a0: th weight fraction of ash before reaction; a: the weight fraction of ash after reaction. f: the reaction rate (fraction)
2.4 SiO2 measurement in the ash
Heating the residual fines detached from coke surface to 500oC in 30 minutes, and the fines continuously heated from 500oC to 815oC in 60 Figure 2.Diffraction pattern and calculation of Lc for
tuyere coke.
minutes, then holding 815oC for four hours. The SiO 2 content in residual ash was obtained by chemical analysis.
2.5 Lc measurement to estimate temperature of tuyere coke [8]
Crystalline size of coke was employed for estimating the temperature of coke sampled from operating BF due to the width at half peak height of (002) diffraction profile for a given coke as function of temperature. X-ray diffraction technique had been adopt to measure the Lc, then the calibration curve of the relationship between Lc and heating temperature can be established according to the standard sample. Therefore, this curve will be used as a standard to estimate the coke temperature, as shown in Fig. 3 and Fig. 4.
2.6 Data analysis
Sampling coke strength will vary with the radial position sampled from tuyere, PCR and SiO2fraction in coke, therefore, the 14 sets of sampling cokes from No.3 and No.4 BF of CSC in 2007-2014 were studied on the relationships between coke properties and operation conditions at various BF HM productivity,
the main items including:
(A) Measuring the sampling coke strength under a higher HM productivity (>2 t/m3-d) and a lower HM productivity (<2 t/m3-d).
(B) Clarifying the operation conditions and causes for the cases of more coke fines.
(C) Developing the relationships among coke properties, BF operation conditions, and BF gas permeability resistance.
(D) Building the CSR quantitative target and its online system at various operation conditions.
3. Results and Discussions
3.1 I-type drum test for sampling coke strength
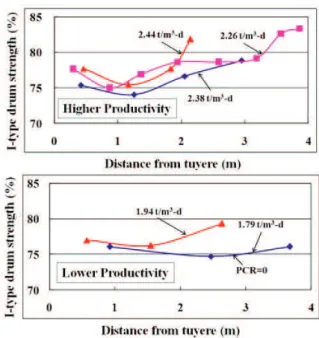
Fig. 5 shows the relationship between the sampling coke strength by I-type drum and the sampling distance from tuyere under the conditions of various HM productivities. It was found that these coke strength were similar at different HM productivities, and raceway coke strength was smaller than deadman coke strength under the conditions of having PCI, however, it was almost same in entire sampling regions under the case of PCR=0. The reasons for PCI affecting on coke strength were expressed that more carbon solution loss reaction (or boudouard reaction) and coke abrasion occurred due to the feed coke stayed in BF for a longer time with PCI, and this case maybe result that the surface structure of an abrasive coke become more loose when feed coke which is slowly falling to the raceway near the tuyere, and reacting with the continuous hot blast blown via tuyere.
Figure 3.Standard curve of Lc and temperature.
Figure 4.The entire research and experimental procedure.
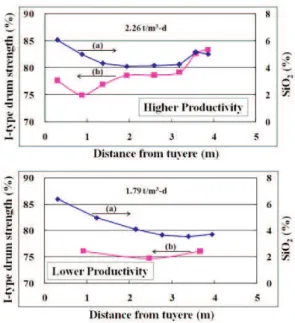
However, the original cokes located near deadman zone (at the edge of raceway) had a higher strength for the reasons that the fines generated from both chemical reaction and physical abrasion on the coke surface was blown by the cycle blast. On the other hand, the feed coke had a higher replacement inside BF without using PCI, and the influence of cycle blast was not clear, thus, the coke strength in entire sampling regions was similar. It was presented as curve(a) in Fig. 6 that the relationship between SiO2content in sampling coke and the sampling distance from tuyere, and it was observed SiO2 content in entire regions of sampling coke was lower than SiO2content in feed coke (6.9%). In general, there is lower SiO2content in the coke at tuyere level in BF, and it maybe relate to the reduction reaction of SiO2 and carbon within the coke at high-temperature raceway zone [9]. The reaction resulted producing Si, which quickly dissolved into hot metal while going through the coke bed, and causing a lower SiO2content. It was also seen the results for a higher HM productivity that SiO2 content of the coke was steady in raceway but it increased with the increasing sampling distance from tuyere in deadman zone. It not only had a good agreement with the literature [5], the quantitative results were also expressed in this study. Moreover, the SiO2 content of the coke in deadman region was significantly lower under the condition of PCR=0 at a lower operation of HM productivity than which at a higher HM productivity due to enough heat generated from using more coke. The comparison of I-type drum strength and SiO2content of sampling coke at BF tuyere level was shown as curve(b) in Fig. 6. It was found that the lower coke strength occurred with less SiO2 content in the coke, and this implied there were not only the
combustion reaction for carbon consumption, but also the SiO2reduction reaction simultaneously. Therefore, coke strength was effected since the carbon consumption inside the core structure of coke. From the literature [5] that the slag and iron contents in a coke will reduce the I-type drum strength and the result was in good agreement with this study as presented in Fig. 7(a), it was deduced that the cokes located deadman region were mixed with BF burden due to one case of sampling coke for the condition of dropping down BF burden before sampling. Thus, it was also found the content of slag and iron was suddenly ascent (pointed circle). SiO2content of this sampling coke was used to verify this deduction that it also abruptly increased even larger than the SiO2in feed coke (Fig. 7b), clearly, it got more SiO2come from the slag derived from dropping BF burden. Finally, the test result of I-type drum coke strength was compared with the literature [5], it indicated the coke strength was also dramatically decreased in this case (Fig. 7c).
3.2 Reaction rate test of coke sampled in raceway
The coke reaction rate related with its size can be further calculated when getting the data of ash content and residual coke diameter after the rotating test. Fig.
Figure 7.The effects of slag and iron on I-type drum strength of coke.
8 presented the relation of reaction rate versus normalized radius at various HM productivities. It was known that the trend of higher-productivity curve was obviously distinct with lower-productivity one, in higher HM productivity, the reaction rate and decreased rate of radius were much higher, and there was more mechanical abrasion to resulted in producing more coke fines when the abrasion started slowing down. On the contrary, the reaction rate decreased drastically with decreasing radius, and there was less mechanical abrasion when the abrasion suddenly became small, thus it generated less coke fines in a lower HM productivity.
To explicitly describe the quantitative relationship of coke reaction rate and its size, it was used for expressing the equations as the relation of [coke
reaction rate (fi) × coke radius (Ri)] versus coke reaction rate (fi) in this study, as shown in Fig. 9(a), equation (4) and (5), and they both got well correlation coefficient (r2) in higher and lower HM productivity.
High yield: fiRi= 29.295fi-172.9, r2= 0.98 ...(4)
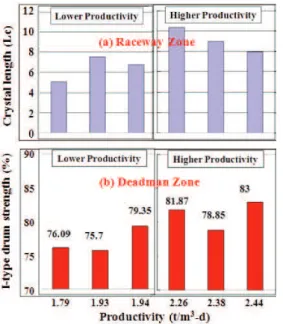
Low yield: fiRi= 27.2fi-22, r2= 0.98 ...(5) It was known as Fig. 9(b) that the radius decrease of coke was obviously larger at the condition of coke critical reaction rate (30%) for a higher HM productivity, which meant there was a higher abrasion on the coke surface to produce more coke fines. The average value on the weight ratio of sampling coke fines (<3.35mm) was also listed in Table 1, it was seen the coke fines ranged from 12 to 24 wt% at the operation of a higher HM productivity while it only ranged 6-7 wt% for a lower HM productivity. Therefore, the sieving test was in well agreement with reaction rate test of sampling coke. To clarify the causes of more coke fines generated at a higher HM productivity, the residual ash within the reacted coke was analyzed to obtain the crystal length (Lc), and the I-type drum strength of deadman coke were both used to investigate the relationship between the coke fines and BF operation, as described in Fig. 10. It was actually found that both crystal length (or coke temperature) and I-type drum strength of deadman coke were larger at a higher HM productivity, thus, it was deduced the higher flame temperature occurred in a higher HM productivity operation. This deduction was also verified with a comparison with BF operation data (flame temperature) on the day before coke sampling (Table 1).
It was also trial to discuss the more sampling coke fines under the condition of a higher HM productivity Figure 8.Coke reaction rate (%) versus normalized coke
size (R/R0)(-) at various HM productivities.
from the reaction mechanism aspect in this study. For coke reaction kinetics of CO2 with coke [10] [C+CO2=2CO], it belongs to the diffusion-control reaction in the porous material (coke), and when the reaction temperature is very high (>1200 oC), the reaction rate was so large that CO2 consumption rate was much exceeded the CO2supply rate at this time. Therefore, the pore surface of coke was covered by a large number of generated CO gas film and diluting the CO2 concentration at the gas film surface of coke to greatly result in reducing coke internal reaction. At this time, the reaction was mainly dominated by the surface reaction, and the reaction rate is limited by the diffusion rate of CO2gas through the gas film as shown in region III of Fig. 11, it was well known from the diagram that the slope of reaction rate versus 1/T was very small for indicating the temperature effect of the chemical reaction had been very small. It was also stated that the mass transfer in gas film around the particles surface related to the relative velocity between the fluid body and the particles, particle size and fluid properties [11-12]. For the larger particle size and velocity of coke, its mass transfer coefficient is proportional to the (fluid velocity/particle diameter)0.5, thus, this study assumed the mass transfer coefficient was proportional to (fluid velocity)0.5 under the condition of similar particle diameter. In general, there was a larger blast volume and
a bosh gas speed at a high BF HM productivity, and the bosh gas with a stronger blast kinetic energy went through the gas film with a larger mass transfer coefficient when coke was conducting CO2 surface reaction at a high temperature. As a result of having a continuous CO2 surface reaction layer by layer repeatedly and causing a more sampling coke fines at a high BF HM productivity.
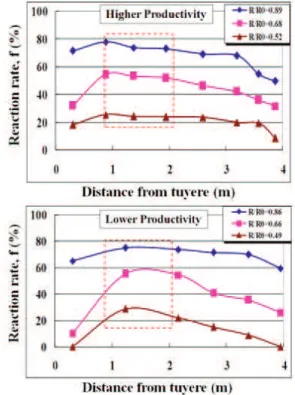
The coke reaction rate at various residual radius versus sampling coke distance from tuyere under the conditions of different productivities were displayed in Fig. 12. It could be found that there was a greater amount of change in coke reaction rate at the same particle size changes for a lower HM productivity, and this noted it was not easily abrasive on the coke surface that resulting in less coke fines. Furthermore, the coke had a greater reaction rate both in the sampling depth of 1-2 m (that was raceway coke) regardless of a higher or a lower HM productivity, but a higher coke reaction rate was only maintained in deadman region. It was supposed to relate with larger blast volume and higher flame temperature. In theory, the higher coke reaction rate occurred due to its more abrasive coke structure should result in smaller coke strength. The results in Fig. 12 was compared with that in Fig. 5, it was known as expected that I-type drum coke strength was opposed to coke reaction rate, as mentioned in the introduction [5].
3.3 Analysis of sampling coke relationship with BF operation
The properties of sampling coke and BF operation data (including feed coke properties, BF operation
Figure 11.The diagram of diffusion rate of CO2 gas
through the gas film and the slope of reaction rate versus 1/T
Figure 10.Crystal length of raceway coke and I-type drum strength of deadman coke versus HM productivities.
index and blast conditions) of the day before sampling were used for correlation analysis in this study, as listed in Table 2. It was pointed that the negative correlation coefficient of coke fines ratio (CFR) and feed coke strength after reaction (CSR) was enough high (-0.92), thus, the accessible CSR was selected to replace the CFR which could be only obtained at sampling date. It was thought in Table 2, DP/V was chose to a dependent variable, and the higher correlation coefficient such as CSR, Tliquidusand PCR were used as the independent variables in this study.
A regression equation was obtained by the ways of normalization (0-1, listed in Table 3) at first and multiple regression analysis afterward, as follows:
DP /V = -0.238CSR + 0.345Tliquidus+ 0.586PCR,
r2 = 0.88, α <0.05 ...(6)
where DP/V : gas permeability resistance (kg-min./cm2-NM3); CSR : feed coke strength after reaction (%); Tliquidus: slag liquidus temperature (oC); PCR : pulverized coal injection rate (kg/tHM).
Equation (6) shows the relationships among gas permeability resistance, feed coke strength after reaction, slag liquidus temperature and pulverized coal injection rate, it was known that DP/V will obviously increase with the decrease of CSR, and the increasing Tliquidus and PCR. The multiple correlation coefficient (r) of this equation was 0.94, indicating that it was in well agreement with its original data. And the significant level (α) of this equation is much smaller than 0.05, indicating that the dependent variable of this regression equation was enough described by the three independent variables. It was worth mentioned that the Tliquiduswas derived from the slag fluidity model developed by Shiau [10], which was calculated according to the five main chemical compositions (CaO, SiO2, Al2O3, MgO, TiO2) in BF final slag.
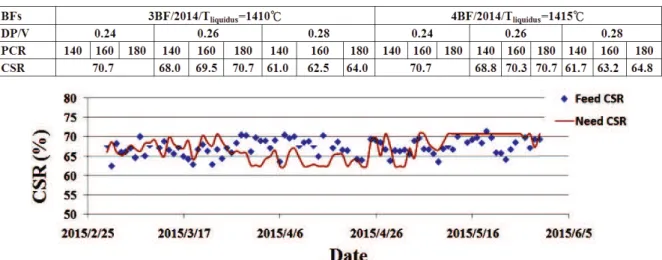
The required CSR index of No.3 and No.4 BF were established at different DP/V (0.24-0.28) and PCR (140-180) based on the averaged Tliquidusin 2014, as shown in Table 4, and its online system was also developed as shown in Fig. 13. From the calculated results listed in Table 4, the higher CSR of feed coke was in need in order to reach a lower gas permeability resistance, similarly, it also needed higher CSR with the operation of higher PCR. The monthly averaged PCR and Tliquidusof 2014/12 was used for calculating necessary CSR of feed coke, it resulted that No.3 BF need the feed coke whose CSR is larger than 69, and No.4 BF need the feed coke whose CSR is 70 at least in order to maintain good permeability resistance (0.25). In Fig. 13, it indicated the comparison of daily CSR for feed coke in No. 3 BF and calculated CSR in this study during 2015/3-2015/5, the results show that a half of the feed coke is close to the need coke. Figure 12.The coke reaction rate (at various residual
radius) versus sampling coke distance from tuyere at various productivities.
4. Conclusions
(1) Sampling coke strength in tuyere level:
(a) The higher sampling coke strength, the averaged size loss of coke was larger. Raceway coke strength was smaller than deadman coke strength under the conditions of having PCI, but it was almost same in entire sampling regions under the case of PCR=0.
(b) SiO2content in sampling coke may reflect its strength, the less SiO2, the coke strength was lower.
(2) Sampling coke reaction rate in tuyere level: (a) The higher sampling coke reaction rate, the
larger averaged size loss of coke. There was a higher abrasion on the coke surface to produce more coke fines for a higher HM productivity, but it was opposite for a lower HM productivity.
(b) The reason of more coke fines at a higher HM productivity was the higher flame temperature, and the I-type drum coke strength was opposed to coke reaction rate.
(3) Sampling coke properties relationship with BF operation:
(a) The required CSR index of No.3 and No.4 BF, and its online system were established by using the sampling coke properties at different gas permeability resistance and PCR to provide some reference for HM and coke production.
(b) The monthly averaged PCR and Tliquidus of 2014/12 was used for calculating necessary CSR of feed coke, it resulted that No.3 BF need the feed coke whose CSR is larger than 69, and No.4 BF need the feed coke whose CSR is 70 at least in order to maintain good permeability resistance (0.25).
Reference
[1] O. Isao, I. Morimasa, Tetsu-to-Hagane 90(9) (2004) 2-10.
[2] O. Kerkkonen, AISTech Proceedings 1 (2004) 469-481.
[3] S. Kubo et al., Ironmaking Coneference Proceedings (1990) 405-412.
[4] J.K. Chung, N.S. Hur, ISIJ International 37 (2) (1997) 119-125.
[5] Helleisen et al., McMaster Symposium 17 (1989) 27. [6] Y.C. Ko et al., CSC Research Report (2008). [7] M.T. Hong et al., CSC Research Report (1989). [8] M.T. Hong et al., China Steel Technical Report 2
(1989) 53-58.
[9] Z. Shiyong, Metallurgical Insdustry Press, Beijing (2005) 116.
[10] F. Yongning, Blast furnace coke (1995) 56.
[11] O. Levenspiel, Chemical Reaction Engineering, (1962) 370.
[12] J.S Shiau et al., Materials Transactions 53 (8) (2012) 1449-1455.
Table 3.Normalized data of DP/V, CSR, Tliquidus, and PCR for the day before sampling in 2007-2014
Table 4.The required CSR index of No.3 and No.4 BF at different DP/V (0.24-0.28) and PCR (140-180) based on the averaged Tliquidusin 2014.