Laboratory of Research in Microcirculation, University of the State of Rio de Janeiro
Email: [email protected] Received for publication on August 17, 2006 Accepted for publication on January 03, 2007
BASIC RESEARCH
SUBSTITUTION OF DRINKING WATER BY FRUCTOSE
SOLUTION INDUCES HYPERINSULINEMIA AND
HYPERGLYCEMIA IN HAMSTERS
Carlos Magno M. R. Barros, Rosane Q. Lessa, Mauricio P. Grechi, Tanial L. M. Mouço, Maria das Graças C. Souza, Nicolas Wiernsperger, Eliete Bouskela
Barros CMMR, Lessa RQ, Grechi MP, Mouço TLM, Souza MGC, Wiernsperger N. Bouskela E. Substitution of drinking water by fructose solution induces hyperinsulinemia and hyperglycemia in hamsters. Clinics. 2007;62(3):327-34.
PURPOSE: To test the possibility of obtaining a practical and stable model of hyperinsulinemia and hyperglycemia in hamsters, substituting the drinking water by 10% or 20% fructose solutions for a period of 2, 4, or 6 months.
METHODS: Male hamsters were divided into 3 main groups, further divided in 3 subgroups: Two months: Group Ia control (n = 51) received filtered water, Group Ib (n = 49) received 10% fructose solution instead of water, Group Ic (n=8) received 20% fructose solution instead of water. Four months: Group IIa control (n=8), Group IIb 10% fructose (n = 7), Group IIc 20% fructose (FIIc, n = 7). Six months: Group IIIa control (n = 6), Group IIIb 10% Fructose (n = 6), Group IIIc 20% Fructose (n = 5). All groups were fed with the same laboratory diet. The animals were weighed every 2 weeks during the study period. On the final day of each experiment (61st, 121st, and 181st day after the beginning of the study, respectively), the animals were weighed and anesthetized for blood collection to determine plasma glucose and insulin after at least a 12-h fast. Ten animals of group Ia and 10 of group Ib were evaluated to determine changes in macromolecular permeability induced by ischemia/reperfusion as measured in the cheek pouch microcirculation.
RESULTS: Compared to controls,the animals that drank the 10% or 20% fructose solution had significantly greater weight gain (P < .001), fasting plasma glucose (P < .001) Reperfusion, after 30 min ischemia, resulted in an immediate but reversible increase
in postcapillary leakage (L) of 89.0 ± 2.0 L/cm2 (group Ia - controls), and 116.5 ± 4.8 L/cm2 (group Ib 10% fructose), P <
.001.These results suggest that chronic administration of either 10% or 20% fructose solutions could be used to experimentally induce a stable hamster model of hyperinsulinemia and hyperglycemia.
CONCLUSION: The model might facilitate the study of basic mechanisms of hyperglycemia and hyperinsulinemia affecting the microvasculature as demonstrated by the findings regarding ischemia/reperfusion after only 2 months of treatment.
KEYWORDS: Insulinemia. Hyperglycemia. Fructose solution. Experimental animal model. Hamster.
INTRODUCTION
Diabetes mellitus comprises a group of metabolic dis-eases characterized by hyperglycemia resulting from de-fects in insulin secretion, insulin action, or both; long-term it is associated with permanent damage, dysfunc-tion, and failure of various organs.1 Several pathogenic processes are involved in the development of diabetes,
ranging from autoimmune destruction of pancreatic b-cells (type 1) with consequent insulin defficiency to ab-normalities that result in insulin resistance. Type 2 betes, which accounts for 90% to 95% of those with dia-betes, is among the most common of chronic diseases and comprises individuals who have insulin resistance and usually relative (rather than absolute) insulin defi-ciency. Glucose intolerance and hyperglycemia super-vene only when the pancreatic ß-cell is unable to main-tain compensatory hyperinsulinemia to overcome tissue resistance to insulin action.2
this increase occurring in developing countries.3 This dis-ease is frequently associated with other metabolic ab-normalities, sometimes called the “metabolic syndrome” or syndrome X, which includes central obesity, hyper-lipidemia, hypertension, and accelerated atherosclerosis; other abnormalities such as sleep apnea may also be as-sociated 4–7 This cluster of abnormalities is associated with a higher incidence of cardiovascular morbidity and mortality.8 The difficulty in avoiding these complications is well known in clinical practice, but an adequate con-trol of glycemia through medical monitoring, adherence to treatment, and awareness of the patient with respect to the disease could delay their appearance.9
Experimental models could be very useful in the study of these complications. A good and well used experimen-tal model consists of an intraperitoneal injection of streptozotocin or alloxan, which destroys the pancreas ß-cells, the only cells in the body that make a meaningful quantity of insulin10-12 and consequently produces mod-els of hyperglycemia and hypoinsulinemia. However, the fastest growing type of diabetes mellitus, type 2 diabe-tes, characterized by hyperglycemia and hyperinsulinemia, has few well characterized experimental models; as a rule, it is not easily produced in the laboratory. Insulin resist-ance has been reported in several animal models, includ-ing spontaneously hypertensive rats, Zucker fatty rats, in-sulin receptor substrate-1 (IRS-1)-knockout mice, and fructose-fed rats.13-15
The major predisposing factors to type 2 diabetes are obesity, decreased activity, and increasing age.16 Epide-miological studies in several countries have shown the influence of the diet composition on insulin action and on plasma glucose levels. Among these studies, it is re-ported that fructose ingestion causes insulin resistance, hyperglycemia, and hypertriglyceridemia in rats.17,18 Fructose-fed Sprague Dawley rats fed with 60% fructose-rich chow (i) for 4 weeks showed a reduction in the up-take of tritiated glucose by adypocytes in vitro and in endothelium-dependent vasodilation induced by acetyl-choline in aortic strips,19 (ii) for 6 weeks showed a re-duction to 80% in tyrosine phosphorilation of IRS-1 in the soleus muscle,20 and (iii) for 40 weeks showed a sig-nificant increase in fasting plasma insulin without hyperglycemia, a decrease of muscarinic receptors, an increased dependence on nitric oxide (NO), and an im-pairment of α
2-adrenergic-mediated relaxation.
21
Substi-tution of drinking water by 10% fructose solution in-duced a small increase in glycemia without significant changes in body weight, glycosilated hemoglobin, insulinemia, or triglyceridemia.22 Based on these reports, fructose was elected for testing. The objective was to test
the possibility of obtaining a practical and stable model of hyperinsulinemia and hyperglycemia in small rodents, such as hamsters, where further studies of the microcir-culation (cheek pouch, cremaster, dorsal chamber, etc.) could be performed. The continuous substitution of the drinking water by a fructose solution seemed easier than adding this carbohydrate to the animal chow. Two con-centrations of fructose were tested, 10% and 20%, and the stability of the model was determined by measuring fasting plasma glucose and insulin in these animals at 2, 4, and 6 months after the substitution. The use of this model was tested 2 months after the substitution by measuring changes in macromolecular permeability in-duced by ischemia/reperfusion in the cheek pouch mi-crocirculation.
MATERIALS AND METHODS
One hundred and forty-seven male Syrian golden hamsters (Mesocricetus auratus), 7 to 10 weeks old,
20% fructose solution. These 3 groups were followed for 180 days. All the animals were weighed every 2 weeks to evaluate the gain in body mass in all groups.
The following experiments were performed on the fi-nal day of this project: (61st, 121st, and 181st day, re-spectively), according to protocols approved by the Ethi-cal Committee of the State University of Rio de Janeiro (H36/94), always after a 12-h fast. The animals were anesthetized with an intraperitoneal injection, 0.2 mL/ 100 g body weight, of sodium pentobarbital (Pentobar-bital sodique, Sanofi, France, 60 mg/mL), and their body temperature was maintained at 37.5° ± 0.5°C with a heating pad controlled by a rectal thermistor (LB750 Thermostat System, Upsala Processdata AB, Sweden). Plasma glucose was evaluated through periorbital punc-ture using a One Touch® brand basic glucose meter and One Touch test strips (Lifescan Inc, Johnson & Johnson Co., Milpitas, CA, U.S.A.), always after at least a 12-h fast. Soon after the described process, 20 animals were exsanguinated through cardiac puncture using a syringe and needle. Approximately 2.5 mL of blood was col-lected from each animal. Each sample was centrifuged, and the serum was stored in a freezer for subsequent bio-chemical analysis of insulin assayed by
radioimmu-noassay using an 125I insulin kit (BioTrak, Amersham-Pharmacia Biotech, Piscataway, NJ, USA).21 In 20 ani-mals, 10 from Group CIa and 10 from Group FIb, cheek pouches of anesthetized animals were prepared for in-travital microscopy. Local ischemia was obtained by clampling the neck of the everted pouch and the increase in microvascular permeability was quantified as leakage of intravenously injected fluorescein isothiocyanate-la-belled dextran (FITC-dextran 150; MW = 150000).
In statistical presentations, estimates are given as means ± standard error of the mean (SEM), unless other-wise noted. Significance tests were done with analysis of variance (ANOVA). Statistical significance was declared when P < .05.
RESULTS
All the subgroups in the 3 groups evolved with pro-gressively increasing body weights throughout the experi-mental period, but the fructose groups (Ib, Ic, IIb, IIc, IIIb, and IIIc) had significantly higher (P < .001) increases
(Ta-bles 1-3).
Fasting plasma glucose concentrations (mg/dL) were significantly higher in the groups of animals drinking
Table 3 - Variation of body weight (g) in animals treated for 6 months with filtered water, 10%, or 20% fructose solution and the standard laboratory diet. Results are expressed as mean ± SEM.
Treatment Time (months)
0 1 2 3 4 5 6 PANOVA
Filt. water (n=6) 101,4g ± 1,24 6,8% ± 1,19 16,8% ± 1,19 19,7% ± 1,19 23,0% ± 1,19 25,1% ± 1,19 28,5% ± 1,19 0,0001* F10% Sol. (n=6) 97,5g ± 1,16 13,2% ± 1,19 28,4% ± 1,19 33,5% ± 1,19 39,2% ± 1,19 42,9% ± 1,19 44,7% ± 1,19
F20% Sol. (n=5) 97,6g ± 1,18 14,8% ± 1,19 31,5% ± 1,19 38,1% ± 1,19 43,8% ± 1,19 46,9% ± 1,19 47,6% ± 1,19
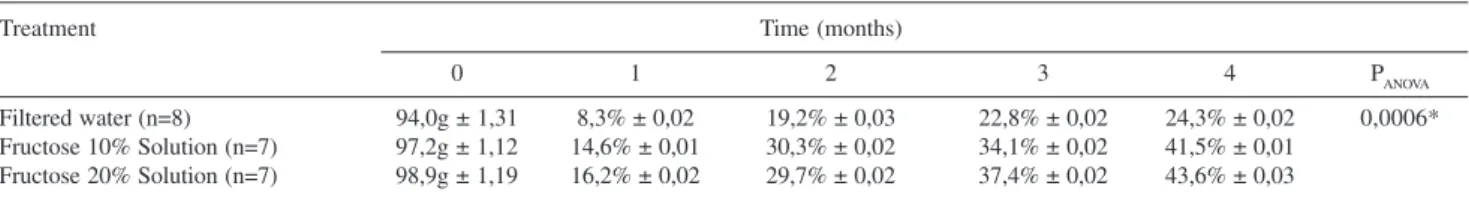
Table 2 - Variation of body weight (g) in animals treated for 4 months with filtered water, 10%, or 20% fructose solution and the standard laboratory diet. Results are expressed as mean ± SEM.
Treatment Time (months)
0 1 2 3 4 PANOVA
Filtered water (n=8) 94,0g ± 1,31 8,3% ± 0,02 19,2% ± 0,03 22,8% ± 0,02 24,3% ± 0,02 0,0006*
Fructose 10% Solution (n=7) 97,2g ± 1,12 14,6% ± 0,01 30,3% ± 0,02 34,1% ± 0,02 41,5% ± 0,01 Fructose 20% Solution (n=7) 98,9g ± 1,19 16,2% ± 0,02 29,7% ± 0,02 37,4% ± 0,02 43,6% ± 0,03
Table 1 - Variation of body weight (g) in animals treated for 2 months with filtered water, 10%, or 20% fructose solution and the standard laboratory diet. Results are expressed as mean ± SEM.
Treatment Time (days)
0 15 30 45 60 PANOVA
Filtered water (n=51) 98,6g ± 1,05 5,4% ± 0,01 10,5% ± 0,01 16,6% ± 0,01 18,7% ± 0,02 0,0009* Fructose 10% Solution (n=49) 99,5g ± 1,00 10,7% ± 0,01 15,3% ± 0,02 20,3% ± 0,02 28,0% ± 0,02
10% or 20% fructose solutions compared to the ones drinking filtered water during the 3 experimental peri-ods, as follows: Ia, 93.6 ± 2.9; Fib,149.6 ± 5.2; Fic, 141.5 ± 7.1, P < .001 (Figure 1a); CIIa, 80.3 ± 5.2; FIIb,
137.5 ± 8.6; FIIc, 137.7 ± 8.8, P < .001 (Figure 2a); and
CIIIa, 88.4 ± 2.3; FIIIb, 136.0 ± 5.6; FIIIc, 137.7 ± 8.8,
P < .001 (Figure 3a). No difference was observed
be-tween 10 vs. 20% fructose treatment, in any of the three main groups.
Similarly, fasting plasma insulin concentrations (µUI/ mL) were significantly higher in the groups of animals drinking 10% or 20% fructose solutions compared to the ones drinking filtered water during the 3 experimental periods, as follows: CIa, 67.7 ± 8.4; FIb, 137.5 ± 9.9; FI, 134.1 ± 8.9, P < .001 (Figure 1b); CIIa, 50.9 ± 9.3;
FIIb, 135.5 ± 8.0; FIIc, 137.0 ± 11.4, P < .001 (Figure
2b); and CIIIa, 78.7 ± 4.5; FIIIb, 125.0 ± 12.7; FIIIc, 126.6 ± 11.2, P < .001 (Figure 3b). Again, no difference
was observed between 10 vs. 20% fructose treatment, in any of the three main groups.
Reperfusion, after 30 min ischemia, resulted in a signifi-cant immediate, but reversible, increase in postcapillary leak-age (L) in Group FI compared with Group CI of 116.5 ± 4.8 L/cm2 vs 89.0 ± 2.0 L/cm2, respectively (P < .001).
Figure 2 - Effects on glycemia (a) and insulinemia (b) of filtered water, 10% fructose solution, or 20% fructose solution on animals treated for 4 months. Results expressed as mean ± SEM; *** = P < .001 compared to controls.
Figure 1 - Effects on glycemia (a) and insulinemia (b) of filtered water, 10% fructose solution, or 20% fructose solution on animals treated for 2 months.. Results expressed as mean ± SEM; *** = P < .001 compared to controls.
Differential duration of the experimental period did not cause significant changes in the studied parameters, which strongly suggests that the model is stable.
DISCUSSION
The effect of chronic treatment with fructose on body weight has been well established experimentally.24 Pre-vious studies in our laboratory have demonstrated that the substitution of drinking water by 10% fructose so-lution increases weight gain when used continuously for 2, 4, and 6 months.25,26 Since fructose consumption in the diet in the form of sacarose is increasing in indus-trialized and developing countries, this is important in-formation for the public health system.
The increase in body mass was greater in the groups that drank 10% or 20% fructose solution (Ib, Ic, IIb, IIc, IIIb, and IIIc) compared to those that drank filtered wa-ter (Ia, IIa, and IIIa). This result may be explained by an increase in total caloric intake by the fructose groups during the experimental period. Fructose is an energy-generating molecule that helps to build and maintain body mass. The observed increase in plasma insulin lev-els in these groups could also contribute to the weight gain. Insulin, a hormone essential for life, exerts criti-cal control over carbohydrate, fat, and protein metabo-lism. Control animals (filtered water) did not show the same weight gain because water is not an energy-gen-erating molecule, and no increase in plasma insulin lev-els was detected in these groups (Ia, IIa, and IIIa). How-ever, using a similar model, namely substitution of drink-ing water by 10% fructose solution for 18 weeks, Félétou and co-workers22 found no significant increase in body weight compared to control hamsters.
Glucose homeostasis in the fasting state is the bal-ance between glucose production by the liver and glu-cose utilization by muscle and fat. Although the fine-tuning of glucose metabolism may be influenced by many hormones and metabolic intermediates, normal glucose disposal depends primarily on 4 factors: (1) the ability of the body to secrete insulin acutely and in a sustained fashion, (2) the ability of insulin to inhibit he-patic glucose output, (3) the ability of glucose to pro-mote glucose disposal or insulin sensitivity, and (4) the ability of glucose to enter the cells in the absence of in-sulin.27 The pathogenesis of type 2 diabetes appears to involve at least 2 defects in this regulation system. The earliest detectable lesion is insulin resistance in periph-eral tissues16,28,29 progressing to hyperinsulinemia and hyperglycemia.
In our studies, animals subjected to substitution of
drinking water by 10% fructose solution showed a sig-nificant increase in glycemia, similar to findings reported by Hwang and co-workers30,31 and Félétou and co-work-ers.32 Addition of fructose to the diet of rats for a long period also elicited an increase in plasma insulin lev-els.33 In the present study, however, the extent of the metabolic changes induced by fructose was markedly more severe than that reported under similar experimen-tal conditions22 where only glycemia was significantly different from controls. In various animal models, in-cluding hamsters, hyperinsulinemia, hypertriglyceride-mia, hypercholesterolehypertriglyceride-mia, and insulin resistance have been reported with a fructose-enriched diet.34,35 In con-trast, fasting glycemic levels were not affected in those studies. These discrepancies with the present study could be explained primarily by the severity of the diet. Most studies are performed with food containing fructose that was 60% of the total caloric intake,30 leading to a daily intake of approximately 16 g of fructose/hamster33 in-stead of the 1 to 2.4 g ingested in the present study. There is no significant difference in the substitution of drinking water by either a 10% or 20% fructose solu-tion, probably because, even with the 20% fructose so-lution, the ingestion of fructose is low.30,34 The present study measured nonfasting plasma glucose and insulin while other works reported fasting plasma glucose and insulin.
Most of the metabolic effects of fructose are possi-bly due to its rapid utilization by the liver and its by-passing the phosphofructokinase regulatory step, with clear consequencences to carbohydrate and lipid me-tabolism, such as hepatic increase in pyruvate and lac-tate production, activation of pyruvate dehydrogenase, and a balance change from oxidation to esterification of nonesterified fatty acids, resulting in increased se-cretion of very-low-density-lipoprotein (VLDL).35 The long-term consequence of fructose absorption leads to triglyceridemia, decreased glucose tolerance, and hyperinsulinemia.36
fructose solution. One advantage of this model is its tem-poral stability. Moreover, the substitution of the drink-ing water by a 10% fructose solution is easier to accom-plish than the addition of fructose to the laboratory diet offered to the animal.
ACKNOWLEDGEMENTS
The study was supported by grants from the National Research Council [CNPq, 521850/96-7 (NV)] and from the Research Supporting Agency of Rio de Janeiro State (FAPERJ E-26/150.141/99 and E-26/170.522/00).
RESUMO
Barros CMMR, Lessa RQ, Grechi MP, Mouço TLM, Souza MGC, Wiernsperger N. Bouskela E. Substituição da água por solução de frutose induz hiperinsulinemia e hiper-glicemia em hamster. Clinics. 2007;62(3):327-34.
OBJETIVO: Testar a possibilidade de obtenção de um modelo prático e estável de hiperinsulinemia e hiper-glicemia em hamsters substituindo a água de beber por soluções de frutose a 10% ou 20% por um período de dois, quatro ou seis meses.
MÉTODOS: Hamsters machos foram divididos em 3
grupos e cada grupo subdividido em 3 subgrupos. Dois
anestesiados para coleta de sangue para determinação da glicose e da insulina sérica, após jejum de pelo menos 12 h. Em 10 animais do grupo Ia e em 10 do grupo Ib avaliamos, na microcirculação da bolsa da bochecha, a variação da permeabilidade a macromoléculas induzida por isquemia/ reperfusão.
RESULTADOS: Comparados ao grupo controle, os
animais que beberam soluções de frutose a 10 ou 20% tiveram um aumento significativo de massa corporal (p<0,001) e da glicemia de jejum (p<0,001). Durante o experimento de reperfusão, após 30 min de isquemia, houve um aumento imediato e reversível do extravasamento (E)
pós-capilar de 89,0 ± 2,0 E/cm2 (grupo Ia) e 116,5 ± 4,8 E/cm2 (grupo Ib), p<0,001.
CONCLUSÃO: Esse estudo sugere que a utilização
crônica de solução de frutose a 10% ou 20% pode ser usada para induzir experimentalmente um modelo estável de hiperinsulinemia e hiperglicemia em hamsters. Este modelo deverá facilitar o estudo de mecanismos básicos que alteram a microcirculação, como demonstrado pelos achados em isquemia/reperfusão já aos 2 meses.
UNITERMOS: Insulinemia, Glicemia, Solução de frutose, Modelo experimental, Hamster.
REFERENCES
1. American Diabetes Association. Diagnosis and classification of diabetes mellitus. Diabetes Care. 2006;29 (suppl.1):S43-S48.
2. Goldberg RB. Prevention of type 2 diabetes. Med Clin North Am. 1998;82:805-21.
3. Salles GF, Bloch KV, Cardoso CR. Mortality and predictors of mortality in a cohort of Brazilian type 2 diabetic patients. Diabetes Care. 2004;27:1299-1305.
4. Hales CN, Barker DJ, Clark PM, Cox LJ, Fall C, Osmond C, et al. Fetal and infant growth and impaired glucose tolerance at age 64. BMJ. 1991;303:1019-22.
5. Reaven GM. Pathophysiology of insulin resistance in human disease. Physiol Rev. 1995;75:473-86.
6. Mayfield J. Diagnosis and classification of diabetes mellitus: new criteria. Am Ac. Family Physicians. 1998;58:1355-62:1369-70. 7. Wiernsperger N, Nivoit P, Bouskela E. Obstructive sleep apnea and insulin
resistance: a role for microcirculation? Clinics, 2006;61:253-266.
8. Fagan TC, Deedwania PC. The cardiovascular dysmetabolic syndrome. Am J Med. 1998;105(IA):77S-82S.
9. Maki KC. Dietary factors in the prevention of diabetes mellitus and coronary artery disease associated with the metabolic syndrome. Am J Cardiol. 2004;93(11A):12C-17C.
10. Lash JM, Bohlen HG. Structural and functional origins of supressed acetylcholine vasodilation in diabetic rats intestinal arterioles. Circ Res. 1991;69:1259-68.
11. Maree A, Peer G, Iaina A, Blum M, Wollman Y, Csernihovsky T, et al. Nitric oxide in streptozotocin-induced diabetes mellitus in rats. Clinical Science. 1996;90:379-84.
12. Shostak A, Gotloib L. Increased peritoneal permeability to albumin in streptozotocin diabetic rats. Kidney Int. 1996;49:705-14.
14. Anai M, Funaki M, Ogihara T, Terasaki J, Inukai K, Katagiri H, et al. Altered expression levels and impaired steps in the pathway of phosphatidyl-inositol 3-kinase activation via insulin receptor substrates 1 and 2 in Zucker fatty rats. Diabetes. 1998;47:13-23.
15. Yamauchi T, Tobe K, Tamemoto H. Insulin signaling and insulin actions in the muscle and livers of insulin-resistant, insulin receptor substrate 1-deficient mice. Mol Cell Biol. 1996;16:3074-3084.
16. Kahn CR. Insulin action, diabetogenIs and the cause of type II diabetes (Banting Lecture). Diabetes. 1994;43:1066-84.
17. Zavaroni I, Sanders S, Scott S, Reaven GM. Effect of fructose feeding on insulin secretion and insulin action in the rat. Metabolism. 1980;29:970-3.
18. Tobey TA, Mondon CE, Zavaroni I, Reaven GM. Mechanism of insulin resistance in fructose-fed rats. Metabolism. 1982;31:608-12. 19. Kotchen TA, Reddy S, Zhang HY. Increasing insulin sensitivity lowers
blood pressure in the fructose-fed rat. Am J Hypertens. 1997;10:1020-6.
20. Hyakukoku M, Higashiura K, Ura N, Murakami H, Yamaguchi K, Wang L, et al. Tissue-specific impairment of insulin signaling in vasculature and skeletal muscle of fructose-fed rats. Hypertens Res. 2003;26:169-76.
21. Takagawa Y, Berger ME, Hori MT, Tuck ML, Golub MS. Long-term fructose feeding impairs vascular relaxation in rat mesenteric arteries. Am J Hypertens. 2001;14:811-17.
22. Félétou M, Boulanger M, Staczek J, Broux O, Duhault J. Fructose diet and VEGF-induced plasma extravasation in hamster cheek pouch. Acta Pharmacol Sin. 2003; 24:207-11.
23. Reeves PG, Nielsen FH, Fahey Jr. GC. AIN-93 purified diets for laboratory rodents: final reports of the American Institute of Nutrition ad Hoc writing committee on the reformulation of the AIN-76A Rodent Diets. Am Inst Nut. 1993;1939-50.
24. Park OJ, Cesar D, Faix D, Wu K, Shackleton CH, Hellerstein MK. Mechanisms of fructose-induced hypertriglyceridemia in the rat. Activation of hepatic pyruvate dehydrogenase through inhibition of pyruvate dehydrogenase kinase. Biochem J.1992;282(15)(Pt 3):753-7.
25. Grechi MP, Lessa RQ, Barros CMMR, Souza, MGC, Bouskela E. Efeito do tratamento por quatro meses com soluções de frutose a 10 e 20% sobre a permeabilidade microvascular em hamsters após isquemia-reperfusão. Resumos do Congresso SOHERJ 1999;27.
26. Grechi MP, Lessa RQ, Barros CMMR, Souza, MGC, Bouskela E. Effects of fructose 20% solutions on macromolecular permeability in the microcirculation. FASEB J. 2000;14:A12.
27. Bergman RN, Steil GM, Bradley DC, Watanabe RM. Modeling of insulin action in vivo. Annu Rev Physiol. 1992;54:861-83.
28. Bogardus C, Lillioja S, Bennett PH. Pathogenesis of NIDDM in Pima Indians. Diabetes Care. 1991;14:685-90.
29. Martin BC, Warram JH, Krolewski AS, Bergman RN, Soeldner JS, Kahn CR. Role of glucose and insulin resistance in development of Type II diabetes mellitus: results of a 25-year follow-up study. Lancet. 1992;340:925-9.
30. Hwang IS, Ho H, Hoffman BB, Reaven GM. Fructose-induced insulin resistance and hypertension in rats. Hypertension. 1987;10:512-6. 31. Huang BW, Chiang MT, Yao HT, Chiang W. The effect of high-fat and
high-fructose diets on glucose tolerance and plasma lipid and leptin levels in rats. Diabetes Obes Metab. 2004;6:120-6.
32. Félétou M, Bonnardel E, Canet E. Bradykinin and changes in microvascular permeability in the hamster cheek pouch: role of NO. Br J Pharmacol. 1996;118:1371-6.
33. Iyer SN, Katovich MJ. Fructose feeding in rats is not associated with sodium retention. Am J Hypertens. 1996;9:1018-23.
34. Kasim-Karakas SE, Vriend H, Almario R, Chow LC, Goodman MN. Effects of dietary carbohydrates on glucose and lipid metabolism in golden Syrian hamsters. J Lab Clin Med. 1996;128:208-13. 35. Taghibiglou C, Carpentier C, Van Iderstine SC, Chen B, Rudy D, Ailton
Al. Mechanisms of hepatic very low-density lipoprotein overproduction in insulin resistance. J Biol Chem. 2000;275:8416-25.