1Universidade Federal de Pernambuco, Centro de Ciências da Saúde, Programa de Pós-Graduação em Nutrição. Av. Professor Morais Rego, 1235, Cidade Universitária, 50670-901, Recife, PE, Brasil. Correspondência para/Correspondence to: DRL SANTOS. E-mail: <[email protected]>.
Article based on the master’s thesis of DRL SANTOS, entitled “Excesso de peso em pré-escolares: o papel do consumo alimentar”. Universidade Federal de Pernambuco; 2015.
Excess weight in preschool children:
The role of food intake
Excesso de peso em pré-escolares
:
o papel do consumo alimentar
Dayse Rafaele Lima dos SANTOS1
Pedro Israel Cabral de LIRA1
Giselia Alves Pontes da SILVA1
A B S T R A C T
Objective
The study aimed to compare the food intake of overweight/obese and normal weight preschoolers and to verify whether excess weight is associated with low birth weight, catch-up growth, early weaning, and physical activity/inactivity.
Methods
This case-control study was conducted in family healthcare units of the city of Olinda, Pernambuco, from May to August 2014.
Results
A total of 253 children were studied, 84 with ‘excess weight’ and 164 with ‘normal weight’. In the ‘overweight/ obese’ and ‘normal weight’ groups, 77% and 43% of the children, respectively, had high calorie intake. The ‘overweight/obese’ group had lower fruit intake, higher maternal education level, higher family income, higher maternal excess weight, and presence of catch-up growth and inactivity.
Conclusion
The results suggest that food intake has an important role, but that other variables contribute to excess weight in children. Recognition of the problem’s many causes should guide the public policies directed at this age group to prevent this nutritional disorder.
R E S U M O
Objetivo
Comparar o consumo alimentar entre pré-escolares com excesso de peso e eutróficos e verificar a associação do baixo peso ao nascer, presença de catch-up growth, desmame precoce e atividade física/sedentarismo com o excesso de peso.
Métodos
Realizado um estudo caso-controle em Unidades de Saúde da Família da cidade de Olinda, Pernambuco, de maio a agosto de 2014.
Resultados
Foram estudadas 253 crianças, sendo 84 com excesso de peso e 169 eutróficas. No grupo excesso de peso, 77% apresentavam consumo calórico excessivo e, no grupo eutrófico, 43%. Observou-se menor consumo de fruta no grupo excesso de peso, assim como maior escolaridade materna, maior renda familiar, excesso de peso materno, presença de catch-up growth e comportamento sedentário.
Conclusão
Os resultados sugerem que o consumo alimentar apresenta papel importante, mas que outras variáveis contribuem para o excesso de peso infantil. O reconhecimento de que o problema tem origem multicausal deve nortear as políticas públicas voltadas para o grupo etário estudado com o objetivo de prevenir esse agravo nutricional.
Palavras-chave: Pré-escolar. Consumo alimentar. Obesidade. Sobrepeso.
I N T R O D U C T I O N
In all continents the growing prevalence of overweight/obesity in children and adolescents over the years is visible1. Brazil, which is undergoing nutrition transition, presents the same trend, with one of the highest global prevalences of excess weight in children, at 33.5%2.
Excess weight in children is associated with many morbid conditions, such as respiratory system, cardiovascular, and endocrine diseases, and psychological and social consequences as it may compromise self-esteem, leading to long-term psychological consequences3.
The foods the child consumes in the first years of life not only influences current, but also future weight gain. Despite ample knowledge about the benefits of breastfeeding for the infant, such as preventing obesity, children are being weaned increasingly earlier, and the introduction of complementary foods is being done incorrectly and early4.
Families’ food practices have exposed children early on to foods recognizably associated
with excess weight gain. The lack of health food options in the household, as observed in the last years with respect to the change in Brazilian families’ diet composition, contributes to a higher intake of foods high in sugar, salt, and fats5, and lower intake of fruits and vegetables, increasing the prevalence of obesity and its comorbidities6.
Children’s nutritional status, whether overweight or obesity, stems from the interaction of many factors, some acting since the prenatal period and others dependent on the postnatal environment to which the child is exposed7.
Diet is very important to appropriate nutrition, both in terms of quality and quantity, and preschoolers deserve special attention given their biological characteristics and the fact that the eating behavior acquired during childhood tends to remain stable in the long run8.
preschoolers and verify whether excess weight is associated with low birth weight, early weaning, presence of catch-up growth, and physical activity/inactivity.
M E T H O D S
This case-control study included two groups of preschoolers categorized by nutritional status. The study was conducted in Unidades de
Saúde da Família (USF, Family Healthcare Units)
in Sanitary District I of Olinda, Pernambuco. The research project was approved by the Human Research Ethics Committee of the
Universi-dade Federal de Pernambuco (CAAE nº
25731913.9.0000.5208), and all parents or guardians were informed about the study objectives and agreed to sign an Informed Consent Form.
The ‘overweight/obese’ group consisted of children with a Body Mass Index (BMI)-for-age Z-score ≥1, and the normal weight group consisted of children with a BMI-for-age Z-score between -2 and 1, based on the curves provided by the World Health Organization (WHO) for assessing child growth9.
The inclusion criteria were: term children aged 24 to 59 months, registered in the USF of Sanitary District I of the municipality of Olinda. The exclusion criteria were: children with known underlying or chronic diseases as these may affect nutritional status, and children with physical limitations that prevented anthropometric assessment.
The study began by selecting the locations where the children would be recruited, randomly choosing a sanitary district, and then randomly choosing the USF. In the end, Sanitary District I of the municipality of Olinda and the USF Jardim
Fragoso, USF Jardim Atlântico, USF V Etapa de
Rio Doce, USF Ilha de Santana I, and USF Ilha de
Santana II were chosen. The power of the sample
was calculated from the study data, using the formula recommended for case-control studies.
The program Epi Info version 6.04 (Centers for Disease Control and Prevention, Atlanta, Georgia, United States of America) made the calculation using the parameters: high intake in the ‘overweight’ group (77%), high intake in the ‘normal weight’ group (43%), and significance level of 5%. The power for the study sample turned out to be 90% (84 cases to 169 controls).
The main exposure variable was food intake. To assess calorie intake, we calculated the mean calorie intake recommended by the Dietary Reference Intakes (DRI) and introduced a cut-off point to the value provided: proper intake was defined as intake ≤ mean intake +1 standard deviation, and excessive intake, as > than the mean intake +1 standard deviation. The median protein, carbohydrate, and fat intakes, and the energy percentage provided by each macronutrient were calculated. The study also analyzed fruit, vegetable, and superfluous food intakes in the past 24 hours.
The outcome variable was nutritional status, classified as excess weight (BMI-for-age Z-score ≥1) and normal weight (BMI-for-age Z-score between -2 and <1).
The study covariates were: exclusive breastfeeding duration (<4 months, ≥4 months), child’s birth weight (≤2,999 and ≥4,000 grams and 3,000 - 3,999 grams), weight gained in the first three months of life (Z-score <0.67 and Z-score ≥0.67), level of physical activity (little active and active), sedentary behavior (yes and no), maternal nutritional status (normal weight/ underweight, overweight), and maternal intake of fruits and non-starchy vegetables in the past 24 hours.
Data were collected from May to August 2014, after a pilot study tested the applicability of the instrument and field logistics. Forms were used to guide the interviews with the mothers. The collected data included current weight and height of the mother and child, food intake of the mother and child in the past 24 hours (24-hour recall), and child’s level of physical activity (specific form)10.
Weight and height were collected as recommended by Frisancho11. Current weight was verified during the interview with a portable electronic scale (Wiso w939, BarreirosSãoJosé,
Santa Catarina, Brazil with a capacity of 180kg
and accuracy of 100g. The children and mothers were measured barefoot and in light clothing, standing erect at the center of the scale platform. Height was measured by a portable anodized aluminum stadiometer (Wiso) with platform. The stadiometer has a length of 216cm and graduation of 1mm.
Food intake data were collected by a 24-hour recall during an interview with the child’s mother conducted on a weekday (Monday through Friday). In order to obtain more accurate data, the following were noted: information about the meal, location (foods consumed away-from-home), meal time, type of foods consumed, how the foods were prepared and the main ingredients, brand, the amounts in cooking units, and special characteristics of the food or beverage (diet, light, organic, enriched (flour) with folic acid and iron). Information about the addition of salt, sugar, oil, and commercial sauces and broths were also recorded. Since the amounts consumed were recorded in cooking units, these units had to be converted into grams, for which the table created by Pinheiro et al.12 was used.
The calorie, protein, carbohydrate, and fat contents of the children’s diets were analyzed. Intrapersonal food intake variation was determined by administering one more 24-hour dietary recall in 40% of the sample, chosen randomly. These new recalls were conducted at least fifteen days apart, repeating the procedure
used in the first 24-hour recall interview. The distribution of energy, protein, lipid, and carbohydrate intakes was adjusted by removing intrapersonal variability, using the method proposed by the Iowa State University13,14. The energy inadequacy proportion corresponded to the proportion of individuals whose energy intake did not reach the Estimated Energy Requirement and the Estimated Average Requirement. Based on the mean calorie requirement for age provided by the DRI, children who consumed one standard deviation above the mean intake were considered to have high calorie intake.
Superfluous commercial products were defined as those having too much lipids and/or sugars, or undesirable substances for this age group, such as food dyes and chemical preservatives (instant soups, instant noodles, fruit drink mixes, carbonated drinks, candies, jelly, fermented milk products, pudding, sandwich cookies, savory snacks, popcorn, chocolate milk, ice cream, chocolate, mortadella, baby fruit pots and pouches, hot dogs, hamburger patties, and salami).
A form, validated in 2005 for the preschooler population of Olinda (PE) by a group of Brazilian researchers, included questions that aimed to determine the level of physical activity based on the time spent daily on outdoor games and activities, and questions that aimed to determine the time spent daily on sitting activities (time watching television)10. The level of physical activity was classified into two categories, ‘active’ and ‘little active’. Children who spent fewer than 60 minutes a day playing outdoors were defined as little active. Time watching television was also classified dichotomously. Those who watched television for more than two hours a day were considered more exposed (greater exposure >2h/day, sedentary behavior), and those who watched television for less than two hours a day were considered less exposed (smaller exposure <2h/day, no sedentary behavior).
processed the anthropometric data. The diets were calculated and analyzed using the software NutWin (version 3.0, General Public License, São
Paulo, Brazil). The proximate composition of foods
that were not in the program was taken from food composition tables or data provided by the manufacturer15,16.
The data were digitized twice and processed by the resource Validate, of Epi Info, version 6.04 Statistical analysis was performed by the software Statistical Package for the Social Sciences (SPSS Inc., Chicago, Illinois, United States) version 13.0. The Kolmogorov-Smirnov test verified whether the continuous variables had normal distribution. Variables with normal distribution were expressed as mean and standard deviation, and those without normal distribution, as median and its respective interquartile range. Univariate analysis using the Chi-square test calculated the p-value and 95% Confidence Interval (95%CI). Logistic regression analysis identified the variables associated with excess weight. The explanatory variables with p<0.20 in univariate analysis (Chi-square test) were included in the model, which was adjusted three times, followed by an explanatory model of excess weight. The Mann-Whitney U test compared the medians. At the end of the analysis, only variables with p<0.05 were considered statistically and significantly associated with the outcome.
R E S U L T S
A total of 253 children aged 24 to 59 months were assessed by interviewing the mothers at family healthcare units in the municipality of Olinda (PE). More than half of the children was male (n=147, 58%) with a mean age of 40 months (Standard Deviation-SD=±10.5).
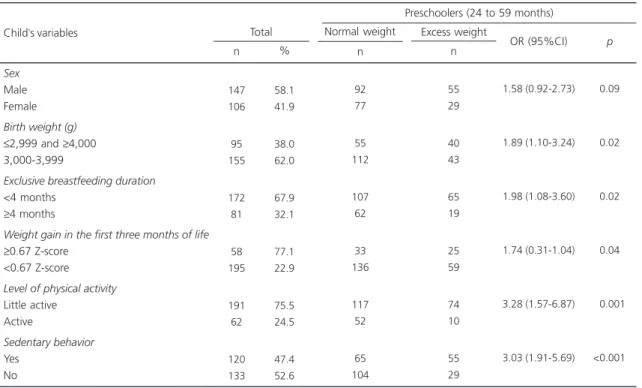
Table 1 presents the characterization of the mothers according to socioeconomic, demographic, and intake variables. Birth weight
≤2,999 and ≥4,000 g, exclusive breastfeeding duration shorter than four months, excess weight
gain in the first three months of life, little physical activity, and sedentary behavior were more frequent in children with excess weight (Table 2).
The mean recommended calorie intake (according to the DRI) for the study age group was 1,190.9kcal (SD=±189.8). Only 11.4% (29/253) of the children consumed less energy than the recommended mean. The excess weight group had a mean caloric intake of 133.5% (1,589.6kcal/1,190.9kcal) of the recommended intake, and the normal weight group had a mean caloric intake of 110.1% (1,321.4kcal/1,190.9 kcal) of the recommended intake, showing that caloric intake is increasing regardless of group. Table 3 shows the variables related to the children’s food intake.
Regarding the median calorie and macronutrient intakes, and the percentage of calories provided by each macronutrient, children in the excess weight group presented higher median values for most of these parameters (Table 4).
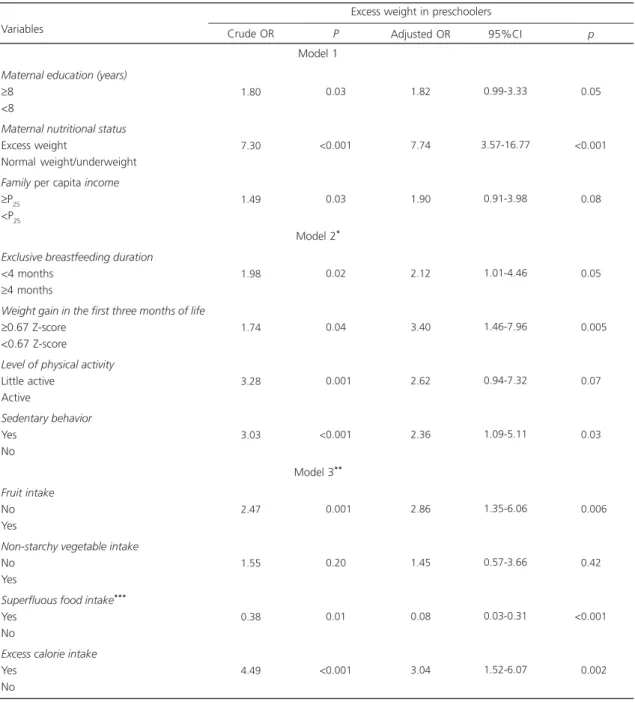
The adjusted Odds Ratio (OR) show that excess weight in preschoolers remained significantly associated with maternal nutritional status (OR=7.74; 95%CI=3.57-16.77), shorter exclusive breastfeeding duration (OR=2.12; 95%CI=1.01-4.46), excess weight gain in the first t h re e m o n t h s o f l i f e ( O R = 3.40; 95%CI=1.46-7.96), sedentary behavior (OR=2.36; 95%CI=1.09-5.11), superfluous food intake (OR=0.08; 95%CI=0.03-0.31), and excess calorie intake (OR=3.04; 95%CI=1.52-6.07) (Table 5).
D I S C U S S I O N
may stem from stimuli or health problems during a critical development period. The deterministic character of these changes should be emphasized as phenotype can change over time thanks to developmental plasticity, allowing beneficial interventions to change this initial scenario17.
In the present study, the overweight/obese group had a higher frequency of low birth weight, considered a proxy of intrauterine growth restriction. High birth weight was also more frequent in this group than in the normal weight group. Newborns programmed to be small but who, for some reason, presented intrauterine catch-up growth, may have normal birth weight or be large for gestational age, and yet will have more body fat, predisposing them to the metabolic syndrome in the future. This may explain the U-shaped curve, that is, a higher risk
Table 1. Characterization of maternal socioeconomic, demographic, and intake variables by the nutritional status of preschoolers aged 24 to 59 months. Olinda (PE), Brazil, 2014.
Maternal age (years)
≥20 <20
Maternal education (years)
≥8 <8
Maternal nutritional status Excess weight
Normal weight/underweight Maternal occupation Homemaker/unemployed Employed
Per capita family income
≥P25 <P25
Cash transfer program No
Yes
Maternal fruit intake No
Yes
Maternal vegetable intake No Yes Variables 241 12 126 127 165 88 163 90 190 63 72 181 134 119 168 85 95.3 04.7 49.8 50.2 65.2 34.8 64.4 35.6 75.1 24.9 28.5 71.5 52.9 47.1 66.4 33.6 n % Total n Normal weight 163 6 76 93 90 79 109 60 120 49 49 120 84 85 110 59 n Excess weight 78 6 50 34 75 9 54 30 70 14 23 61 50 34 58 26 2.09 (0.65-6.68) 1.80 (1.06-3.06) 7.30 (3.44-15.55) 1.00 (0.58-1.74) 1.49 (0.72-2.95) 1.08 (0.60-1.94) 1.48 (0.87-2.52) 1.19 (0.68-2.09)
OR (95%CI) p
<0.210
<0.030
<0.001
<0.970
<0.030
<0.790
<0.140
<0.530
Note: OR: Odds Ratio; 95%CI: 95% Confidence Interval.
Preschoolers (24 to 59 months)
of obesity in small-for-gestational-age and large-for-gestational-age children18.
In the first months of life, high body weight is considered a predictor of nutritional status in many life stages as it reflects environmental and genetic conditions to which the child is exposed19. Excess weight gained in the first three months of life of the study children, namely, catch-up growth, was higher in the overweight/obese group than in the normal weight group.
In this study the frequency of exclusive breastfeeding was low, corroborating the data of the Pesquisa Nacional de Demografia e
Saúde (PNDS, National Demographic and
Health Survey), which found an exclusive breastfeeding duration of only two months in
Table 2. Variables of preschoolers aged 24 to 59 months by nutritional status. Olinda (PE), Brazil, 2014.
Sex Male Female Birth weight (g)
≤2,999 and ≥4,000 3,000-3,999
Exclusive breastfeeding duration <4 months
≥4 months
Weight gain in the first three months of life
≥0.67 Z-score <0.67 Z-score Level of physical activity Little active
Active
Sedentary behavior Yes
No
Child’s variables
147 106 95 155 172 81 58 195 191 62 120 133 58.1 41.9 38.0 62.0 67.9 32.1 77.1 22.9 75.5 24.5 47.4 52.6 n % Total n Normal weight 92 77 55 112 107 62 33 136 117 52 65 104 n Excess weight 55 29 40 43 65 19 25 59 74 10 55 29 1.58 (0.92-2.73) 1.89 (1.10-3.24) 1.98 (1.08-3.60) 1.74 (0.31-1.04) 3.28 (1.57-6.87) 3.03 (1.91-5.69)
OR (95%CI) p
<0.090
<0.020
<0.020
<0.040
<0.001
<0.001
Note: OR: Odds Ratio; 95%CI: 95% Confidence Interval.
Preschoolers (24 to 59 months)
Table 3. Intake of fruits, non-starchy vegetables, and superfluous foods by preschoolers aged 24 to 59 months. Olinda (PE), Brazil, 2014.
Fruit intake No Yes
Non-starchy vegetable intake No
Yes
Superfluous food intake*
Yes No
Excess calorie intake Yes
No
Child’s variables
119 134 199 54 221 32 138 115 47.0 53.0 78.7 21.3 87.4 12.6 54.5 45.5 n % Total n Normal weight 67 102 129 40 154 15 73 96 n Excess weight 52 32 70 14 67 17 65 19 2.47 (1.44-4.23) 1.55 (0.79-3.04) 0.38 (0.18-0.81) 4.49 (2.48-8.15)
OR (95%CI) p
<0.001
<0.200
<0.010
<0.001
Note: *Superfluous foods: Those whose composition presents excessive amounts of lipids and/or sugars, or that contain undesirable substances for
this age group, such as dyes and chemical preservatives. OR: Odds Ratio; 95%CI: 95% Confidence Interval.
2006, only slightly higher than that found in 199621.
The present study found that children with excess weight had a higher percentage of excess calorie intake and a lower percentage of fruit intake. In different regions of the country, children younger than two years consume low quality complementary foods, with frequent intake of cow milk, flours, chocolate milk, sugar, savory snacks, carbonated beverages, and sweets22,23. PNDS data show that low frequency of daily fruit and vegetable intakes is associated with low food quality21.
Generally, the mean energy intake of the children exceeded the reference values, corroborating Fidelis & Osorio24, who found similar results in children aged less than five years from
Pernambuco. This may be explained by the
changing dietary pattern of the Brazilian population, which has been undergoing modifications since the 1990s: the population adopts a diet with high proportions of fat, especially saturated fat, and simple carbohydrates, and low proportions of complex carbohydrates, fibers, vitamins, and minerals, evidencing two distinct scenarios in which the diet contains nutritional excesses and inappropriate foods8.
In households, the parents’ lifestyle and intrafamilial relationships may have great influence on diet and food choices, and affect the energy balance of the food they consume.
Hereditary and environmental factors transmitted from the parents to the child may put the child at risk of developing an obesogenic lifestyle25.
The present study evidenced the association between maternal nutritional status and excess weight in the child, with a higher percentage of mothers with BMI ≥25.0 in the group of children with excess weight. The prevalence of overweight/obesity reported by Bernardo et al.26 was 1.58 times higher in schoolers whose mothers were preobese/obese and 1.41 times higher in schoolers whose parents were preobese/obese compared with mothers and fathers without the condition. Thus, early on, children need to be in an environment with a healthy and diverse diet, and adequate supply of fruits and vegetables as this will determine the establishment of healthy food habits.
High intake of processed foods can be a reflex of a higher household availability of these foods. According to the Family Budget Survey, the household availability of both cookies and carbonated drinks increased 400% between 1974/1975 and 2002/200327. Data from the National Household Sampling Survey show that the Brazilian income per capita increased, with a growth of socioeconomic class C, especially between 2003 and 200928, which may facilitate the acquisition of these foods. In addition to better income, these foods have become more affordable to socioeconomic classes D and E.
Table 4. Median, and maximum and minimum calorie and macronutrient intakes, and percentage contribution of macronutrients to total calorie intake of preschoolers aged 24 to 59 months. Olinda (PE), Brazil, 2014.
Calorie intake (kcal) Protein intake (g) % of total calorie intake Carbohydrate intake (g) % total calorie intake Total lipid intake (g) % total calorie intake
1589.6
0052.8
0013.1
0217.6
0055.3
0056.0
0031.8
342.0-3017.0 9.9-109.0
5.6-20.0 48.5-424.0
39.2-71.4 6.5-117.0 17.1-49.8
Excess weight (n=84)
Preschoolers (24 to 59 months) Variables
Median Minimum-Maximum
1321.4
0040.8
0012.1
0183.6
0054.5
0049.5
0033.6
716.0-4527.0 4.1-235.2
5.3-56.8 43.6-627.9
19.4-78.4 11.3-184.1
13.7-45.5
Normal weight (n=169) Median Minimum-Maximum
<0.01 <0.01 <0.01 <0.01
<0.19
<0.10 <0.01
The present study also found a significant association between maternal formal education >8 years and excess weight in the child, confirming a study of Mexican schoolchildren
aged 5 to 10 years, where the highest maternal education level was associated with overweight/ obese children28, and opposing Bernardo et al. 26, who did not find such association.
Table 5. Logistic regression of the factors associated with excess weight in preschoolers aged 24 to 59 months. Olinda (PE), Brazil, 2014.
Maternal education (years)
≥8 <8
Maternal nutritional status Excess weight
Normal weight/underweight Family per capita income
≥P25 <P25
Exclusive breastfeeding duration <4 months
≥4 months
Weight gain in the first three months of life
≥0.67 Z-score <0.67 Z-score Level of physical activity Little active
Active
Sedentary behavior Yes
No
Fruit intake No Yes
Non-starchy vegetable intake No
Yes
Superfluous food intake***
Yes No
Excess calorie intake Yes
No Variables
1.80
7.30
1.49
1.98
1.74
3.28
3.03
2.47
1.55
0.38
4.49
<0.030
<0.001
<0.030
<0.020
<0.040
<0.001
<0.001
<0.001
<0.200
<0.010
<0.001
1.82
7.74
1.90
2.12
3.40
2.62
2.36
2.86
1.45
0.08
3.04
0.99-3.33
3.57-16.77
0.91-3.98
1.01-4.46
1.46-7.96
0.94-7.32
1.09-5.11
1.35-6.06
0.57-3.66
0.03-0.31
1.52-6.07
<0.050
<0.001
<0.080
<0.050
<0.005
<0.070
<0.030
<0.006
<0.420
<0.001
<0.002
Excess weight in preschoolers
Crude OR P Adjusted OR 95%CI p
Note: *Model 2: Adjusted for the variables of Model 1, sex, and birth weight; **Model 3: Adjusted for the variables of Model 2; ***Superfluous
foods: Those whose composition presents excessive amounts of lipids and/or sugars, or that contain undesirable substances for this age group, such as dyes and chemical preservatives.
OR: Odds Ratio; 95%CI: 95% Confidence Interval.
Model 1
Model 2*
A higher education level should lead to better knowledge about healthy lifestyles, which would be a protective factor against overweight/ obesity. On the other hand, it may be associated with higher income and consequently, more access to food, including fast food, and a sedentary lifestyle, which are risk factors for excess body weight26.
Although physical activity is critical for children, the prevalence of inactive behaviors, characterized by physically inactive leisure activities, such as watching television and playing computer games, has been increasing in detriment of more vigorous physical activites29. Low physical activity and sedentary behavior has been associated with excess weight in the study preschoolers, corroborating Janz et al.30, who found that the lack of physical activity and excessive exposure to sedentary behavior seen in preschool children has been associated with negative health outcomes, such as excess weight, and later, cardiovascular diseases.
The objective of the study is complex and the empirical model was reductionist, which should be considered when assessing results. Other factors have been associated with obesity in the study age group, which have not been contemplated by the present study, such as skipping breakfast, number of hours sleeping, and parental smoking status.
Additionally, determining precisely the foods individuals or groups consume is a complex task. Each method used for assessing food intake has advantages and limitations. The 24-hour recall is a validated method, easy to use, requires little time, and has good reproducibility. It is the most appropriate method for estimating current intake and quantitative food intake analyses. However, as it estimates the food intake of only one day, it does not have the sensitivity to capture the variations that can happen from one day to another. To minimize this bias, the 24-hour recall was repeated in 40% of the sample after at least 15 days. Thus, the effect of intrapersonal variability was canceled, allowing the results to
more accurately reflect individual food intake. Future studies should use more than one instrument to assess food intake, which may contribute to a better identification of preschoolers’ food patterns.
C O N C L U S I O N
The results suggest that food intake has an important role in excess weight in preschool children, presenting itself differently in the study groups, with the excess weight group having a higher intake of excess calories and a lower intake of fruits. Other variables seem to be influential, such as maternal education level and nutritional status, as well as excess weight gain in the first three months of life and sedentary behavior.
These pieces of evidence show the importance of acquiring healthy food habits. Hence, the identification and knowledge of these food habits in preschool children is critical for promoting nutritional education during childhood.
C O N T R I B U T O R S
All authors contributed to study conception and design, data analysis, and final text of the manuscript.
R E F E R E N C E S
1. Schuch I, De Castro TG, De Vasconcelos FA, Dutra CL, Goldani MZ. Excess weight in preschoolers: Prevalence and associated factors. J Pediatr. 2013;89(2):179-88. https://doi.org/10.1016/j.jped. 2013.03.003
2. Bertotto ML, Valmórbida J, Broilo MC, Campagnolo PDB, Vitolo, MR. Associação do ganho de peso no primeiro ano de vida com excesso de peso e adi-posidade abdominal no idade pré-escolar. Rev Paul Pediatr. 2012;30(4):507-12. https://doi.org/10. 1590/s0103-05822012000400008
4. Caetano MC, Ortiz TTO, Silva SGL, Souza FIS, Sarni ROS. Complementary feeding: Inappropriate practices in infants. J Pediatr. 2010;86(3):196-201. https://doi.org/10.1590/S0021-7557201000 0300006
5. Henriques P, Sally EO, Burlandy L, Beiler RM. Regulamentação da propaganda de alimentos in-fantis como estratégia para a promoção da saúde. Ciênc Saúde Coletiva. 2012;17(2):481-90.https:// doi.org/10.1590/S1413-81232012000200021 6. Monteiro AC, Canon G. The Impacto of
Transnacional “Big Food” Companies on the South: A view from Brazil. PLoS Med. 2012;9(7):1-5. https:// doi.org/10.1371/journal.pmed.1001252
7. Lima AMC, Kumar S, Brown LP, Butts P, Finkler AS, Bakewell-Sachs S, et al. Does fetal grow restriction influence body composition at school age? J Pediatr. 2011;87(1):29-35. https://doi.org/10.1590/S0021-7 5572011000100006
8. Souza RLV, Madruga SW, Gigante DP, Santos IS, Barros AJD, Assunção MCF. Padrões alimentares e fatores associados entre crianças de um a seis anos de um município do Sul do Brasil. Cad Saúde Pú-blica. 2013;29(12):2416-26. https://doi.org/10. 1590/0102-311X00156412
9. World Health Organization. Multicentre Growth Reference Study Group. Child Growth Standards: Length/height-for-age, age, weight-for-length, weight-for-height and bodymass index-for-age: Methods and development. Geneva: WHO; 2006.
10. Burdette HL, Whitaker RC, Daniels SR. Parental report of outdoor playtime as a measure of physical activity in preschool-aged children. Arch Pediatr Adolesc Med. 2004;158(4):353-7. https://doi.org/ 10.1001/archpedi.158.4.353
11. Frisancho, AR. Anthropometric standards for the assessment of growth and nutritional status. Ann Arbor (MI): The University of Michigan Press; 1990. 12. Pinheiro AVB, Lacerda EMA, Haimbenzecry E, Gomes MCS, Costa VM. Tabela para avaliação de consumo alimentar em medidas caseiras. Rio de Janeiro: UFRJ; 1994.
13. Uenther PM, Kott OS, Carriquiry AL. Development of an approach for estimating usual nutrient intake distributions at the population level. J Nutr. 1997;127(6):1106-12.
14. Carriquiri A. Assessing the prevalence of nutrient inadequacy. Public Health Nutr. 1999;2(1):23-33. 15. Brasil. Ministério da Saúde. Alimentos regionais
bra-sileiros. Brasília: Ministério da Saúde; 2002. 16. Universidade Estadual de Campinas. Tabela
Bra-sileira de Composição de Alimentos – Taco. 4ª ed. Campinas: Unicamp; 2011.
17. Gluckman PD, Hanson MA, Beedle AS. Early life events and their consequences for later disease: A life history and evolutionary perspective. Am J Hum Biol. 2007;19(1):1-19. https://doi.org/10.1002/aj hb.20590
18. Rogers I, Euro-Blcs. Study Group. The influence of birth weight and intrauterineenvironment on adiposity and fat distribution in later life. Int J Obesity. 2003;27:755-77. https://doi.org/10.10 38/ sj.ijo.0802316
19. Cameron N, Pettifor J, We TD, Norris S. The relation of rapid weight gain in infancy to obesity and skeletal maturity in childhood. Obesity. 2003;11(3):457-60. https://doi.org/10.1038/oby. 2003.62
20. Ong KK, Emmett P, Northstone K, Golding J, Rogers I, Ness AR, et al. Infancy weightgain predicts childhood body fat and age at menarche ingirls. J Clin Endocrinol Metab. 2009;94(5):1527-32. https:// doi.org/10.1210/jc.2008-2489
21. Brasil. Ministério da Saúde. Pesquisa Nacional de Demografia e Saúde da Criança e da Mulher - PNDS 2006: dimensões do processo reprodutivo e da saúde da criança. Brasília: Ministério da Saúde; 2009 [acesso 2014 mar 28]. Disponível em: http:// bvsms.saude.gov.br/bvs/publicacoes/pnds_crianca_ mulher.Pdf
22. Toloni MHA, Longo-Silva G, Goulart RMM, Taddei JAA. Introdução de alimentos industrializados e de alimentos de uso tradicional na dieta de crianças de creches públicas no município de São Paulo. Rev Nutr. 2011;24(1):61-70. https://doi.org/10.1590/S 1415-52732011000100006
23. Bortolini GA, Gubert MB, Santos LPM. Consumo alimentar entre crianças brasileiras com idade de 6 a 59 meses. Cad Saúde Pública. 2012;28:1759-71. https://doi.org/10.1590/S0102-311X201200090 0014
24. Fidelis CMF, Osório MM. Consumo alimentar de macro e micronutrientes de crianças menores de cinco anos no Estado de Pernambuco, Brasil. Rev Bras Saúde Matern Infant. 2007;7(Supl.1):63-74. https://doi.org/10.1590/S1519-38292007000 100008
25. Jingxiong J, Rosenqvist U, Huishan W, Koletzko B, Guangli L, Jing H, et al. Relationship of parental characteristics and feeding practices to overweight in infants and young children in Beijing, China. Public Health Nutr. 2009;12(7):973-8. https://doi. org/10.1017/S1368980008003509
27. Fundação Getúlio Vargas. A nova classe média: o lado brilhante dos pobres. Rio de Janeiro: FGV; 2010 [acesso 2014 jun 29]. Disponível em: http:// www.cps.fgv.br
28. Alves MN, Muniz LC, Vieira MFA. Consumo ali-mentar entre crianças brasileiras de dois a cinco anos de idade: Pesquisa Nacional de Demografia e Saúde – 2006. Ciên Saúde Coletiva. 2013;18(11):3369-77. https://doi.org/10.1590/S 1413-81232013001100026
29. Moore LL, Gao D, Bradlee ML, Cupples LA, Sundarajan-Ramamurti A, Proctor MH, et al. Does
early physical activity predict body fatchange throughout childhood? Prev Med. 2003;37(1):10-7. https://doi.org/10.1016/S0091-7435(03)00048-3 30. Janz KF, Kwon S, Letuchy EM, Gilmore JME, Burns
TL, Torner JC, et al. Sustained effect of early physical activity onbody fat mass in older children. Am J Prev Med. 2009;37(1):35-40. https://doi.org/10. 1016/j.amepre.2009.03.012