Maria Cecília Formoso AssunçãoI
Iná S SantosII Aluísio J D BarrosII Denise Petrucci GiganteI Cesar Gomes VictoraII
I Departamento de Nutrição. Faculdade de Nutrição. Universidade Federal de Pelotas. Pelotas, RS, Brasil
II Programa de Pós-graduação em Epidemiologia. Faculdade de Medicina. Universidade Federal de Pelotas. Pelotas, RS, Brasil
Correspondence:
Maria Cecília Formoso Assunção
Programa de Pós-graduação em Epidemiologia Departamento de Medicina Social, Faculdade de Medicina
Universidade Federal de Pelotas Av. Duque de Caxias 250 Caixa Postal 464
96001-970, Pelotas, RS, Brasil
E-mail: [email protected] Received: 11/21/2006
Approved: 2/28/2007
Effect of iron fortifi cation of
fl our on anemia in preschool
children in Pelotas, Brazil
ABSTRACT
OBJECTIVE: Iron fortifi cation of fl our has been sanctioned by the Brazilian government since 2004. The objective of the study was to assess the impact of
fl our fortifi cation on hemoglobin level in children under six.
METHODS: A time-series study was carried out in Pelotas, Southern Brazil, consisting of three assessments at a 12-month interval. In May 2004, before
fl our fortifi cation, hemoglobin measurements were obtained in a probabilistic sample of 453 children. Twelve and 24 months later, samples of 923 and 863 children were studied, respectively.
RESULTS: The three groups studied were comparable in terms of demographic and socioeconomic characteristics. At baseline, mean hemoglobin was 11.3±2.8 g/dL. In the post-fortifi cation period, means were 11.2±2.8 (at 12 months) and 11.3±2.5 g/dL (at 24 months), with no statistically signifi cant difference among the three time periods studied (p=0.16).
CONCLUSIONS: Fortifi cation had no effect on hemoglobin levels of the children studied. This fi nding could be partially due to inadequate fl our intake and/or low bioavailability of dietary iron.
KEYWORDS: Food, fortifi ed. Flour, analysis. Iron, dietary. Anemia. Hemoglobins, biosynthesis. Child, Preschool. Intervention studies. Time series studies.
INTRODUCTION
Anemia is an indicator of nutritional defi ciency.* In developing countries, low intake of high-bioavailability iron is a major factor in the development of anemia and population-based interventions are required to remedy this condition.Iron for-tifi cation of widely consumed food products (mass or universal fortifi cation) has been the strategy to better people’s nutritional status in developing countries.20
Population-based studies in several Brazilian regions showed high anemia prevalences above 30%.1,2,9,11,12,15-17 Hence, since July 2004, the Brazilian
Ministry of Health has established that all wheat and corn fl ours produced should be iron fortifi ed. A special administrative act** specifi ed the dietary iron compounds to be used: dehydrated iron sulphate, iron fumarate, reduced
*World Health Organization. Focusing on anemia. Geneva; 2004. Available at: http://www.paho. org/English/AD/FCH/NU/WHO04_Anemia.pdf [Access on 2/8/2006]
iron, and electrolytic iron; 325-mesh Tyler, iron and sodium ethylenediaminetetracetic acid (EDTA), and chelated iron bysglicin, as well as their amounts (4.2 mg iron/100 g fl our).
Some studies showed the effi cacy of fortifi cation in increasing serum iron but the effectiveness of mass fortifi cation programs has hardly ever been evaluated.20
The purpose of the present study was to assess the ef-fect of iron fortifi cation of fl our on hemoglobin levels in preschool children.
METHODS
A time-series study was conducted consisting of three as-sessments at a 12-month interval. Three cross-sectional surveys were carried out in the city of Pelotas, Southern Brazil. Hemoglobin levels were investigated in a group of children aged zero to fi ve (baseline study) between May and July 2004, prior to compulsory iron fortifi ca-tion of fl our.2 Then, 12 and 24 months post-fortifi cation
implementation (2005 and 2006), hemoglobin levels were once more investigated in other groups of children of similar age and socioeconomic condition compared to the fi rst group assessed. Not always the same group of children was study as, due to ethical issues, diagnosed cases of anemia were referred to treatment.
The sample size was estimated to detect a 0.5 g/dL difference in mean hemoglobin between pre- and post-intervention assessments. There were required 600 chil-dren aged zero to 71 months for each phase of the study, given a 95% confi dence level (two-sided), 90% power and standard deviation of 1.7 g/dL hemoglobin.11
At baseline,2 a sample by clusters was selected in two
steps and primary sampling units were drawn from cen-sus tracts defi ned by the Instituto Brasileiro de Geografi a and Estatística (IBGE – Brazilian Institute of Geography and Statistics) for 2000 Demographic Census. Despite the fact that the original estimate of the sample size did not include the correction for the design effect,19
the remaining samples studied were estimated after correcting the fi rst sample size for the design effects identifi ed at baseline (1.6 and 3.3 for children aged zero to 24 months and 25 to 71 months, respectively) as a way of assuring statistical power for comparisons. There were estimated 900 children required to the later steps of the study. Applying the same sampling criteria of the fi rst phase, in order to identify 30 children per census tract, 40 tracts were required to be visited in the second and third phases. Seeing that tracts were arranged in an ascending order by income, there were selected tracts right before and after those studied in
each earlier phase so that new tracts would have mean income similar to those previously studied.
At the three time points, the mothers of children were interviewed at home by previously trained nutrition-ists. The following data was collected on the children and their families: demographic (sex, age in months, skin color, birth weight, current weight and height); socioeconomic characteristics (current family income in reals, maternal and paternal schooling in full years, sanitation conditions and number of residents in the household); prior history of anemia (anemia diagnosed by a physician in the last year and drug therapy); mor-bidity in the last 15 days (diarrhea, cough, and fever); current dietary patterns (weekly intake of iron-fortifi ed food); pattern of fl our intake (low, intermediate, and high – constructed from tertiles of scores based on weekly intake of food made with fl our such as breads, cookies, pastas, cakes and polentas: zero score for rarely/never, 2.5 for 2 to 3 days a week, 5 for 4 to 6 days a week and 7 for daily intake); breastfeeding; and intake of macro and micronutrients assessed using a 24-hour food recall (except on the day following Sundays and holidays) and analyzed through Virtual Nutri 1.0.* The amount of iron added to fl our products was not included in the analysis.
Weight measures of children were obtained using digital electronic scales (Seca) with 150-kg capacity and 100-g precision (Unicef, Copenhagen). Children under two were weighed on their mothers’ lap. Length measure-ments of children aged up to two years were obtained using anthropometers (Sanny), belt model, with 20 to 105-cm scale and 0.5-cm precision, with children lying down according to the standard procedure. Height of older children was obtained using an Alturaexata stadi-ometer with 35 to 213-cm scale and 0.1-cm precision, with children in the standing position.
Hemoglobin measurement in the peripheral blood was obtained through fi nger prick by nursing aids and readings were made in a portable hemoglobinometer (HemoCue AB, Sweden), which was calibrated daily as per the manufacturer’s specifi cations. Hemoglobin con-centration was expressed in g/dL and those children with hemoglobin below 11 g/dL were classifi ed as anemic.22
Nutritional status was assessed using the National Cen-ter for Health Statistics6 criteria for the comparison of
anthropometric ratios obtained based on length/height and weight measures and age. New growth curves, published by the World Health Organization in 2006, were also used for assessing children aged from zero to 60 months.**
* Philipp ST, Szarfarc SC, Latterza AR. Virtual Nutri [programa de computador]. Versão 1.0 for Windows. São Paulo: Departamento de Nutrição da Faculdade de Saúde Pública da USP; 1996.
Children were classifi ed with growth defi cit when their height/age Z score was below -2 standard deviations and with overweight when their weight/height ratio was greater than 2 standard deviations as proposed by the World Health Organization.21
Since food manufacturing companies may have started either earlier or later fortifying fl our products, fl our samples were collected at baseline to confi rm that fl our products consumed have not yet been fortifi ed and at the post-fortifi cation period to confi rm that the same
fl our products have already been fortifi ed. For that, in the fi rst two time points (baseline and 12 months), wheat fl our samples were collected in 10% of the house-holds visited and systematically selected, and tested for iron concentration in the Laboratório de Química dos Alimentos (Laboratory of Food Chemistry, LQA) of Universidade Federal de Pelotas. At the same time, an inventory list of all labeled fortifi ed fl our products and pastas available in wholesale and retail stores in the city of Pelotas was made to check whether fortifi ed products have been supplied. Samples of commercially
available fl our products were tested in the LQA and in the Instituto Adolfo Lutz in São Paulo as well for result validation.
Data were double entered using EpiInfo 6.04 and then its consistency was ascertained. All data analyses considered the sample design and were adjusted for standard errors of potential intra-cluster correlation using the svy commands of Stata 9.0.
First baseline and post-fortifi cation groups were com-pared in terms of the distribution of potential confound-er variables followed by a comparison of hemoglobin means between these groups. Then stratifi ed analyses were conducted to detect any effect change by factors that could affect the impact of fortifi cation.
To ascertain repeatability of data collected, 10% of in-terviews in each census tract were repeated by the fi eld work supervisor using an abbreviated questionnaire. Interviewers did not know which households would be revisited. Kappa coeffi cients for the variables studied
Figure. Descriptive fl ow chart of the number of children aged zero to fi ve years identifi ed in each step of the study and the number of losses and refusals: at baseline, and 12 and 24 months post-fortifi cation. Pelotas, Southern Brazil, 2004-2006.
Baseline 20 census tracts 534 children identified
24 months 40 census tracts 934 children identified 12 months
40 census tracts 1,052 children identified
27 losses or refusals (5.1%)
41 losses or refusals (4.4%) 92 losses or refusals
(8.7%)
507 children interviewed 960 children interviewed 893 children interviewed
54 refusals of testing (10.7%)
30 refusals of testing (0.4%) 37 refusals of testing
(3.9%)
453 children with hemoglobin
measurements
863 children with hemoglobin
measurements 923 children
RESULTS
Figure describes the number of children identifi ed in the three steps as well as refusals to participate in the interview and hemoglobin measurement. Losses ranged between 8% and 15% and information and hemoglobin measurement were obtained for 2,239 children. Refus-als were directly associated to higher parental schooling and family income and females as well.
Tables 1 to 3 show the distribution demographic, so-cioeconomic, and nutritional characteristics, morbidity, (skin color, maternal and paternal schooling) were all
higher than 0.82 in the three steps of the study. The study was approved by the Research Ethics Com-mittee of the School of Medicine of Universidade Federal de Pelotas. The mother’s or guardian’s written consent was obtained before data and blood collection. The study did not imply in any risks to the children’s health. Parents or guardians of those diagnosed with anemia were warned and their children were referred to health care services for treatment.
Table 1. Demographic and socioeconomic characteristics of the children studied. Pelotas, Southern Brazil, 2004–2006.
Characteristic Baseline (N=507) %
Post-fortifi cation
p-value* 12 months
(N=960) % (N=893) %24 months
Gender 0.31
Male 52.7 50.2 54.0
Female 47.5 49.8 46.0
Skin color 0.08
White 74.5 68.8 77.6
Non-white 25.5 31.2 22.4
Age (months) 0.51
0–11 16.2 16.6 15.2
12–23 12.6 16.5 15.9
24–35 16.4 16.4 17.9
36–47 17.0 15.0 16.4
48–59 18.1 17.5 15.8
60–71 19.7 18.0 18.8
Maternal schooling 0.04
No schooling 6.3 2.4 1.2
Up to 4 years 22.0 20.3 15.9
5 – 8 years 38.4 43.1 40.4
9 years or more 33.3 34.2 42.5
Father’s or partner’s schooling 0.41
No schooling 3.5 3.0 2.3
Up to 4 years 22.3 17.0 15.2
5–8 years 45.1 51.0 47.4
9 years or more 29.1 29.0 35.1
Family income (minimum wages) 0.87
Less than 1 17.8 19.7 16.5
1 – 2.99 51.4 53.9 54.9
3 – 5.99 19.9 18.2 20.3
6 or more 10.9 8.2 8.3
Total residents in the household 0.70
2 – 4 46.7 49.1 52.0
5 – 7 44.6 42.3 40.3
8 – 14 8.7 8.6 7.7
and dietary patterns in the groups of children included in each phase of the study.
The study groups did not show differences in the distri-bution by sex, skin color, age, family income, father’s or partner’s schooling and total residents in the household. As for maternal schooling, mothers of the children stud-ied in the third step (at 24 months) were more educated. Height/age defi cit was more often seen in children stud-ied at 12 months post-fortifi cation. The occurrence of “fever in the last 15 days” was more frequently observed
in the group studied at 24 months post-fortifi cation (p<0.001). In regard to dietary patterns, weekly intake of red meat and beans was different among the groups and more common among children studied post-intervention (p=0.03 and p=0.02 at 12 and 24 months, respectively). On the other hand, weekly intake of pasta and cookies was more frequent among children studied at 24 months post-fortifi cation (p=0.04 and p=0.02 respectively). Mean iron intake was similar among children studied at the three time points: 8.42 ± 5.08 mg; 8.82 ± 7.59 mg and 8.84 ± 5.40 mg, respectively (p=0.14).
Table 2. Nutritional characteristics and morbidity of the children studied. Pelotas, Southern Brazil, 2004–2006.
Characteristic Baseline (N=507) %
Post-fortifi cation
p-value* 12 months
(N=960) % (N=893) %24 months
Low birth weight 10.8 8.3 8.8 0.40
Current nutritional status (NCHS)**
Height/age < -2 SD 5.5 9.2 5.0 0.01
Weight/height > 2 SD 12.0 13.6 11.2 0.29
Current nutritional status (OMS)***
Height/age < -2 SD 8.3 13.0 7.1 < 0.001
Weight/height > 2 SD 11.4 14.9 12.4 0.17
Prior diagnosis of anemia 40.0 42.5 36.2 0.07
Drug therapy for anemia in the last year 29.8 28.2 24.0 0.15
Diarrhea in the last 15 days 11.0 8.0 9.4 0.26
Cough in the last 15 days 57.0 47.4 51.1 0.07
Fever in the last 15 days 19.5 18.6 29.7 < 0.001
* Pearson’s Chi-square
** National Center of Health Statistics, 1985
*** WHO, 2006 / children aged zero to 60 months only.
Table 3. Dietary patterns of the children studied. Pelotas, Southern Brazil, 2004–2006.
Characteristic Baseline (N=507) %
Post-fortifi cation
p-value* 12 months
(N=960) % (N=893) %24 months
Still breastfed 15.3 18.5 19.0 0.17
Weekly intake of food items:
Red meat 80.1 83.7 87.8 0.03
Liver 22.4 24.4 20.2 0.37
Yolk 63.8 64.6 66.5 0.70
Bean 94.5 97.7 95.7 0.02
Bread 92.8 93.1 93.4 0.79
Pasta 89.5 86.0 90.1 0.04
Cookie 82.9 85.8 92.1 0.02
Pattern of fl our intake: 0.12
Low 39.2 42.1 37.1
-Intermediate 28.6 33.0 33.6
-High 32.2 24.9 29.3
The evaluation of labels of fl our products available in major wholesale and retail stores of the city showed that, of 34 brands available at baseline, three had nutri-tional information on iron fortifi cation in the beginning of this period and 12 at the end of it. Corn fl our and pasta products did not show any information on iron fortifi cation on their labels. In the second and third steps of the study, all brands of fl our and pasta products had this information on their labels.
The analysis of iron content in wheat fl our samples collected in the households evidenced that, at baseline,2
none had iron concentrations consistent with fortifi ca-tion, not even those products labeled fortifi ed. However,
the analysis of samples in the second phase of the study showed that about half of them had iron content equal to or higher than 4.2 mg/100 g fl our.
The confi rmatory analysis of iron content tested in samples of 23 different brands of fl our products avail-able at 12 months collection, carried out in the Instituto Adolfo Lutz, São Paulo, verifi ed that fi ve of them did not have iron content consistent with fortifi cation. Mean hemoglobin measurements were similar in the three steps of the study: 11.3 ± 2.8 g/dL, 11.2±2.8 g/dL, and 11.3 ± 2.5 g/dL at baseline, 12 months, and 24 months post-fortifi cation, respectively (p=0.16).
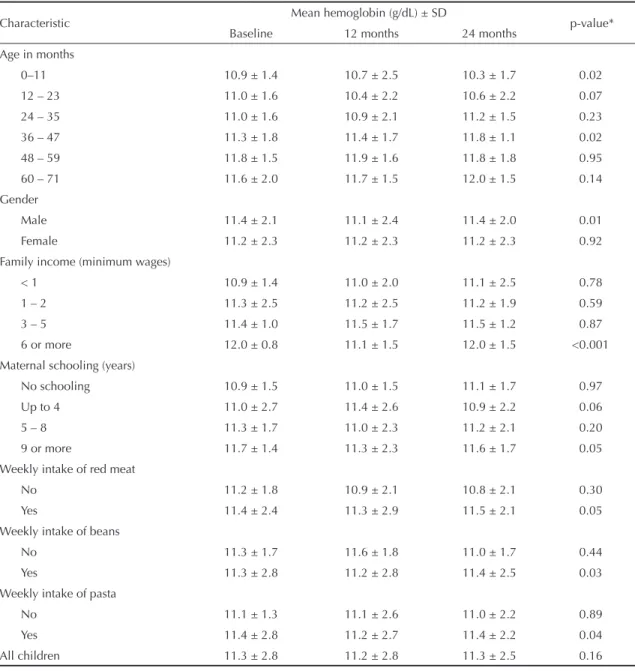
Table 4. Mean hemoglobin at the three steps of the study according to demographic and socioeconomic characteristics and dietary patterns. Pelotas, Southern Brazil, 2004–2006.
Characteristic Mean hemoglobin (g/dL) ± SD p-value*
Baseline 12 months 24 months
Age in months
0–11 10.9 ± 1.4 10.7 ± 2.5 10.3 ± 1.7 0.02
12 – 23 11.0 ± 1.6 10.4 ± 2.2 10.6 ± 2.2 0.07
24 – 35 11.0 ± 1.6 10.9 ± 2.1 11.2 ± 1.5 0.23
36 – 47 11.3 ± 1.8 11.4 ± 1.7 11.8 ± 1.1 0.02
48 – 59 11.8 ± 1.5 11.9 ± 1.6 11.8 ± 1.8 0.95
60 – 71 11.6 ± 2.0 11.7 ± 1.5 12.0 ± 1.5 0.14
Gender
Male 11.4 ± 2.1 11.1 ± 2.4 11.4 ± 2.0 0.01
Female 11.2 ± 2.3 11.2 ± 2.3 11.2 ± 2.3 0.92
Family income (minimum wages)
< 1 10.9 ± 1.4 11.0 ± 2.0 11.1 ± 2.5 0.78
1 – 2 11.3 ± 2.5 11.2 ± 2.5 11.2 ± 1.9 0.59
3 – 5 11.4 ± 1.0 11.5 ± 1.7 11.5 ± 1.2 0.87
6 or more 12.0 ± 0.8 11.1 ± 1.5 12.0 ± 1.5 <0.001
Maternal schooling (years)
No schooling 10.9 ± 1.5 11.0 ± 1.5 11.1 ± 1.7 0.97
Up to 4 11.0 ± 2.7 11.4 ± 2.6 10.9 ± 2.2 0.06
5 – 8 11.3 ± 1.7 11.0 ± 2.3 11.2 ± 2.1 0.20
9 or more 11.7 ± 1.4 11.3 ± 2.3 11.6 ± 1.7 0.05
Weekly intake of red meat
No 11.2 ± 1.8 10.9 ± 2.1 10.8 ± 2.1 0.30
Yes 11.4 ± 2.4 11.3 ± 2.9 11.5 ± 2.1 0.05
Weekly intake of beans
No 11.3 ± 1.7 11.6 ± 1.8 11.0 ± 1.7 0.44
Yes 11.3 ± 2.8 11.2 ± 2.8 11.4 ± 2.5 0.03
Weekly intake of pasta
No 11.1 ± 1.3 11.1 ± 2.6 11.0 ± 2.2 0.89
Yes 11.4 ± 2.8 11.2 ± 2.7 11.4 ± 2.2 0.04
All children 11.3 ± 2.8 11.2 ± 2.8 11.3 ± 2.5 0.16
Anemia prevalences were 30.2%, 41.5%, and 37.1% in the three steps of the study, respectively (p=0.02). Hemoglobin measurements were consistent with se-vere anemia (hemoglobin <7 g/dL)22 in less than 1%
of children studied.
There was no evidence of a clear impact of fortifi cation on specifi c subgroups; some showed reduced mean hemoglobin while others had increased levels. Even though there were tested all the variables in the study, Table 4 shows only the analyses for those subgroups showing any changes. Children aged between zero and 11 months, males, belonging to families with higher income and born to mothers with higher schooling had a statistically signifi cant reduction in mean hemoglobin levels in the second and third phases of the study, i.e., post-fortifi cation. Similarly, those who consumed red meat and pasta at least one a week showed signifi cantly reduced mean hemoglobin. On the other hand, children aged between 36 and 47 months, as well as those who had beans at least once a week, showed higher mean hemoglobin at 24 months post-fortifi cation.
DISCUSSION
Positive experiences with iron-fortifi ed fl ours have been described in European countries such as Sweden, Denmark, and Finland.18
Together with other interventions to reduce anemia, since 2001, African and Central Asiatic countries have implemented iron fortifi cation of widely consumed food products such as wheat fl our. At the same time, there have been developed studies for the assessment of the effi cacy and effectiveness of such interventions.* A Sri Lanka study assessed the effectiveness of iron-fortifi ed
fl our products before the implementation of fortifi ca-tion naca-tionwide but no effect was evidenced on anemia among preschool children in areas where fortifi ed food products were available.
Positive experiences have been reported in the Americas. In the US, food and milk infant formulas fortifi ed with micronutrients can be accounted for reduced prevalence of anemia in children in the years between 1975 and 1984.18 Venezuela’s experience of 50% reduction of
ane-mia prevalence among preschool children a year post-fortifi cation of pre-cooked corn fl our is the strongest evidence that high intake of fortifi ed products directly benefi ts people.8 In Chile, low prevalence of anemia
among children under fi ve has been attributed to iron fortifi cation of wheat fl our since 1950s, although there have not been new representative studies nationwide since 1975 to ascertain whether this effect remains.10
There are no studies in Brazil evaluating mass
forti-fi cation of food products. The present study did not
fi nd any statistically signifi cant difference in mean hemoglobin in children tested pre- and post-fortifi cation of fl our products. The analysis of subgroups did not show any evidences of a consistent impact on specifi c populations.
Given that it was an analysis of effectiveness where an intervention was tested under actual conditions, the study fi ndings have to be interpreted based on certain considerations.5 First it should be established
whether the intervention has been actually provided to the population, in other words, whether fl our products were actually fortifi ed.
Instituto Adolfo Lutz analysis of iron content found in
fl our products available at 12 months post-fortifi cation revealed that, of 23 brands tested, fi ve did not have iron levels consistent with fortifi cation.
Assuming that the intervention has been provided, the next step will be to ascertain whether these products have been effectively taken by the target population. As Mora13 pointed out, low intake of fortifi ed food can be
accounted for lack of effect of fortifi cation in children under six due to inadequate iron intake.
In the three steps of the present study, there was a similar pattern of fl our intake in general. Although it does not as-sure that children in the study have been taking adequate amounts of food made with fl our, which can increase iron supply to the body, it indicates that food intake cannot be considered a confounder in the analysis. A Sri Lanka study showed that mean daily intake of 120 g of food made with wheat fl our fortifi ed with 6.6 mg iron per 100 g was not effective in increasing mean hemoglobin after 12- and 24-month follow-up.14 In the
present study, in addition to a 90 g mean intake of food made with fl our in the population studied, iron added to
fl our products was lower (4.2 g/100 g). This can explain the lack of intervention effect but further studies are needed to accurately determine intake.
The lack of evidence of mass fortifi cation interven-tions as effective strategies to reduce iron defi ciency makes it difficult for policymakers to support the developing countries government’s expenditure with such programs.3 In addition to low intake of fortifi ed
food, poor documentation of iron levels using specifi c indicators, low bioavailability of iron used in fortifi ed products, inadequate dietary practices resulting in low iron absorption; and failure to identify other causes of anemia3 are some reasons for this lack of evidence.
In the present study, hemoglobin measurement was used to determine anemia cases. Isolated hemoglobin mea-surements show low sensitivity and specifi city to
nose iron defi ciency anemia.4 Other measures could be
added such as transferrin saturation and serum ferritin. However, in fi eld studies, these measures might imply in greater losses since mothers would have to take their children to laboratories for blood collection, which can affect the internal validity of the study. Or either, blood would have to be collected at home increasing costs. Moreover, the present study was an assessment of the effectiveness of a national program aiming at reducing the prevalence of anemia and thus it was reasonable to restrict the outcome to hemoglobin measures. As for bioavailability, iron is the most diffi cult mineral to add to food products. High bioavailability com-pounds are those able to produce greater organoleptic changes. Another obstacle for iron use is posed by other dietary compounds that inhibit iron absorption. Phytic acid is found in cereal and vegetable grains and it is a major inhibitor of iron absorption.7 In the present study,
dietary data from the 24-hour food recall did not allow estimating the average consumption of phytates in the population studied.
Finally, anemia is unlikely to be caused by factors other than iron defi ciency. In the study area, parasite infections and malaria are not considered causes of anemia. On the other hand, viral and bacterial infections, more often seen during winter time, are associated to iron depletion.22 But
as the three steps of the study were conducted at the same time of the year, the seasonality effect was controlled for. Although fever was more frequently reported by moth-ers in the third step of the study, when the analysis was stratifi ed by this variable, mean hemoglobin was found to be similar at the three time points studied.
As a conclusion, iron fortifi cation of fl our products was not effective in increasing mean hemoglobin in children aged zero to 71 months after one and two years of intake. This can be partially explained by inadequate intake of fl our, low bioavailability of iron added to food or even regular consumption of food rich in iron absorption inhibitors.
1. Assis AMO, Barreto ML, Santos LMP, Sampaio LR, Magalhães LP, Prado MS, et al. Condições de vida, saúde e nutrição na infância em Salvador. Salvador: Bureal;2000.
2. Assunção MCF, Santos IS, Barros AJD, Gigante DP,
Victora CG.Anemia em menores de seis anos: estudo
de base populacional em Pelotas, RS. Rev Saude
Publica. 2007;41(3): 328-35.
3. Baltussen R, Knai C, Sharan M. Iron fortifi cation and iron supplementation are cost-effective interventions to reduce iron defi ciency in four sub regions of the world.
J Nutr. 2004;134(10):2678-84.
4. Cook JD. Diagnosis and management of
iron-defi ciency anaemia. Best Pract Res Clin Haematol.
2005;18(2):319-32.
5. Habicht JP, Victora CG, Vaughn JP. Evaluation designs for adequacy, plausibility and probability of public
health programme performance and impact. Int J
Epidemiol. 1999;28(1):10-8.
6. Hamill PV, Drizd TA, Johnson CL, Reed RB, Roche AF. National Center for Health Statistics Growth Curves for
Children birth-18 years. United States. Vital Health Stat
11. 1977;(165):i-iv, 1-74.
7. Hurrell RF. Fortifi cation: overcoming technical and
practical barriers. J Nutr. 2002;132(4 supl):806S-12S.
8. Layrisse M, Chaves JF, Mendez-Castellano H, Bosch V, Tropper E, Bastardo B, et al. Early response to the effect
of iron fortifi cation in the Venezuelan population. Am J
Clin Nutr. 1996;64(6):903-7.
9. Lima ACVMS, Lira PIC, Romani SAM, Eickmann SH, Piscoya MD, Lima MC. Fatores determinantes dos níveis de hemoglobina em crianças aos 12 meses de
vida na Zona da Mata Meridional de Pernambuco. Rev
Bras Saude Mater Infant. 2004;4(1):35-43.
10. Manuel Olivares G, Tomás Walter K. Consecuencias
de la defi ciencia de hierro. Rev Chil Nutr. [periódico
na internet].2003;30(3):226-33. Disponível em: http://www.scielo.cl/scielo.php?script=sci_ arttext&pid=S0717-75182003000300002&lng=es&nr m=iso&tlng=es
11. Monteiro CA, Szarfarc SC. Estudos das condições de saúde das crianças no município de São Paulo,
SP (Brasil), 1984-1985. Rev Saude Publica. 1987;
21(4):255-60.
12. Monteiro CA, Szarfarc SS, Mondini L. Tendência
secular da anemia na infância na cidade de São Paulo.
Rev Saude Publica. 2000;34(6):62-72.
13. Mora JO. Iron supplementation: Overcoming technical
and practical barriers. J Nutr. 2002;132(4
Supl):853S-5S.
14. Nestel P, Nalubola R, Sivakaneshan R, Wickramasinghe AR, Atukorala S, Wickramannayake T, et al. The use of iron-fortifi ed wheat fl our to reduce anemia among
the state population in Sri Lanka. Int J Vitam Nutr Res.
2004; 74(1):35-51.
15. Neuman NA, Tanaka OY, Szarfarc SC, Guimarães PRV, Victora CG. Prevalência e fatores de risco para anemia
no Sul do Brasil. Rev Saude Publica. 2000;34(1):56-63.
16. Oliveira RS, Diniz AS, Benigna MJC, Miranda-Silva SM, Lola MM, Gonçalves MC, et al. Magnitude, distribuição espacial e tendência da anemia em
pré-escolares da Paraíba. Rev Saude Publica.
2002;36(1):26-32.
17. Osório MM, Lira PIC, Batista-Filho M, Ashworth A. Prevalence of anemia in children 6-59 months old
in the state of Pernambuco, Brazil. Rev Panam Salud
Publica.2001;10(2):101-7.
18. Ramakrishnan U, Yip R. Experiences and Challenges in Industrialized Countries: Control of Iron Defi ciency
in Industrialized Countries. J Nutr. 2002; 132 (4
Supl):820S-4S.
19. Silva NN. Amostragem por conglomerados. In: Silva NN. Amostragem probabilística. São Paulo: Editora da Universidade de São Paulo; 2004. p. 75-91.
20. Trowbridge F, Martorell R. Forging Effective. Summary
and Recommendations. J Nutr. 2002;132(4
Supl):875S-9S.
21. World Health Organization. Physical Status: the use and interpretation of anthropometry. Report of a WHO Expert Committee. Geneva; 1995. [WHO - Technical Report Series, 854].
22. World Health Organization. Iron Defi ciency Anaemia. Assessment, Prevention, and Control. A guide for programme managers. Geneva; 2001.
REFERENCES