Betzabeth Slater
Dirce Maria Lobo Marchioni Silvia Maria Voci
Departamento de Nutrição. Faculdade de Saúde Pública. Universidade de São Paulo. São Paulo, SP, Brasil
Correspondence: Betzabeth Slater
Departamento de Nutrição - 2º andar Av. Dr. Arnaldo, 715 Cerqueira César 01246-904 São Paulo, SP, Brasil E-mail: [email protected] Received: 20/4/2006 Reviewed: 18/10/2006 Approved: 23/11/2006
Use of linear regression for
correction of dietary data
ABSTRACT
OBJECTIVE: Methodological approaches have been developed to minimize effects of measurement error in dietary intake data. The objective of the study was to apply a strategy to correct intake data according to measurement error.
METHODS: Intake data were obtained by applying the Food Frequency Questionnaire in 79 adolescents of São Paulo city, Brazil. Correction of dietary intake data was performed by linear regression, after energy adjustment by the residual method. The reference method used was 24-hour dietary recall and it was applied three times.
RESULTS: Corrected values were similar to reference values. Correction factor λ was 0.89 to energy. For macronutrients, factors were 0.41, carbohydrate 0.22, and lipid and protein 0.20.
CONCLUSIONS: Mean and standard deviation of corrected values show a correction for the measurement error. The performance of these methods, that are imperfect, is questioned when the assumptions are not proved which is common in intake studies of measures based on the reports of individuals.
KEYWORDS: Food intake. Adolescent. Bias (Epidemiology).
Questionnaires. Measurements, methods and theories. Food Frequency Questionnaire.
INTRODUCTION
The greatest limitation of epidemiological studies assessing association between diet and diseases has been the diffi culty to measure precisely and accurately regular dietary intake of individuals. This limitation made the number of studies to assess the performance of instruments to collect dietary information increase, especially the Food Frequency Questionnaire (FFQ).3
Although it has become the most frequently used tool in studies about nutritional epidemiology, FFQ also presents limitations regarding memory and perception8
lack of standardization of the tool and training of the interviewers, problems in the structure of the tool, and also biases.12,18
Over a decade ago, Beaton3 stated that “dietary intake cannot be estimated
without error and probably never will be”. Considering this statement, error can be understood as a statistical concept, and not as an error in data collec-tion. Indeed it is acknowledge that measuring individuals’ usual food intake is subjected to systematic and random errors. Systematic error or bias occurs on mean for all individuals measured. Random error occurs, especially, due to day to day fl uctuations and varies among individuals, with zero mean, providing less accurate measures.2
this area shows that measures of association observed in food intake demonstrated in epidemiological studies are relatively low, generally below 2.0. Thus, correla-tions may not be observed due to lack of accuracy and precision of the diet measure.18
Thus, methodological strategies have been developed in an attempt to estimate parameters correctly, such as in validation studies and, more recently, in calibration studies.
Calibration can be defi ned as the process of determining the correlation between two measure scales. This statis-tical methodology aims at making measures obtained at FFQ closer to real intake values, estimated by reference methods supposedly free from biases (systematic er-rors), and it is not necessarily applied more than once.13
Thus, corrected values are obtained, partially free from the errors present in FFQ.
The main objective of calibration studies is to use the information obtained to adjust the measures of associa-tion that will be estimated in the main epidemiological study, by error correction associated with the use of FFQ.4,14,18 This approach is performed a priori, from the
parametric or non-parametric regression model.10,13,14
Among the parametric methods, calibration using linear regression model14 is considered as the standard:17 and
intake estimate obtained by the reference method is modeled as a function of the FFQ intake. Linear regres-sion model obtained in the calibration study may be used as a predictor model to estimate real intake, from a FFQ value. In this approach, both systematic and random er-rors are incorporated in the intake measure obtained at FFQ14 When used afterwards in the analysis of
correla-tion between disease and food intake in the main study, calibrated values may eliminate or reduce signifi cantly, errors that could affect risk estimates.10,17
Thus, the objective of the present study was to describe the application of a strategy to calibrate diet information by measure error.
METHODS
Database of the study of FFQ validation carried out in 1999 by Slater et al,16 with 79 adolescents studying in a
public school in São Paulo whose ages ranged from 14 to 18 years old was used. Details on the methodology are given elsewhere.16
For this study, we used data on energy and macronutri-ents intake of all individuals who completed at least three 24-hour dietary recalls (24-hour recall) and one Food Frequency Questionnaire for Adolescents (FFQA). Food intake recorded by 24-hour recall and FFQA was transformed into energy and nutrients, using Virtual
Nutri software, altered regarding nutritional values of the food and the inclusion of tested recipes.6
Data on the energy intake of individuals which were between 500Kcal and 6000Kcal were included in the study, according to what was recommended by Andrade et al.1
Initially, mean-standard deviation was calculated for the total of energy and macronutrients of the diet according to 24-hour recall and FFQ. Normality distribution was tested by applying Kolmogorov-Smirnov’s test. Then, estimates were adjusted according to energy using residual method,18 aiming at estimating the fraction
of these nutrients that was not correlated with total energy intake.
For the correction of a nutrient data, we must consider that xiis the true usual intake of i individual, and thatzij is the intake estimated from the jth 24- hour recall (j= 1,
2, 3). Considering that is the average of the three 24- hour recall of nutrient values. To obtain the calibrated values of FFQA, the average of 24-hour recall values ( ) is regressed in values of FFQA, using the classic error model as a basis:
X = Z + εZ (1)
X is the true value, Z intake obtained by 24-hour recall, and E(εz) = 0. Therefore, E (X) = E(Z).
Assuming a linear correlation between the values ob-tained in FFQA and 24-hour recall values, we have used the method of linear calibration regression recommend-ed by Rosner et al14 to predict true energy and nutrient
intake value xi, as of nutrient value from FFQA, Qi.
X = E(Z/Q) = α + λQi
Estimates of α and λ were obtained from the regression of zi in Qi.
In this situation, slope of the estimated regression line represented by λ, is the key information for correct-ing the error of the correlation between fi nite and the estimate of nutrient intake in the context of an epide-miologic study.
Supposing X, Q and εQ normality, which is the linear model defi ned in the equation (1), variance of the pre-dicted values, Var(X), is estimated as the variance of calibrated measures from the questionnaire, according to Kaaks et al.10
Var(X) = Var (E[Z/Q]) = λ2Var(Q)
RESULTS
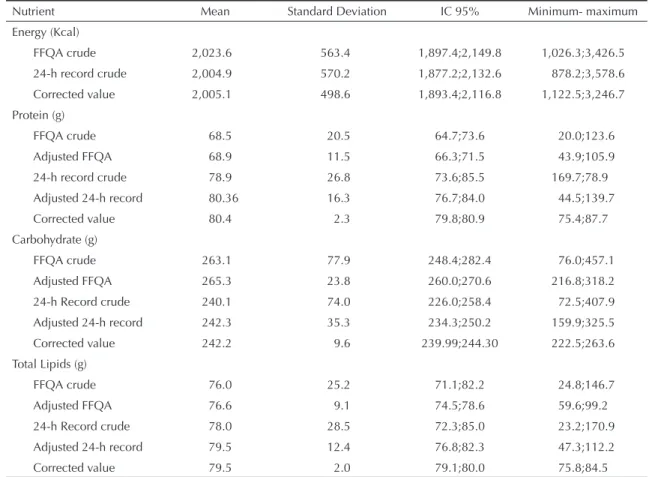
Correlation between dietary data obtained by the two instruments is showed in the Figure represented by scatter plot charts for energy and macronutrients. Results of the application of calibration method for data correction on energy and macronutrient intake are presented in Table 1. The two fi rst lines for energy show the values of descriptive statistics of food intake, measured by FFQA and 24-hour recall, followed by the calibrated value. For the remaining nutrients, crude values and those adjusted by energy are presented fol-lowed by the calibrated values.
It is possible to observe that 24-hour recall values, FFQA values and calibrated values were close to energy, with small overestimation of the FFQA. Also for lipids, the values obtained were close between the methods, with values slightly more increased for estimate obtained by 24-hour recall. For proteins and carbohydrates slightly more increased values were recorded at the 24-hour recall and FFQA respectively. After calibration, average of QFAA became similar to that from 24-hour recall adjusted by energy, as desired (non-signifi cant differ-ences in the paired t test). However, this consistency is obtained at variation expenses. Variation in food intake of calibrated values decreases, as can be verifi ed by the standard-deviation of the calibrated measure compared to the original values.
Estimated values for α and λ variables of the linear regression model as well as standard-error, and the Pearson’s correlation coefficient, are presented in Table 2.
An increased value means that a specifi c nutrient intake may be measured by FFQA in a comparative fashion with 24-hour recall.
Table 1. Descriptive statistics of energy and macronutrient intake obtained at FFQA 24-hour Record of 79 individuals, before
and after adjustment through energy and correction. City of São Paulo, Southeastern Brazil, 1999.
Nutrient Mean Standard Deviation IC 95% Minimum- maximum
Energy (Kcal)
FFQA crude 2,023.6 563.4 1,897.4;2,149.8 1,026.3;3,426.5 24-h record crude 2,004.9 570.2 1,877.2;2,132.6 878.2;3,578.6
Corrected value 2,005.1 498.6 1,893.4;2,116.8 1,122.5;3,246.7
Protein (g)
FFQA crude 68.5 20.5 64.7;73.6 20.0;123.6
Adjusted FFQA 68.9 11.5 66.3;71.5 43.9;105.9
24-h record crude 78.9 26.8 73.6;85.5 169.7;78.9
Adjusted 24-h record 80.36 16.3 76.7;84.0 44.5;139.7
Corrected value 80.4 2.3 79.8;80.9 75.4;87.7
Carbohydrate (g)
FFQA crude 263.1 77.9 248.4;282.4 76.0;457.1
Adjusted FFQA 265.3 23.8 260.0;270.6 216.8;318.2
24-h Record crude 240.1 74.0 226.0;258.4 72.5;407.9 Adjusted 24-h record 242.3 35.3 234.3;250.2 159.9;325.5
Corrected value 242.2 9.6 239.99;244.30 222.5;263.6
Total Lipids (g)
FFQA crude 76.0 25.2 71.1;82.2 24.8;146.7
Adjusted FFQA 76.6 9.1 74.5;78.6 59.6;99.2
24-h Record crude 78.0 28.5 72.3;85.0 23.2;170.9
Adjusted 24-h record 79.5 12.4 76.8;82.3 47.3;112.2
Corrected value 79.5 2.0 79.1;80.0 75.8;84.5
FFQA: Food Frequency Questionnaire for Adolescents
Table 2. Estimates of α and λ parameters, standard-error and
Pearson’s correlation coeffi cient (r) of energy and macro-nutrients adjusted according to energy. City of São Paulo, Southeastern Brazil, 1999.
Nutrient α’ λ’ Standard-error r
Energy 214.20 0.89 0.06 0.87 Protein 66.64 0.20 0.16 0.14
Carbohydrates 134.71 0.41 0.16 0.27
In calibration using linear regression,14 the method
used in the present study, we want the intercept to be approximately zero and the slope, represented by λ, to be approximately 1. These characteristics indicate absence of biases in the questionnaire, that is, mean intake estimated by the questionnaire would be equal to the mean intake estimated by the reference method. Actually, the slope in the regression line is lower than 1. The regression coeffi cient was closer to that desired for energy (λ=0.89), indicating an excellent performance of the instrument. Similar studies in the literature report lower values, ranging from 0.09 to 0.45 according to gender and etnia.9,17 For carbohydrate, the coeffi cient
obtained was reasonable, comparable to the study of Stram et al,17 in Hawaii, which ranged from 0.41 to 0.54
in men, and 0.20 to 0.73 in women.
On the other hand, for lipids and proteins, a consider-The factor of calibration λ, that should be 1 ideally, was
0.89 for energy. For macronutrients, factors were 0.41, 0.22, and 0.20 for carbohydrates, lipids, and proteins respectively.
DISCUSSION
The present study is the fi rst published in Brazil pre-senting one of the strategies used to correct dietary data by error measure obtained at FFQ. It is important to highlight that studies approaching the calibration methodology are rare in the literature, and, despite the clear defi nition distinguishing the concepts of validation and calibration, it is still common to fi nd the incorrect interpretation or denomination of the procedures and statistical analysis in published articles, especially regarding calibration.
Figure. Scatterplot charts between 24-hour recall values and Food Frequency Questionnaires for Adolescents for energy and
macronutrients adjusted by energy. City of São Paulo, Southeastern Brazil, 1999. (N=79) Calories FFQA
3,000 2,000
1,000 0
C
al
o
ries
24h
record
4,000
3,000
2,000
1,000
Protein FFQA
110 100 90 80 70 60 50 40
Protein
24h
record
160
140
120
100
80
60
40
Carbohydrate FFQA
320 300 280 260 240 220 200
Carbohydrate
24h
record
400
300
200
100
Lipid FFQA
100 90 80 70 60 50
Lipid
24h
record
120
110
100
90
80
70
60
50
40
(A) (B)
(C) (D)
110
70 4,000
able bias was observed (respectively λ =0.22 and λ =0.20), demonstrating sizeable correction for approxi-mation of the reference value. Values of λ obtained by Kaaks et al10 for protein intake in the pilot phase of the
European Prospective Investigation into Cancer and Nutrition (EPIC) varied from 0.23 (Italian women) to 0.43 (Dutch men). Stram et al17 reported λ values of
protein intake for men (ranging from 0.25 to 0.39), for women, values observed ranged from 0.27 to 0.56 tak-ing ethnic group into account. Regardtak-ing lipids, values observed ranged from 0.53 to 0.57 in men, and 0.34 to 0.68 in women.
In the present study, variables were adjusted according to energy using the residual method, widely used in the literature, with great consistency between the adjusted mean and the original mean. Adjustment according to energy is motivated both by the need to consider isocaloric models, and to control the measure error which is part of the methods.5,11,18 Pearson’s correlation
coeffi cients, after calibration, were high for energy and low for macronutrients, demonstrating consistency with estimates of calibration factor.
A premise of the method is the normality of distribution of the variables in the model.7 In the present study,
vari-ables presented normal distribution and cut-off points for excluding non-plausible values were established. Attenuation observed in the slope value may be par-tially explained by the bias in the intake report, of the estimate error obtained by the reference method. This effect may be present because of the time and differ-ence in the dietary data for nutrient intake among the methods used.4,15
Another explanation regarding the attenuation of λ coeffi cient is the violation of theoretical assumptions of the calibration method, such as independence be-tween the errors of both assessment methods of dietary
intake, absence of systematic errors in the reference method, and the independence between errors and real intake.18
One of the results observed was the shortening of standard-deviation for calibrated data. This behavior has also been described in other studies.12,15 Calibrated
data present less variation than original ones due to the correction of classifi cation error of the individuals. Extreme values are especially affected by linear cor-rection due to the assumption of linearity between the reference method and the questionnaire.13
Fraser and Stram7, demonstrated the present bias when
crude FFQ data are used in a multivariate regression to estimate the effect of diet in disease and it is essentially eliminated by a calibration regression. Thus, the use of FFQA in epidemiological studies without correction, may lead to the above described situation. The authors call attention to the wide literature of studies on the diet-disease correlation which, in general, do not make use of techniques of error correction, which may explain the confl icting or inconsistent results.
In the present study, we could observe that the linear calibration approach makes corrected values more similar to the mean of reference values, which points out to a reduction of the measure error. However, ap-plying the linear regression method presented raises issues that should be further discussed. Among the issues that are worth mentioning, is the performance of this approach when the theoretical assumptions are not met, which is common in dietary studies that use measurement methods based on individual’s reports as a reference.
Thus, it is possible to highlight the need for studying new methodologies to correct measure error or even searching for new alternatives that make FFQA a less imperfect instrument.
1. Andrade RG, Pereira RA, Sichieri R. Consumo alimentar de adolescentes com e sem sobrepeso do município do Rio de Janeiro. Cad Saúde Pública. 2003;19:1485-95.
2. Armstrong BK, White E, Saracci R. Principles of exposure measurement in epidemiology. Oxford: Oxford University Press; 1995.
3. Beaton GH. Approaches to analysis of dietary data: relationship between planned analyses and choice of methodology. Am J Clin Nutr. 1994;59(1 Suppl): 253S-61.
4. Carroll RJ, Freedman L, Pee D. Design aspects of calibration studies in nutrition with analysis of missing data in linear measurement error models. Biometrics. 1997;53:1440-57.
5. Ferrari P, Kaaks R, Fahey MT, Slimani N, Day NE, Pera G et al. Within- and Between-Cohort variation in measured macronutrient intakes, taking account of measurement errors, in the European Prospective Investigation into Cancer and Nutrition Study. AmJ Epidemiol. 2004;160(8):814-22.
6. Fisberg RM, Slater B. Manual de receitas e medidas caseiras para cálculo de inquéritos alimentares: manual elaborado para auxiliar o processamento de dados de inquéritos alimentares. São Paulo: Signus; 2002.
7. Fraser GE, Stram DO. Regression calibration in studies with correlated variables measured with error. Am J Epidemiol. 2001;154:836-44.
8. Fraser GE, Shavlik DJ. Correlations between estimated and true dietary intakes. Ann Epidemiol. 2004;14:287-95.
9. Johansson I, Hallmans G, Wikman A, Biessy C, Riboli E, Kaaks R. Validation and calibration of food-frequency questionnaire measurements in the Northern Sweden Health and Disease cohort. Public Health Nutr. 2002; 5(3):487-96.
10. Kaaks R, Riboli E, Van Staveren W. Calibration of dietary intake measurements in prospective cohort studies. Am J Epidemiol. 1995;142:548-56.
11. Kaaks R, Ferrari P, Ciampi A, Plummer M, Riboli E. Part H. Uses and limitations of statistical accounting for random error correlations, in the validation of dietary questionnaire assessments. Public Health Nutr. 2002;5(6A):969-76.
12. Kipnis V, Midthune D, Freedman L, Bingham S, Day NE, Riboli E, RJ, et al. Part E. Bias in dietary-report instruments and its implications for nutritional epidemiology. Public Health Nutr. 2002;5(6A):915-23.
13. Kynast-Wolf G, Becker N, Kroke A, Brandstetter BR, Wahrendorf J, Boeing H. Linear regression calibration:
theoretical framework and empirical results in EPIC, Germany. Ann Nutr Metab. 2002;46:2-8.
14. Rosner B, Willett WC, Spiegelman D. Correction of logistic regression relative risk estimates and confi dence intervals for systematic within-person measurement error. Stat Med. 1989;8:1051-69.
15. Sempos CT, Looker AC, Johnson CL, Woteki CE. The importance of withing–person variability in estimating prevalence. In: Macdonald I, editor. Monitoring dietary intakes. New York: Springer-Verlag; 1991. p. 99-109.
16. Slater B, Philippi ST, Fisberg RM, Latorre MRDO. Validation of a semi-quantitative adolescent food frequency questionnaire applied at a public school in São Paulo, Brazil. Eur J Clin Nutr. 2003;57:629-35.
17. Stram DO, Hankin JH, Wilkens LR, Pike MC, Monroe KR, Park S, et al. Calibration of the dietary questionnaire for a multiethnic cohort in Hawaii and Los Angeles. Am J Epidemiol. 2000;151:358-70.