Sodium and potassium intake estimated using two methods in
the Brazilian Longitudinal Study of Adult Health (ELSA-Brasil)
Consumo de sódio e potássio estimado por dois métodos no Estudo Longitudinal
de Saúde do Adulto (ELSA-Brasil)
Taísa Sabrina Silva Pereira
I, Isabela Judith Martins Benseñor
II, Jorge Gustavo Velásquez Meléndez
III, Carolina Perim de Faria
IV,
Nágela Valadão Cade
V, José Geraldo Mill
VI, Maria del Carmen Bisi Molina
VIIUniversidade Federal do Espírito Santo (UFES), Vitória, Espírito Santo, Brazil
ABSTRACT
CONTEXT AND OBJECTIVE: Sodium and potassium intake from diferent food sources is an important issue regarding cardiovascular physiology. Epidemiological assessment of the intake of these electrolytes intake is done through food frequency questionnaires or urinary excretion measurements. Our aim was to compare these methods using a sample of Brazilian civil servants.
DESIGN AND SETTING: Cross-sectional baseline evaluation from the Brazilian Longitudinal Study of Adult Health.
METHODS: Sodium and potassium intake was obtained using two methods: a semi-quantitative questionnaire including 114 food items; and overnight 12-hour urinary excretion measurement. Sodium and potassium estimates obtained through the questionnaire were adjusted for energy intake using the residual method. Urinary excretion measurements were considered valid if they met three adequacy criteria: collection time, volume and total creatinine excretion. Mean nutrients were estimated, and Spearman correlations were calculated. Sodium and potassium intake was categorized into quintiles, and weighted kappa coeicients and percentage agreement were calculated. The signiicance level for all tests was 0.05.
RESULTS: Data from 15,105 participants were analyzed, and signiicant diferences between mean intakes of sodium (questionnaire: 4.5 ± 1.7 g; urine: 4.2 ± 2.1 g) and potassium (questionnaire: 4.7 ± 1.8 g; urine: 2.4 ± 1 g) were found. Weak agreement was found for sodium (K = 0.18) and potassium (K = 0.16). The percentage disagreement between methods ranged from 41.8 to 44.5%, while exact concordance ranged from 22.1% to 23.9%.
CONCLUSIONS: The agreement between the food frequency questionnaire and urinary excretion measurements for assessment of sodium and potassium intakes was modest.
RESUMO
CONTEXTO E OBJETIVO: O consumo de sódio e potássio de diferentes fontes alimentares é uma questão importante para a isiologia cardiovascular. A avaliação epidemiológica do consumo desses eletrólitos é feita pelo questionário de frequência alimentar ou pela excreção urinária. O objetivo deste estudo é comparar esses métodos em uma amostra de servidores públicos brasileiros.
TIPO DE ESTUDO E LOCAL: Avaliação transversal da linha de base do Estudo Longitudinal de Saúde do Adulto.
MÉTODOS: O consumo de sódio e potássio foi obtido por dois métodos: questionário semi-quantitativo com 114 itens alimentares e excreção urinária de 12 horas noturnas. Estimativas de sódio e potássio obtidas pelo questionário foram ajustadas pela energia utilizando o método residual. A excreção urinária foi considerada válida se atendesse a três critérios: tempo de coleta, volume e excreção total de creatinina adequados. Foram estimadas médias dos nutrientes e calculada a correlação de Spearman. O consumo de sódio e potássio foi categorizado em quintis e foram calculados o kappa ponderado e o percentual de concordância. O nível de signiicância para todos os testes foi de 0,05.
RESULTADOS: Foram analisados dados de 15,105 participantes e encontradas diferenças signiicativas entre médias de sódio (questionário: 4,5 ± 1,7 g; urina: 4,2 ± 2,1 g) e potássio (questionário: 4,7 ± 1,8 g; urina: 2,4 ± 1 g). Foi encontrada fraca concordância para sódio (K = 0,18) e potássio (K = 0,16). Percentuais de discordância entre métodos variaram de 41,8-44,5%; concordâncias exatas de 22,1-23,9%.
CONCLUSÃO: A concordância entre o questionário de frequência alimentar e excreção urinária para avaliação do consumo de sódio e potássio foi modesta.
IMSc. Doctoral Student of Public Health,
Universidade Federal do Espírito Santo (UFES), Vitória, Espírito Santo, Brazil.
IIMD, PhD. Associate Professor, Department
of Internal Medicine, School of Medicine, Universidade de São Paulo (USP), São Paulo, Brazil.
IIIPhD. Professor in the Department of Maternal
and Child Nursing and Public Health, School of Nursing, Universidade Federal de Minas Gerais (UFMG), Belo Horizonte, Minas Gerais, Brazil.
IVPhD. Assistant Professor, Department of
Integrated Health Education, Universidade Federal do Espírito Santo (UFES), Vitória, Espírito Santo, Brazil.
VPhD. Associate Professor, Department of
Nursing, Universidade Federal do Espírito Santo (UFES), Vitória, Espírito Santo, Brazil.
VIPhD. Titular Professor, Department of
Physiology, Universidade Federal do Espírito Santo (UFES), Vitória, Espírito Santo, Brazil.
VIIPhD. Associate Professor, Department of
Integrated Health Education, Universidade Federal do Espírito Santo (UFES), Vitória, Espírito Santo, Brazil.
KEYWORDS:
Epidemiologic studies. Electrolytes. Biological markers. Diet.
Urine specimen collection.
PALAVRAS-CHAVE:
Estudos epidemiológicos. Eletrólitos.
Marcadores biológicos. Dieta.
INTRODUCTION
Sodium and potassium intake is vital for human life, but excess of sodium and insuiciency of potassium are associated with adverse health outcomes.1-3 A high intake of sodium indicates a
diet rich in manufactured foods, since the food industry uses it to enhance the lavor and prolong the shelf life of processed foods.4
Potassium is considered to be a marker of a healthy diet, since it is a nutrient found in fruits and vegetables.5
Evaluating diet in population-based studies is a challenge, although there are several methods available, such as food fre-quency questionnaires (FFQs), food registers, 24-hour dietary recalls and intake biomarkers. Each method has its advantages and also its limitations.6 Among the methods used to evaluate diet,
FFQs are frequently used in epidemiological studies. hey are less expensive than other methods for evaluating food intake, and they enable correlation between diet and occurrences of diseases.6-8
However, they have limitations, such as the need to use composi-tion tables, which may change from one country to another, thus making comparisons diicult. Also, FFQs oten do not include regional preparations and manufactured foods produced in spe-ciic places, and can overestimate dietary intake.
Moreover, evaluations on food intake may become biased by several factors, such as memory errors, inaccurate estimation of portion sizes and frequency of consumption, and adequacy of the lists in terms of the food items included.6 In the case of
measure-ment of sodium intake, there are some speciic problems due to the wide variability between individuals, in relation to the salt added to food preparations and at meals. Since the food recipe used in the FFQ is standardized, some of this interpersonal vari-ability is lost.
In the case of sodium and potassium, it is possible to measure 24-hour urinary excretion, which is the gold standard for their measurement.9,10 However, the logistics of collecting 24-hour
urine samples are not so simple in studies with large samples. As an alternative, 12-hour urine samples collected overnight can simplify the logistics, since it is easier for the participant. his strategy has been validated for the adult population.11
OBJECTIVE
he aim of this study was to compare sodium and potassium intake measurements, estimated through a food frequency ques-tionnaire and through 12-hour urinary excretion, among partici-pants at the baseline of the Brazilian Longitudinal Study of Adult Health (ELSA-Brasil).
METHODS
Data were collected from all participants at the baseline of the ELSA-Brasil study, which was a prospective cohort study on 15,105 active or retired civil servants of both sexes, aged
between 35 and 74 years, working at the six public higher education institutions at which ELSA-Brasil was conducted.12
ELSA-Brasil was approved by the Research Ethics Committees of the six institutions. he participants attended one of the six research centers on the scheduled date for clinical and lab-oratory tests to be conducted, and for questionnaires to be answered during interviews.12
Overnight 12-hour urine collections were used in ELSA-Brasil to estimate electrolyte excretion levels (sodium, potassium and calcium), as previously described by Mill et al.11 While
scheduling the examinations, the participants received verbal and written information on how to collect their urine, and were given a two-liter plastic bottle for this purpose. he participants were instructed to collect their urine samples between 7 pm and 7 am on the following morning, and to take note of the exact start and end time of the collection, as well as any losses. he notes and the urine collected were brought in by each participant on the day of the examinations. Aliquots of urine were sent to the ELSA-Brasil Central Laboratory for measurements on creatinine level (Jafé method) and on sodium and potassium (ion-selective electrode method).
A 12-hour urine collection was considered valid if it simul-taneously met three criteria: total collection interval of between 10 and 14 hours; collected volume of 250 ml or more; and total creatinine excretion, corrected for body weight, of between 14.4 and 33.6 mg/kg for males and 10.8 and 25.2 mg/kg for females.13
As proposed by Mill et al.,11 data from the overnight 12-hour
uri-nary excretion were used to estimate the 24-hour sodium and potassium intake.11 Salt intake was calculated based on the
esti-mated 24-hour urinary sodium excretion, assuming that all sodium was consumed in the form of sodium chloride.
he FFQ used in the study was a semi-quantitative ques-tionnaire with 114 food items, which had the aim of assessing regular food consumption over the last twelve months.14 It
had been validated for the ELSA-Brasil sample.15 he
nutri-tional composition of each food item included in the FFQ had been estimated using the database of the Nutrition Data System for Research, version 2010.16 For one food item (cassava
lour) that could not be found in this database, the nutritional composition was extracted from the Brazilian Table of Food Composition.17 he nutrient composition of regional
prepa-rations used in ELSA-Brasil was calculated based on recipes provided by technical research publications and teaching insti-tutions, as previously published.15
Ater a preliminary analysis on the data from the FFQ, implausible values were replaced by values corresponding to the 99th percentile of distribution of that speciic food item. Also,
In the present analysis, we followed the guidelines pre-sented by Cobb et al. in 2014.18 hese authors recommended
excluding participants who reported following a diet with sodium restriction, those with cardiovascular disease or dia-betes18 and those who reported a total daily calorie intake of
≤ 500 kcal or > 6000 kcal.19
Statistical analysis
he sodium and potassium intake was adjusted for total energy consumption using the residual method.20 he
Kolmogorov-Smirnov test was used to test the normality of the variables. Means and standard deviations of sodium and potassium val-ues were estimated for both methods (FFQ and urinary excre-tion). hese estimates were then compared using the Mann-Whitney test.
To assess the degree of agreement between the two methods, the estimated sodium and potassium intake was categorized into quintiles. hen, the percentages of exact agreement (same quin-tile), adjacent agreement (adjacent quintiles) and disagreement (opposite quintiles) were calculated. Weighted kappa coei-cients were used to evaluate the concordance between quintiles. Spearman’s correlation was used to evaluate the relationship between the two methods. Correlation coeicients can range from -1 to +1 and can be categorized as weak (r < 0.3), moderate (r = 0.3-0.7) or strong (r > 0.7).9 he signiicance level for all tests
was 0.05. he data were analyzed using the Statistical Package for the Social Sciences (SPSS), version 17.0.
RESULTS
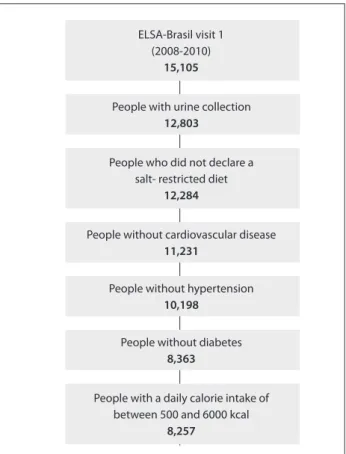
Among the 15,105 participants, the following were excluded: those for whom the urine collection was not validated; those who reported following sodium restriction diets; those with previ-ous cardiovascular diseases; those with a diagnosis diabetes and hypertension at the baseline; and those whose total energy intake was less than 500 kcal or higher than 6000 kcal. hus, 8,257 par-ticipants remained in the analysis (Figure 1).
hese 8,257 participants presented a mean age of 52 ± 9 years; 43.2% (n = 3,566) were male and 56.8% (n = 4,691) were female.
Table 1 presents a comparison between estimated means for sodium and potassium intake: both crude and adjusted for total energy, using the FFQ and the estimated salt intake. Signiicant diferences were found between the estimated mean values (in grams) of sodium in urine (4.2 ± 2.1), unadjusted FFQ (4.5 ± 1.7) and energy-adjusted FFQ (4.3 ± 0.7) (P < 0.001). Signiicant dif-ferences were also observed between the average potassium intake (urine: 2.4 ± 1; unadjusted FFQ: 4.7 ± 1.8; and adjusted FFQ: 4.5 ± 1.0; P < 0.001) and the estimated salt intake (urine: 10.5 ± 5.2; unadjusted FFQ: 11.2 ± 4.2; and adjusted FFQ: 10.6 ± 1.7; P < 0.001).
Table 2 presents the exact agreement, adjacent agree-ment and disagreeagree-ment of the estimated quintiles of sodium and potassium using urinary excretion and FFQ (both crude and adjusted for energy), as well as the weighted kappa coefficient for each nutrient. The percentage disagreement for sodium estimates was 41.8% (unadjusted) and 44.5% (adjusted). For potassium, the percentage disagreement was
Figure 1. Deinition of the sample of participants of the ELSA-Brasil, 2008-2010.
ELSA-Brasil visit 1 (2008-2010)
15,105
People who did not declare a salt- restricted diet
12,284
People without cardiovascular disease
11,231
People with urine collection
12,803
People with a daily calorie intake of between 500 and 6000 kcal
8,257
People without diabetes
8,363
People without hypertension
10,198
*Adjusted for energy. †P < 0.01 in relation to urinary excretion.
SD = standard deviation.
Nutrients/salt
Methods
Urinary excretion Crude FFQ Adjusted FFQ*
Mean ± SD Mean ± SD Mean ± SD
Sodium (g) 4.2 ± 2.1 4.5 ± 1.7† 4.3 ± 0.7†
Potassium (g) 2.4 ± 1.0 4.7 ± 1.8† 4.5 ± 1.0†
Salt (g) 10.5 ± 5.2 11.2 ± 4.2† 10.6 ± 1.7† Median (P25-P75) Median (P25-P75) Median (P25-P75)
42.6% (unadjusted) and 42.8% (adjusted). The calculated exact agreement (same quintile) was 23.4% for unadjusted sodium and 22.1% for adjusted sodium, and it was 23.9% for unadjusted potassium and 23.5% for adjusted potassium. The weighted kappa coefficient for unadjusted nutrients was 0.18 (sodium) and 0.16 (potassium).
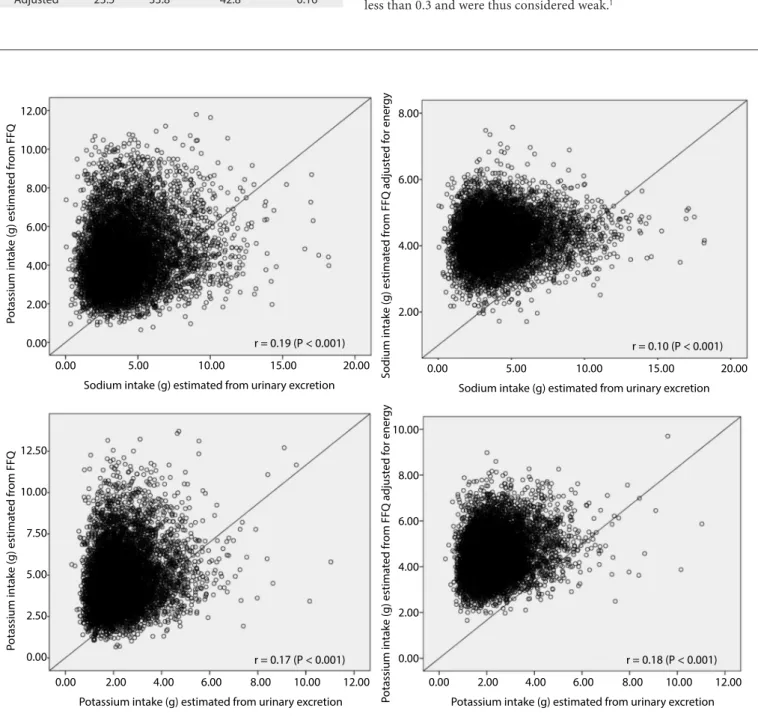
Figure 2 presents the Spearman correlation coeicients for the estimates of sodium and potassium intake, as measured through overnight 12-hour urinary excretion, and through unadjusted and energy-adjusted FFQs. he correlations were less than 0.3 and were thus considered weak.1
Figure 2. Correlation of estimated consumption of sodium and potassium between the methods of urinary excretion and food frequency questionnaire (FFQ), expressed as crude values and values adjusted for energy, among participants of ELSA-Brasil, 2008-2010.
0.00
P
otassium in
take (g) estima
ted
from
FFQ
Potassium intake (g) estimated from urinary excretion 2.00
0.00 2.50 5.00 7.50 10.00 12.50
4.00 6.00 8.00
r = 0.17 (P < 0.001)
10.00 12.00 0.00
P
otassium in
take (g) estima
ted
from
FFQ
Sodium intake (g) estimated from urinary excretion 0.00
2.00 4.00 6.00 8.00 10.00 12.00
5.00 10.00
r = 0.19 (P < 0.001)
15.00 20.00 0.00
S
odium in
take (g) estima
ted
from
FFQ adjust
ed f
or ener
gy
Sodium intake (g) estimated from urinary excretion 2.00
4.00 6.00 8.00
5.00 10.00
r = 0.10 (P < 0.001)
15.00 20.00
0.00
P
otassium i
n
take (g) estima
ted
from
FFQ adjust
ed f
or ener
gy
Potassium intake (g) estimated from urinary excretion 2.00
0.00 2.00 4.00 6.00 8.00 10.00
4.00 6.00 8.00
r = 0.18 (P < 0.001)
10.00 12.00
FFQ = food frequency questionnaire.
Nutrients Agreement (%) Weighted
kappa
Exact Adjacent Disagreement
Sodium
Crude 23.4 34.9 41.8 0.18
Adjusted 22.1 33.2 44.5 0.09
Potassium
Crude 23.9 33.4 42.6 0.16
Adjusted 23.5 33.8 42.8 0.16
DISCUSSION
In this study, the estimated sodium and potassium intake, as measured using the FFQ, presented modest correlations with 12-hour urinary excretion measurements.
he estimated means for sodium and potassium intake measured using the FFQ in this study were diferent from the results of the Brazilian Household Budget Survey (Pesquisa de Orçamento Familiar),21 which collected data in Brazil between
2008 and 2009. Food records from a subsample of houses were assessed, and the sodium and potassium intake was seen to be diferent from our results.21 Two possible explanations for these
diferences are the method used to measure sodium and potas-sium intake, and the diferent age strata between the two studies.
In a study on hypertensive individuals over 50 years of age, Dallepiane et al.22 compared two methods for evaluating sodium
intake: a questionnaire with 21 food items that considered important sources of sodium; and 24-hour urinary excretion. he correlations between the two methods were low and not sig-niicant, and the authors concluded that despite the advantages of the questionnaire, it could not be used for this purpose.22 In a
val-idation study on a FFQ using biomarkers, Sauvageot et al.23 also
reported weak correlations of sodium between the two meth-ods. Ferreira-Sae et al.24 validated a FFQ with 50 food items that
were sources of sodium intake, among hypertensive individuals. hey did not report any signiicant correlations between FFQ and 24-hour urinary excretion.24 In a study in Porto Alegre, in
southern Brazil, Micheli and Rosa25 did not ind good agreement
between the food register and 12-hour urinary sodium excretion. High amounts of sodium are generally found in sausages and other manufactured products. Salt added in the preparation of meals is another important source of sodium. herefore, the weak correlation between the FFQ and overnight urinary sodium may be explained by high interpersonal variability in urinary sodium. Urinary excretion of sodium and potassium has been pre-sented as a more accurate method for measuring the intake of these nutrients, although its use in large studies has important limitations with regard to urine collection done by the study participants. However, it does not identify the sources of foods associated with this high intake. hrough using both the FFQ and 24-hour urinary excretion, we obtained measurements of the intake as well as identifying the dietary sources of sodium and potassium. One potential explanation for the diferences in nutrient estimates obtained through the two methods used may be related to the intrinsic methodological aspects of the measure-ment technique: the FFQ relects the habitual consumption over the last twelve months, while the igures presented through uri-nary excretion relect the participant’s food consumption over a period closer to the time of sample collection.
Application of statistical methods helps minimize and correct for the wide variability that is characteristic of diets. In this study, ater adjustment of nutrients for energy intake, diferent behav-iors were observed, namely, an increase in the estimated intake of potassium and a decrease in the intake of sodium. A similar result was also found in another study in which nutrients were adjusted for energy intake.5 he adjustment for energy intake
may increase the correlation coeicient, as occurred with potas-sium in our data. If the nutrient intake is related to the energy intake, it may decrease when the variability of a speciic nutrient intake is related to systematic errors of under or overestimation in the reporting of food consumption, as probably occurred with sodium in this analysis.9
Although we used the database of the Nutrition Data System for Research, which would make it possible to discriminate the amount of salt and condiments added to the food preparations of each participant, this was not done in our study, because a FFQ with 114 items was used, and because of the high number of par-ticipants (15,105). he recipe of the preparations was the same for all participants, since the FFQ focuses on frequency and por-tion size. All of these points may explain the inding of a weak correlation between the two methods.
Our study has some strengths and limitations. It included a large sample of participants and used a FFQ built especially for the study. However, urinary excretion data were collected only once. We followed the same strategy as that of Cobb et al.,18 which
has now become a guideline for studies that measure sodium intake. his limitation is observed in all major epidemiological studies, in which the complex logistics of sample collection seem to limit measurements to once only. Another limitation is that we collected overnight 12-hour and not 24-hour urinary excretion measurements. Since the participants remained in the research center for approximately 6 hours in order to attend the inter-views and undergo several tests, they missed one day of work. It is complicated to collect 24-hour urine at work. Had we chosen the option of 24-hour collection, we would have had to ask the participants to miss another day of work, thereby decreasing the adhesion to the study.
CONCLUSIONS
Our results showed that the agreement between a food frequency questionnaire and urinary excretion measurements for assess-ment of sodium and potassium intake was modest.
REFERENCES
1. Dyer A, Elliott P, Chee D, Stamler J. Urinary biochemical markers of dietary intake in the INTERSAL study. Am J Clin Nutr. 1997;65(4 Suppl):1246S-1253S.
2. Mente A, O’Donnell MJ, Rangarajan S, et al. Association of urinary sodium and potassium excretion with blood pressure. N Engl J Med. 2014;371(7):601-11.
3. O´Donnell M, Mente A, Rangarajan S, et al. Urinary sodium and potassium excretion, mortality, and cardiovascular events. N Engl J Med. 2014;371(7):612-23.
4. Nakasato M. Sal e hipertensão arterial [Salt and Hypertension]. Rev Bras Hipertens. 2004;11(2):95-7.
5. Rodríguez-Rodríguez E, Ortega RM, Andrés Carvajales P, González-Rodríguez LG. Relationship between 24 h urinary potassium and diet quality in the adult Spanish population. Public Health Nutr. 2015;18(5):850-9.
6. Fisberg RM, Martini LA, Slater B. Métodos de inquéritos alimentares. In: Fisberg RM, Slater B, Marchioni DML, Martini LA. Inquéritos alimentares: métodos e bases cientíicos. São Paulo: Manole; 2005. p. 1-29. 7. Willett WC. Future directions in the development of food-frequency
questionnaires. Am J Clin Nutr. 1994;59(1 Suppl):171S-174S. 8. Lopes ACS, Caiafa WT, Mingoti SA, Lima-Costa MFF. Ingestão alimentar
em estudos epidemiológicos [Food intake in epidemiological studies]. Rev Bras Epidemiol. 2003;6(3):209-19.
9. Willett WC. Nutritional epidemiology. 2nd ed. New York: Oxford
University Press; 1998.
10. Bingham SA. Biomarkers in nutritional epidemiology. Public Health Nutr. 2002;5(6A):821-7.
11. Mill JG, Silva AB, Baldo MP, Molina MC, Rodrigues SL. Correlation between sodium and potassium excretion in 24- and 12-h urine samples. Braz J Med Biol Res. 2012;45(9):799-805.
12. Aquino EM, Barreto SM, Bensenor IM, et al. Brazilian Longitudinal Study of Adult Health (ELSA-Brasil): objectives and design. Am J Epidemiol. 2012;175(4):315-24.
13. Ljungman S, Granerus G. The evaluation of kidney function in hypertensive patients. In: Larah JH, Brenner BM. Editors. Hypertension: pathophysiology, diagnosis, and management. 2nd ed. New York:
Raven Press; 1995. p. 1987-2004.
14. Molina MCB, Faria CP de, Cardoso LO, et al. Avaliação da dieta no Estudo Longitudinal de Saúde do Adulto (ELSA-Brasil): desenvolvimento do Questionário de Frequência Alimentar [Diet assessment in the Brazilian Longitudinal Study of Adult Health (ELSA-Brasil): Development of a food frequency questionnaire]. Rev Nutr. 2013;26(2):167-76.
15. Molina MCB, Benseñor IM, Cardoso LO, et al. Reprodutibilidade e validade relativa do Questionário de Frequência Alimentar do ELSA-Brasil [Reproducibility and relative validity of the Food Frequency Questionnaire used in the ELSA-Brasil]. Cad Saúde Pública. 2013;29(2):379-89.
16. Dietary intake data were collected and analyzed using Nutrition Data System for Research software version. Minneapolis: Nutrition Coordinating Center, University of Minnesota; 2010.
17. Núcleo de Estudos e Pesquisas em Alimentação. Tabela brasileira de composição de alimentos. 2a edição. Campinas: Universidade
Estadual de Campinas; 2006. Available from: http://www.unicamp. br/nepa/taco/contar/taco_versao2.pdf. Accessed in 2015 (Sep 30). 18. Cobb LK, Anderson CA, Elliott P, et al. Methodological issues in cohort
studies that relate sodium intake to cardiovascular disease outcomes: a science advisory from the American Heart Association. Circulation. 2014;129(10):1173-86.
19. Andrade RG, Pereira RA, Sichieri R. Consumo alimentar de adolescentes com e sem sobrepeso do Município do Rio de Janeiro [Food intake in overweight and normal-weight adolescents in the city of Rio de Janeiro]. Cad Saúde Pública. 2003;19(5):1485-95. 20. Willett WC, Howe GR, Kushi LH. Adjustment for total energy intake in
epidemiologic studies. Am J Clin Nutr. 1997;65(4 Suppl):1220S-1228S; discussion 1229S-1231S.
21. Brasil. Instituto Brasileiro de Geograia e Estatística. Pesquisa de orçamentos familiares 2008-2009. Análise do consumo alimentar pessoal no Brasil. Rio de Janeiro: IBGE; 2011. Available from: http:// www.ibge.gov.br/home/estatistica/populacao/condicaodevida/ pof/2008_2009_analise_consumo/. Accessed in 2015 (Sep 11). 22. Dallepiane LB, Schweigert ID, Bellé TRL, et al. Comparación entre los
métodos subjetivo y objetivo para estimar el consumo de sodio en hipertensos. Nutrición Hospitalaria. 2011;26(1):122-7. Available from: http://www.lume.ufrgs.br/bitstream/handle/10183/61376/000777404. pdf?sequence=1. Accessed in 2015 (Sep 11).
23. Sauvageot N, Alkerwi A, Albert A, Guillaume M. Use of food frequency questionnaire to assess relationships between dietary habits and cardiovascular risk factors in NESCAV study: validation with biomarkers. Nutr J. 2013;12(1):143.
24. Ferreira-Sae MC, Gallani MC, Nadruz W, et al. Reliability and validity of a semi-quantitative FFQ for sodium intake in low-income and low-literacy Brazilian hypertensive subjects. Public Health Nutr. 2009;12(11):2168-73.
25. Micheli ET, Rosa AA. Estimation of sodium intake by urinary excretion and dietary records in children and adolescents from Porto Alegre, Brazil: a comparison of two methods. Nutrition Research. 2003;23(11):1477-87. Available from: http://www.nrjournal.com/article/S0271-5317%2803%2900157-X/abstract. Accessed in 2015 (Sep 11).
Defense of master’s dissertation. Postgraduate Program on Public Health. Universidade Federal do Espírito Santo (UFES), Vitória, Espírito Santo, Brazil, March 14, 2014.
Sources of funding: The ELSA-Brasil baseline study, including this validation substudy, was supported by the Brazilian Ministry of Health (Science and Technology Department) and the Brazilian Ministry of Science and Technology and CNPq (National Research Council) (grant # 01 06 0010.00 RS, 01 06 0212.00 BA, 01 06 0300.00 ES, 01 06 0278.00 MG, 01 06 0115.00 SP and 01 06 0071.00 RJ)
Conlict of interests: None
Date of irst submission: June 24, 2015
Last received: August 28, 2015
Accepted: August 31, 2015
Address for correspondence:
Maria del Carmen Bisi Molina Universidade Federal do Espírito Santo Av. Marechal Campos, 1.468