Correlates of C-reactive protein levels in
young adults: a population-based cohort
study of 3827 subjects in Brazil
A. Nazmi
1,
I.O. Oliveira
2and
C.G. Victora
31
Department of Epidemiology, School of Public Health, University of Michigan, Ann Arbor, MI, USA
2Departamento de Fisiologia e Farmacologia, Instituto de Biologia, Universidade Federal de Pelotas,
Pelotas, RS, Brasil
3
Programa de Pós-Graduação em Epidemiologia, Universidade Federal de Pelotas, Pelotas, RS, Brasil
Correspondence to: A. Nazmi, Department of Epidemiology, School of Public Health, University of
Michigan, 109 Observatory Street, Ann Arbor, MI 48104, USA
E-mail: [email protected]
The socio-demographic, behavioral and anthropometric correlates of C-reactive protein levels were examined in a representa-tive young adult Brazilian population. The 1982 Pelotas Birth Cohort Study (Brazil) recruited over 99% of births in the city of Pelotas that year (N = 5914). Individuals belonging to the cohort have been prospectively followed up. In 2004-2005, 77.4% of the cohort was traced, members were interviewed and 3827 individuals donated blood. Analyses of the outcome were based on a conceptual model that differentiated confounders from potential mediators. The following independent variables were studied in relation to levels of C-reactive protein in sex-stratified analyses: skin color, age, family income, education, parity, body mass index, waist circumference, smoking, fat/fiber/alcohol intake, physical activity, and minor psychiatric disorder. Geometric mean (95% confidence interval) C-reactive protein levels for the 1919 males and 1908 females were 0.89 (0.84-0.94) and 1.96 mg/L (1.85-2.09), respectively. Pregnant women and those using oral contraceptive therapies presented the highest C-reactive protein levels and all sub-groups of women had higher levels than men (P < 0.001). Significant associations between C-reactive protein levels were observed with age, socioeconomic indicators, obesity status, smoking, fat and alcohol intake, and minor psychiatric disorder. Associations were stronger at higher levels of C-reactive protein and some associations were sex-specific. We conclude that both distal (socio-demographic) and proximal (anthropometric and behavioral) factors exert strong effects on C-reactive protein levels and that the former are mediated to some degree by the latter.
Key words: C-reactive protein; Inflammation; Cohort studies; Prospective studies; Brazil
Research supported by the Wellcome Trust initiative entitled Major Awards for Latin America on Health Consequences of Population Change. Earlier phases of the 1982 cohort study were supported by the International Development Research Center (Canada), the World Health Organization (Department of Child and Adolescent Health and Development, and Human Reproduction Program), the Overseas Development Administration (United Kingdom), the United Nations Development Fund for Women, the National Program for Centers of Excellence (Brazil), the National Research Council (Brazil), and the Ministry of Health (Brazil).
Received August 23, 2007. Accepted April 18, 2008
Introduction
There has recently been increasing interest in identify-ing factors associated with inflammation, a fundamental process in atherogenesis. C-reactive protein (CRP) has
Racial/ethnic, socioeconomic and demographic corre-lates have been studied as potential distal determinants of CRP levels. Proximal factors that have been examined include diet (3), alcohol intake (4), smoking (5), anthropo-metric indicators of body fat (6), physical activity (7), and stress (8). Results from these studies have not always been consistent, though age, female sex and poverty have been widely shown to be positively associated with CRP levels as have proximal factors including smoking, poor diet, higher body fat, lower levels of physical activity, and high stress.
Identifying factors associated with CRP levels could lead to strategies designed to combat the causes or long-term consequences of chronic inflammation. Identification of these factors in young adults would be particularly useful. There are few population-based studies on this topic in low- and middle-income countries, and none in Latin America, where nutrition and epidemiological transi-tions are already exerting a heavy toll. Thus, the purpose of this study was to examine the correlates of C-reactive protein levels in a young adult Brazilian population.
Material and Methods
The 1982 Pelotas Birth Cohort Study (Brazil) is one of the largest and longest-running prospective birth cohorts in the low- and middle-income countries. It enrolled 5914 live births to mothers who lived in the urban area of the city that year (population in 1982: 214,000), representing over 99% of total births. A questionnaire on socio-demographic and health factors was applied to the mothers soon after delivery. The cohort has been followed up numerous times through-out the years. More detailed information on methods, vari-ables and sampling fractions has been published (9).
In 2004-2005, members of the 1982 cohort were sought using a variety of methods. Family income data were categorized into groups representing ≤1, 1.1-3.0, 3.1-6.0, 6.1-10, and >10 minimum wage units. These groupings capture the wide income gaps common in Brazil more precisely than a division into, say, quintiles. The minimum wage at the time of the cohort visit was equivalent to approximately US$180. Number of years of formal educa-tion completed by the participant was also collected and grouped into 0-4, 5-8, 9-11, and ≥12 years.
Self-described skin color of the participant was collected as white, black, and mulatto, others being excluded due to small numbers (76 Indigenous and 74 Asian). Current smok-ing was defined as smoksmok-ing at least one cigarette per week and analyzed as a dichotomous variable.
A food frequency questionnaire was applied and rel-evant elements were used to calculate intake of fat and
fiber as suggested by Block et al. (10). Fat intake was grouped as “best low fat”, “lower fat”, “American diet”, “high fat”, and “very high fat” and analyzed as an ordinal variable. Fiber intake was dichotomized into “adequate/moderate” or “low fiber intake”. An overall score for alcohol intake was calculated and categorized into three groups: “non-drinker”, “one drink per day” (equivalent to 350 mL beer, 150 mL wine, or 30 mL liquor), or “more than one drink per day”.
Information on physical activity (leisure time, transpor-tation, occupation, and housework) was collected using long version of the International Physical Activity Ques-tionnaire (www.ipaq.ki.se). Total and leisure time physical activity variables were dichotomized, defining as “seden-tary” those with less than 150 min of moderate-intensity physical activity per week.
Interviewers applied the Self-Reported Questionnaire-20 (SRQ), which has been validated in Brazil, to evaluate mental health. SRQ score was dichotomized into sex-specific groups representing those without and those with an elevated score (≥6 for men and ≥8 for women). An elevated score was used in this study as a proxy for mental stress.
Individuals were weighed using the Seca (UNICEF) scale (100 g precision). A locally manufactured aluminum anthropometer (1 mm precision) was used to measure standing height. Body mass index (BMI) was calculated as kg/m2 and categorized into WHO recommended groups:
<18.5 (underweight), 18.5-24.9 (normal), 25.0-29.9 (over-weight), and ≥30.0 (obese) (11).
Waist circumference was measured at the narrowest girth of the trunk or halfway between the costal margin and iliac crest using a fiberglass measuring tape (Cardiomed, Brazil, 1 mm precision). Central obesity was analyzed both as a continuous variable and dichotomous variable, using cutoffs of ≥94 cm for men and ≥80 cm for women (12).
Quality control measures throughout the 2004-2005 cohort visit included telephoning or re-visiting 10% of the interviewed participants by study supervisors to test reli-ability and double data input.
Non-fasting venous blood was collected from volun-teers being interviewed. High sensitivity CRP assays were performed using the automated DPC (Siemens) Immulite chemiluminescent immunoassay (Los Angeles, CA, USA). The intra- and inter-assay coefficients of variation were 10 and 7%, respectively. Samples with results below the assay sensitivity threshold, which registered as <0.1 mg/L, were converted to 0.05 mg/L for statistical analysis.
Statistical analysis
mini-mum detectable differences in CRP values relative to independent variables were calculated using a two-tailed level of significance of 95 with 80% power. Sample size calculations were based on standard deviations of 1.0 and 3.0 mg/L CRP, reflecting the variations described in the literature. The minimum detectable differences between groups were thus calculated and ranged from 0.10 and 0.60 mg/L, depending on the exposure.
CRP values (mg/L) were natural log-transformed (ln mg/L) for greater symmetry prior to undertaking statistical analyses (Figure 1). CRP values are presented in the text
as the geometric mean 95% confidence interval (95%CI), which were similar to median values. Linear and logistic regression were used, the former for continuous ln CRP values and the latter for CRP >10 mg/L. Wald tests for trend and heterogeneity were used where appropriate. Analyses were stratified by gender. Statistical analyses were based on a conceptual framework based on a hierar-chy of levels of determination (Table 1). Socio-demo-graphic variables may be confounders for anthropometric and behavior variables, whereas the latter are potential mediators of the former. Socio-demographic factors were
Figure 1. Figure 1. Figure 1. Figure 1.
over-represented in this follow-up (data not shown). Geometric mean (95%CI) CRP levels for the 1919 males and 1908 females were 0.89 (0.84-0.94) and 1.96 mg/L (1.85-2.09), respectively. Seventy-nine (4.1%) men and 194 (10.2%) women had CRP levels >10 mg/L.
A total of 445 women were using oral contraceptive therapy (OCT) at the time blood was drawn and 93 others were pregnant. Women who were neither pregnant nor using OCT had the lowest CRP levels (1.66 mg/L (1.54-1.78)), followed by women using OCT (2.88 (2.58-3.22)), and pregnant women had the highest levels (3.90 (3.11-4.90)). Differences between men and all categories of women were significant (P < 0.0001), as were differences between each of the three groups of women (P < 0.0001). Men (N = 1919) and women who were neither pregnant nor using OCT (N = 1370) formed the sample for the main analyses.
The distribution of risk factors and their association with characteristics for the cohort and associations between CRP and the variables in the hierarchical model are reported in Tables 2 and 3 for men and women, respectively.
Skin color did not show any associations with CRP levels in either sex in unadjusted or adjusted analyses. In unadjusted analyses, age showed a strong direct associa-tion in women only, maintaining a significant associaassocia-tion and consistent effect size, even when adjusted for all other variables in the model.
Family income distribution was similar between men and women. In unadjusted analyses and when adjusted for confounders, a significant and direct association between family income and CRP levels was observed in men, with the poorest at 65% the geometric mean CRP levels com-pared to the richest. When potential mediators (i.e., an-thropometric and behavioral factors) were adjusted for, effect size and significance were lost (data not shown). In contrast, unadjusted analyses revealed an inverse trend between family income and CRP levels in women. This association lost significance with adjustment for confound-ers. In crude analyses, there was a significant interaction between sex and income.
On average, women had more years of education than men. Education was inversely associated with CRP levels in women but there was no association in men. When adjusted for confounders, this association disappeared in women.
Parity showed a significant and direct association with CRP levels in women such that those with three or more children had 30% higher geometric mean CRP levels than those with no children. When adjusted for socio-demo-graphic factors, this association was no longer significant. Similar distributions in BMI were observed between the
Table 1. Table 1.Table 1. Table 1.
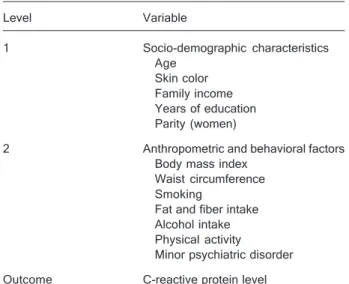
Table 1. Proposed hierarchical model for the associations be-tween socio-demographic, anthropometric and behavioral fac-tors and C-reactive protein levels in young adulthood.
Level Variable
1 Socio-demographic characteristics Age
Skin color Family income Years of education Parity (women)
2 Anthropometric and behavioral factors Body mass index
Waist circumference Smoking
Fat and fiber intake Alcohol intake Physical activity
Minor psychiatric disorder
Outcome C-reactive protein level
adjusted for one another (level 1), and behavioral/anthro-pometric factors were adjusted for each other and also for socio-demographic factors (level 2; Table 1). To investi-gate possible mediating factors, socio-demographic fac-tors that were still significant after adjustment for one another were further adjusted for behavioral/anthropomet-ric factors, and these analyses are mentioned in the text when relevant.
Adjusted ß coefficients and their 95%CI from the analy-ses of geometric means are interpretable as ratios. Analy-ses were performed on Stata, version 8.
BMI and waist circumference - as continuous and categorical variables - were entered in the analyses indi-vidually and simultaneously in an attempt to disentangle the contributions of body mass versus fat distribution in influencing CRP levels.
The Federal University of Pelotas Ethics Committee approved all aspects of the 1982 Pelotas birth cohort study. Informed written consent was collected for the ques-tionnaire and blood draw associated with the 2004-2005 cohort visit.
Results
Table 2. Table 2.Table 2. Table 2.
Table 2. Distribution and associations of C-reactive protein (CRP) levels with socio-demographic (level 1), anthropometric and behavioral (level 2) factors in a total of 1919 men.
Level Independent variable % in group Geometric mean (95%CI) Crude analyses Adjusted analyses
ß (95%CI) P ß (95%CI) P
1 Age (years) - - 1.03 (0.88-1.20) 0.7 1.05 (0.90-1.24) 0.5
Skin colora 0.4* 0.5*
White 77.2 0.92 (0.86-0.98) 1 (ref) 1 (ref)
Mulatto 6.4 0.85 (0.67-1.07) 0.93 (0.73-1.18) 0.95 (0.74-1.21) Black 16.4 0.82 (0.71-0.95) 0.90 (0.76-1.05) 0.91 (0.77-1.07)
Family income in 2004 (minimum wage units) 0.02 0.01
≤1 4.6 0.78 (0.59-1.03) 0.71 (0.52-0.97) 0.65 (0.46-0.92) 1.1-3.0 31.6 0.87 (0.78-0.96) 0.79 (0.65-0.96) 0.77 (0.62-0.96) 3.1-6.0 34.1 0.85 (0.77-0.94) 0.78 (0.64-0.94) 0.75 (0.62-0.92) 6.1-10.0 16.7 0.91 (0.79-1.05) 0.78 (0.64-0.94) 0.83 (0.66-1.03)
>10 12.9 1.10 (0.94-1.28) 1 (ref) 1 (ref)
Education (years) 1.0 0.2
0-4 9.4 0.94 (0.76-1.15) 0.88 (0.68-1.14) 1.04 (0.78-1.39) 5-8 32.5 0.92 (0.83-1.02) 0.87 (0.71-1.06) 0.99 (0.79-1.23) 9-11 46.7 0.83 (0.76-0.90) 0.78 (0.64-0.94) 0.85 (0.70-1.04)
≥12 11.4 1.06 (0.90-1.25) 1 (ref) 1 (ref)
2 BMI (kg/m2)b <0.001 <0.001
<18.5 4.6 0.43 (0.32-0.58) 0.57 (0.43-0.75) 0.60 (0.42-0.85) 18.5-24.9 64.7 0.76 (0.71-0.82) 1 (ref) 1 (ref) 25.0-29.9 23.2 1.17 (1.06-1.29) 1.54 (1.34-1.76) 1.55 (1.31-1.84)
≥30.0 7.5 2.30 (1.91-2.78) 3.03 (2.44-3.76) 2.84 (1.88-4.28)
Central obesityb,c <0.001 0.2
No 89.8 0.81 (0.77-0.86) 1 (ref) 1 (ref)
Yes 10.2 1.90 (1.62-2.22) 2.33 (1.94-2.82) 1.23 (0.92-1.64)
Current smoking 0.05 0.02
No 72.1 0.86 (0.80-0.92) 1 (ref) 1 (ref)
Yes 27.9 0.98 (0.88-1.09) 1.14 (1.00-1.30) 1.21 (1.03-1.42)
Fat intake category 0.2 0.3
Best low fat 11.7 1.01 (0.83-1.23) 1 (ref) 1 (ref) Lower fat 10.9 1.03 (0.85-1.25) 1.02 (0.77-1.35) 0.96 (0.73-1.27) American diet 12.3 0.83 (0.68-1.00) 0.81 (0.62-1.07) 0.81 (0.62-1.06) High fat 14.1 0.80 (0.67-0.96) 0.79 (0.60-1.03) 0.78 (0.60-1.02) Very high fat 51.0 0.90 (0.81-0.99) 0.88 (0.71-1.10) 0.88 (0.71-1.09)
Fiber intakeb 0.7 1.0
Moderate/adequate 30.5 0.92 (0.80-1.05) 1 (ref) 1 (ref) Low 69.5 0.89 (0.83-0.96) 1.03 (0.89-1.19) 1.01 (0.87-1.17)
Alcohol intake 0.02* 0.5*
Non-drinker 24.7 0.85 (0.75-0.96) 1.01 (0.87-1.17) 1.00 (0.84-1.18) Up to 1 drink/day 41.8 0.83 (0.77-0.91) 1 (ref) 1 (ref) More than 1 drink/day 33.5 1.00 (0.91-1.11) 1.20 (1.05-1.38) 1.09 (0.90-1.30)
Table 2 Table 2Table 2 Table 2
Table 2 continued.
Level Independent variable % in group Geometric mean (95%CI) Crude analyses Adjusted analyses
ß (95%CI) P ß (95%CI) P
2 Physical activity, total 0.07 0.4
Not sedentary 92.3 0.88 (0.83-0.93) 1 (ref) 1 (ref) Sedentary 7.7 1.08 (0.85-1.36) 1.23 (0.99-1.53) 1.11 (0.87-1.43)
Physical activity, leisure 0.8
-Not sedentary 50.4 0.90 (0.83-0.97) 1 (ref) -Sedentary 49.6 0.88 (0.81-0.96) 0.98 (0.87-1.10)
-SRQ resultb 0.8 0.4
Normal 75.7 0.88 (0.83-0.94) 1 (ref) 1 (ref)
Elevated 24.4 0.90 (0.80-1.02) 1.02 (0.89-1.17) 1.07 (0.91-1.25)
Crude analyses adjusted for skin color, age, family income, and years of education. Adjusted analyses included adjustment for all variables (except leisure time physical activity).
*Wald test for heterogeneity. aOther categories excluded due to small numbers (N = 43 Indigenous and 27 Asian). bDue to missing
data, the numbers of observations for analyses were: body nass index (BMI) = 1916; central obesity = 1915; fiber intake = 1917; Self-Reported Questionnaire (SRQ, minor psychiatric disorder) = 1914. cDefined as waist circumference ≥94 cm (WHO, 2000). P values
for trend by linear regression, ln CRP as dependent variable.
Table 3. Table 3.Table 3. Table 3.
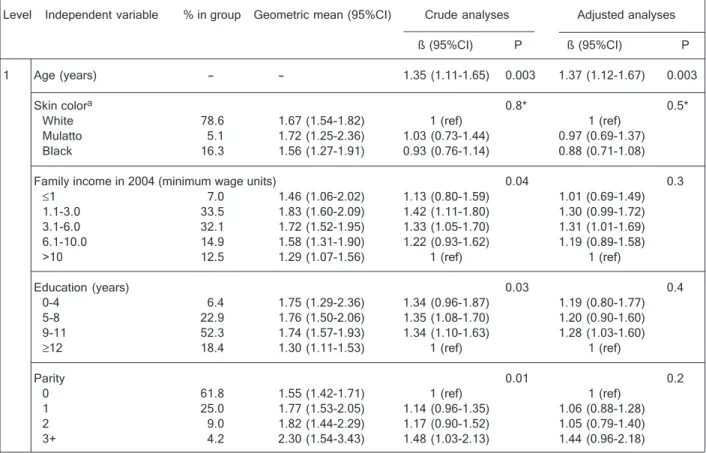
Table 3. Distribution and associations of C-reactive protein (CRP) levels with socio-demographic (level 1), anthropometric and behavioral (level 2) factors in a total of 1370 women.
Level Independent variable % in group Geometric mean (95%CI) Crude analyses Adjusted analyses
ß (95%CI) P ß (95%CI) P
1 Age (years) - - 1.35 (1.11-1.65) 0.003 1.37 (1.12-1.67) 0.003
Skin colora 0.8* 0.5*
White 78.6 1.67 (1.54-1.82) 1 (ref) 1 (ref)
Mulatto 5.1 1.72 (1.25-2.36) 1.03 (0.73-1.44) 0.97 (0.69-1.37) Black 16.3 1.56 (1.27-1.91) 0.93 (0.76-1.14) 0.88 (0.71-1.08)
Family income in 2004 (minimum wage units) 0.04 0.3
≤1 7.0 1.46 (1.06-2.02) 1.13 (0.80-1.59) 1.01 (0.69-1.49) 1.1-3.0 33.5 1.83 (1.60-2.09) 1.42 (1.11-1.80) 1.30 (0.99-1.72) 3.1-6.0 32.1 1.72 (1.52-1.95) 1.33 (1.05-1.70) 1.31 (1.01-1.69) 6.1-10.0 14.9 1.58 (1.31-1.90) 1.22 (0.93-1.62) 1.19 (0.89-1.58)
>10 12.5 1.29 (1.07-1.56) 1 (ref) 1 (ref)
Education (years) 0.03 0.4
0-4 6.4 1.75 (1.29-2.36) 1.34 (0.96-1.87) 1.19 (0.80-1.77) 5-8 22.9 1.76 (1.50-2.06) 1.35 (1.08-1.70) 1.20 (0.90-1.60) 9-11 52.3 1.74 (1.57-1.93) 1.34 (1.10-1.63) 1.28 (1.03-1.60)
≥12 18.4 1.30 (1.11-1.53) 1 (ref) 1 (ref)
Parity 0.01 0.2
0 61.8 1.55 (1.42-1.71) 1 (ref) 1 (ref)
1 25.0 1.77 (1.53-2.05) 1.14 (0.96-1.35) 1.06 (0.88-1.28) 2 9.0 1.82 (1.44-2.29) 1.17 (0.90-1.52) 1.05 (0.79-1.40) 3+ 4.2 2.30 (1.54-3.43) 1.48 (1.03-2.13) 1.44 (0.96-2.18)
Table 3 Table 3Table 3 Table 3
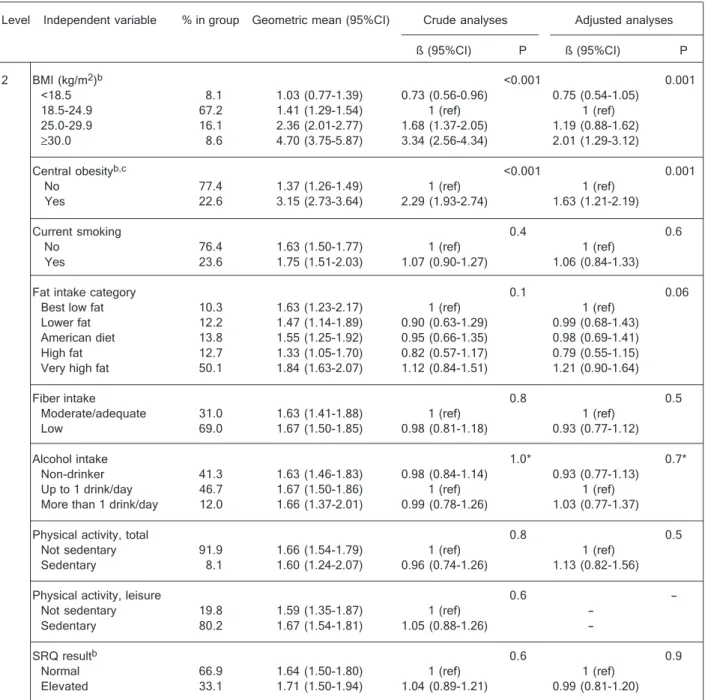
Table 3 continued.
Level Independent variable % in group Geometric mean (95%CI) Crude analyses Adjusted analyses
ß (95%CI) P ß (95%CI) P
2 BMI (kg/m2)b <0.001 0.001
<18.5 8.1 1.03 (0.77-1.39) 0.73 (0.56-0.96) 0.75 (0.54-1.05) 18.5-24.9 67.2 1.41 (1.29-1.54) 1 (ref) 1 (ref) 25.0-29.9 16.1 2.36 (2.01-2.77) 1.68 (1.37-2.05) 1.19 (0.88-1.62)
≥30.0 8.6 4.70 (3.75-5.87) 3.34 (2.56-4.34) 2.01 (1.29-3.12)
Central obesityb,c <0.001 0.001
No 77.4 1.37 (1.26-1.49) 1 (ref) 1 (ref)
Yes 22.6 3.15 (2.73-3.64) 2.29 (1.93-2.74) 1.63 (1.21-2.19)
Current smoking 0.4 0.6
No 76.4 1.63 (1.50-1.77) 1 (ref) 1 (ref)
Yes 23.6 1.75 (1.51-2.03) 1.07 (0.90-1.27) 1.06 (0.84-1.33)
Fat intake category 0.1 0.06
Best low fat 10.3 1.63 (1.23-2.17) 1 (ref) 1 (ref) Lower fat 12.2 1.47 (1.14-1.89) 0.90 (0.63-1.29) 0.99 (0.68-1.43) American diet 13.8 1.55 (1.25-1.92) 0.95 (0.66-1.35) 0.98 (0.69-1.41) High fat 12.7 1.33 (1.05-1.70) 0.82 (0.57-1.17) 0.79 (0.55-1.15) Very high fat 50.1 1.84 (1.63-2.07) 1.12 (0.84-1.51) 1.21 (0.90-1.64)
Fiber intake 0.8 0.5
Moderate/adequate 31.0 1.63 (1.41-1.88) 1 (ref) 1 (ref) Low 69.0 1.67 (1.50-1.85) 0.98 (0.81-1.18) 0.93 (0.77-1.12)
Alcohol intake 1.0* 0.7*
Non-drinker 41.3 1.63 (1.46-1.83) 0.98 (0.84-1.14) 0.93 (0.77-1.13) Up to 1 drink/day 46.7 1.67 (1.50-1.86) 1 (ref) 1 (ref) More than 1 drink/day 12.0 1.66 (1.37-2.01) 0.99 (0.78-1.26) 1.03 (0.77-1.37)
Physical activity, total 0.8 0.5
Not sedentary 91.9 1.66 (1.54-1.79) 1 (ref) 1 (ref) Sedentary 8.1 1.60 (1.24-2.07) 0.96 (0.74-1.26) 1.13 (0.82-1.56)
Physical activity, leisure 0.6
-Not sedentary 19.8 1.59 (1.35-1.87) 1 (ref) -Sedentary 80.2 1.67 (1.54-1.81) 1.05 (0.88-1.26)
-SRQ resultb 0.6 0.9
Normal 66.9 1.64 (1.50-1.80) 1 (ref) 1 (ref)
Elevated 33.1 1.71 (1.50-1.94) 1.04 (0.89-1.21) 0.99 (0.81-1.20)
Crude analyses adjusted for skin color, age, family income, years of education, and parity. Adjusted analyses included adjustment for all variables (except leisure time physical activity).
*Wald test for heterogeneity. aOther categories excluded due to small numbers (N =30 Indigenous and 15 Asian). bDue to missing
data, the numbers of observations for analyses were: body nass index (BMI) = 1369; central obesity = 1368; Self-Reported Questionnaire (SRQ, minor psychiatric disorder) = 1366. cDefined as waist circumference ≥80 cm (WHO, 2000). Excludes pregnant
sexes, but more women (23%) than men (10%) were centrally obese. All analyses in both sexes showed strong direct associations between BMI and CRP levels. Men and women in the obese category of BMI (≥30.0 kg/m2) had
approximately five times higher geometric mean CRP lev-els than those in the underweight category (<18.5 kg/m2).
Similarly, the centrally obese had more than double the CRP levels of those without central obesity. When analy-ses were repeated using the continuous variable, even after adjustment for BMI, waist circumference was associ-ated with higher CRP for men and women (1.02 and 1.03 times the CRP per cm of waist circumference, P = 0.004 and P < 0.001, respectively).
The distribution of smoking was similar between men and women, and showed a significant positive association with CRP levels in men only. This association was main-tained when adjusted for confounders.
About half of both sexes had diets very high in fat and almost 70% consumed insufficient fiber. Women in the highest category of fat consumption showed higher but non-significant levels of CRP. When adjusted for con-founders, this association reached the borderline level (P for trend = 0.06). In men, there was no association be-tween dietary indicators and CRP levels. Fiber intake showed no association in either sex.
Men drinking more than one unit of alcohol per day were at higher risk for elevated CRP than those who did not drink, but this association was no longer significant after adjusting for all other variables. No association was ob-served for women.
Half of the men and 80% of the women were sedentary during leisure time, whereas only about 8% of each were sedentary during total time that included transportation, housework and occupational activities. In men, but not in women, those classified as sedentary had somewhat higher levels of CRP, although statistical significance was border-line. In adjusted analyses, this association lost significance. SRQ scores indicated that 25% of men and 33% of women had minor psychiatric disorders. This variable was not associated with geometric mean CRP levels.
All analyses were repeated using CRP >10 mg/L (acute-level inflammation) as a cut-off. Results were consistent with those using geometric means, with a few exceptions. Whereas obesity remained a risk factor, there was some indication that underweight (BMI <18.5) was also associated with acute levels of CRP in both sexes (1.86 (95%CI = 0.90-3.85) and 1.25 mg/L (0.43-3.61) for men and women, re-spectively). Finally, minor psychiatric illness in men, as-sessed through elevated SRQ, was associated with a preva-lence of acute level CRP that was 1.79 times (95%CI = 1.14-2.82, P = 0.01) higher than individuals with normal SRQ.
Discussion
CRP levels tended to be similar to some representative samples among comparable age groups from the USA (13,14) and New Zealand (15), but higher than those from Japan (16,17). Females tended to have higher levels than males in numerous population-based studies (18,19), al-though not all investigators observed a significant differ-ence (20). Almost a third (27%) of non-pregnant women not using OCT from our sample - compared to only 13% of the men - were in the highest relative risk category (>3.0 and <10.0 mg/L CRP) for cardiovascular disease risk according to CDC/AHA guidelines, suggesting sex-inde-pendent criteria may be inadequate (21).
Age was strongly associated with CRP levels in women, even within the cohort’s narrow age range. Other studies, including samples with similarly restricted age ranges, found direct associations, although both sexes were af-fected in most studies (22,23). Notably, the effect of age in women persisted even when adjusted for all socioeco-nomic, anthropometric and behavioral variables.
Skin color was not associated with CRP levels in either sex in this group. A recent systematic review of population-based studies, nearly all from high-income countries, showed higher risk for Africans, South Asians and Hispan-ics compared to those of European descent, and lower risk for Chinese and Japanese (24). Correct classification of race is complex in a highly miscigenated society such as Brazil but this has not precluded authors from detecting associations between African descent and higher risk of several chronic conditions (25,26).
In women, income and education were inversely asso-ciated with CRP levels in unadjusted analyses, but the confounding effects of age and skin color largely accounted for these associations. For men, CRP levels increased with income, even when adjusted for confounders. Other studies in Brazil have reported that overweight and obesity are directly related to socioeconomic factors in men and inversely related in women, but this has not been shown with respect to inflammatory markers (27,28).
>30 kg/m2 (obese) were at increased risk for acute
inflam-mation (CRP >10 mg/L), suggesting that more extreme levels of obesity may be directly associated with “chronic acute” inflammation.
Most studies that examined smoking in relation to CRP levels found strong direct associations (30) and as ob-served here, some authors detected an association in men only (31,32). It is possible that sex-specific smoking be-haviors - such as inhalation patterns - may impact health outcomes (33).
Healthier dietary profiles are associated with lower levels of CRP and other inflammatory markers (34,35). When adjusted for all other variables including potential mediators such as BMI, we found that women with a very high fat intake showed elevated CRP levels but the overall significance for linear trend was borderline (P = 0.06). These findings suggest that fat intake per se may be involved in pathways that impact inflammation independ-ently of those associated with paracrine activity attribut-able to adipose tissue. Recent studies indicate that meta-bolic signals in response to various nutrients differ, making it feasible that certain metabolites exert specific inflamma-tory effects (36).
Our finding that moderate alcohol intake is associated with lower CRP levels has been reported previously, but not among younger adults (37,38). The literature describes a U-shaped curve of cardiovascular disease according to alcohol intake, but in our adjusted model, this pattern did not maintain significance (39).
It has been proposed that repeated psychological stres-sors chronically activate the innate immune response, driving an inflammatory stimulus and contributing to the progression of atherosclerosis (40). This is supported by observations that stress is a powerful risk factor for the onset and outcome of cardiovascular-related outcomes. In
the logistic regression analysis, elevated SRQ score was a significant risk factor for acute CRP levels in men, although this result was not apparent in the linear regression of geometric means. This finding underscores the impor-tance of investigating psychosocial risk factors, even rela-tively early in life, for cardiovascular disease risk.
Individuals with ongoing inflammatory conditions were not excluded, which is a potential limitation of this study. However, given the young age of the cohort, it is likely that few individuals had chronic disorders and therefore this is unlikely to distort the results. Moreover, exclusion of indi-viduals with CRP >10 mg/L did not significantly impact the findings in either sex. We did not utilize direct measure-ments of body fat and fat distribution, though the indirect methods of BMI and waist circumference are adequate for large samples and widely used in the literature. Nonethe-less, this study was unique because it investigated a novel inflammatory biomarker in a representative sample of young Latin American adults. The fact that the sample is part of a prospective birth cohort opens possibilities for longitudinal and lifecourse analyses as the cohort ages.
We have shown that CRP levels in young adults are affected by demographic, socioeconomic, anthropometric, and behavioral factors and that many effects are sex-specif-ic. Associations were observed with age, socioeconomic indicators, obesity status, smoking, fat and alcohol intake, and minor psychiatric disorder. We conclude that both distal and proximal factors exert strong effects on CRP levels and that the former are mediated to some degree by the latter. This is supported by the fact that many associations lost significance when mediators such as indicators of adiposity, smoking and dietary factors were included in statistical models. The identification of factors that, among young adults, are amenable to intervention reinforces the need for population-based preventive strategies.
References
1. Pepys MB, Hirschfield GM. C-reactive protein: a critical update. J Clin Invest 2003; 111: 1805-1812.
2. Casas JP, Shah T, Cooper J, Hawe E, McMahon AD, Gaffney D, et al. Insight into the nature of the CRP-coronary event association using Mendelian randomization. Int J Epidemiol 2006; 35: 922-931.
3. Ford ES, Mokdad AH, Liu S. Healthy Eating Index and C-reactive protein concentration: findings from the National Health and Nutrition Examination Survey III, 1988-1994. Eur J Clin Nutr 2005; 59: 278-283.
4. Imhof A, Woodward M, Doering A, Helbecque N, Loewel H, Amouyel P, et al. Overall alcohol intake, beer, wine, and
sults from three MONICA samples (Augsburg, Glasgow, Lille). Eur Heart J 2004; 25: 2092-2100.
5. Bazzano LA, He J, Muntner P, Vupputuri S, Whelton PK. Relationship between cigarette smoking and novel risk fac-tors for cardiovascular disease in the United States. Ann Intern Med 2003; 138: 891-897.
8. Empana JP, Sykes DH, Luc G, Juhan-Vague I, Arveiler D, Ferrieres J, et al. Contributions of depressive mood and circulating inflammatory markers to coronary heart disease in healthy European men: the Prospective Epidemiological Study of Myocardial Infarction (PRIME). Circulation 2005; 111: 2299-2305.
9. Victora CG, Barros FC. Cohort profile: the 1982 Pelotas (Brazil) birth cohort study. Int J Epidemiol 2006; 35: 237-242.
10. Block G, Cliford C, Naughlton MD, Henderson M, McAdams M. A brief dietary screen for high fat intake. J Nutr Educ 1989; 21: 199-207.
11. WHO. Physical status: the use and interpretation of anthro-pometry. Report of a WHO Expert Committee. World Health Organ Tech Rep Ser 1995; 854: 1-452.
12. WHO. Obesity: Preventing and managing the global epi-demic report on a WHO Consultation Technical Report Se-ries, No 894. Geneve: World Health Organization; 2000. 13. Ford ES, Giles WH, Mokdad AH, Myers GL. Distribution and
correlates of C-reactive protein concentrations among adult US women. Clin Chem 2004; 50: 574-581.
14. Ford ES, Giles WH, Myers GL, Mannino DM. Population distribution of high-sensitivity C-reactive protein among US men: findings from National Health and Nutrition Examina-tion Survey 1999-2000. Clin Chem 2003; 49: 686-690. 15. Williams MJ, Williams SM, Milne BJ, Hancox RJ, Poulton R.
Association between C-reactive protein, metabolic cardio-vascular risk factors, obesity and oral contraceptive use in young adults. Int J Obes Relat Metab Disord 2004; 28: 998-1003.
16. Ishikawa S, Kayaba K, Gotoh T, Nakamura Y, Kajii E. Metabolic syndrome and C-reactive protein in the general population: JMS Cohort Study. Circ J 2007; 71: 26-31. 17. Yamada S, Gotoh T, Nakashima Y, Kayaba K, Ishikawa S,
Nago N, et al. Distribution of serum C-reactive protein and its association with atherosclerotic risk factors in a Japa-nese population: Jichi Medical School Cohort Study. Am J Epidemiol 2001; 153: 1183-1190.
18. Khera A, McGuire DK, Murphy SA, Stanek HG, Das SR, Vongpatanasin W, et al. Race and gender differences in C-reactive protein levels. J Am Coll Cardiol 2005; 46: 464-469. 19. Lakoski SG, Cushman M, Criqui M, Rundek T, Blumenthal RS, D’Agostino RB Jr, et al. Gender and C-reactive protein: data from the Multiethnic Study of Atherosclerosis (MESA) cohort. Am Heart J 2006; 152: 593-598.
20. Imhof A, Frohlich M, Loewel H, Helbecque N, Woodward M, Amouyel P, et al. Distributions of C-reactive protein meas-ured by high-sensitivity assays in apparently healthy men and women from different populations in Europe. Clin Chem 2003; 49: 669-672.
21. Pearson TA, Mensah GA, Alexander RW, Anderson JL, Cannon RO III, Criqui M, et al. Markers of inflammation and cardiovascular disease: application to clinical and public health practice: A statement for healthcare professionals from the Centers for Disease Control and Prevention and the American Heart Association. Circulation 2003; 107: 499-511.
22. Alley DE, Seeman TE, Ki Kim J, Karlamangla A, Hu P, Crimmins EM. Socioeconomic status and C-reactive protein levels in the US population: NHANES IV. Brain Behav Immun 2006; 20: 498-504.
23. Onat A, Sansoy V, Yildirim B, Keles I, Uysal O, Hergenc G. C-reactive protein and coronary heart disease in western Turkey. Am J Cardiol 2001; 88: 601-607.
24. Nazmi A, Victora CG. Socioeconomic and racial/ethnic dif-ferentials of C-reactive protein levels: a systematic review of population-based studies. BMC Public Health 2007; 7: 212.
25. Travassos C, Williams DR. The concept and measurement of race and their relationship to public health: a review focused on Brazil and the United States. Cad Saúde Pública 2004; 20: 660-678.
26. Lessa I, Araujo MJ, Magalhães L, Almeida FN, Aquino E, Costa MC. Clustering of modifiable cardiovascular risk fac-tors in adults living in Salvador (BA), Brazil. Rev Panam Salud Publica 2004; 16: 131-137.
27. Mondini L, Monteiro CA. Relevance of under and overnutri-tion in different social classes: methods and applicaovernutri-tion to the Brazilian population. Rev Bras Epidemiol 1998; 1: 28-39.
28. Monteiro CA, Conde WL, Popkin BM. Independent effects of income and education on the risk of obesity in the Brazil-ian adult population. J Nutr 2001; 131: 881S-886S. 29. Yudkin JS, Stehouwer CD, Emeis JJ, Coppack SW.
C-reactive protein in healthy subjects: associations with obe-sity, insulin resistance, and endothelial dysfunction: a po-tential role for cytokines originating from adipose tissue? Arterioscler Thromb Vasc Biol 1999; 19: 972-978.
30. Frohlich M, Sund M, Lowel H, Imhof A, Hoffmeister A, Koenig W. Independent association of various smoking characteristics with markers of systemic inflammation in men. Results from a representative sample of the general population (MONICA Augsburg Survey 1994/95). Eur Heart J 2003; 24: 1365-1372.
31. Bo S, Gentile L, Ciccone G, Baldi C, Benini L, Dusio F, et al. The metabolic syndrome and high C-reactive protein: preva-lence and differences by sex in a southern-European popu-lation-based cohort. Diabetes Metab Res Rev 2005; 21: 515-524.
32. Raitakari M, Mansikkaniemi K, Marniemi J, Viikari JS, Raitakari OT. Distribution and determinants of serum high-sensitive C-reactive protein in a population of young adults: The Cardiovascular Risk in Young Finns Study. J Intern Med 2005; 258: 428-434.
33. Perkins KA, Donny E, Caggiula AR. Sex differences in nicotine effects and self-administration: review of human and animal evidence. Nicotine Tob Res 1999; 1: 301-315. 34. Jiang R, Jacobs DR Jr, Mayer-Davis E, Szklo M, Herrington
D, Jenny NS, et al. Nut and seed consumption and inflam-matory markers in the multi-ethnic study of atherosclerosis. Am J Epidemiol 2006; 163: 222-231.
35. Lopez-Garcia E, Schulze MB, Fung TT, Meigs JB, Rifai N, Manson JE, et al. Major dietary patterns are related to plasma concentrations of markers of inflammation and en-dothelial dysfunction. Am J Clin Nutr 2004; 80: 1029-1035. 36. Gibney MJ, Walsh M, Brennan L, Roche HM, German B,
van Ommen B. Metabolomics in human nutrition: opportuni-ties and challenges. Am J Clin Nutr 2005; 82: 497-503. 37. Imhof A, Froehlich M, Brenner H, Boeing H, Pepys MB,
Koenig W. Effect of alcohol consumption on systemic mark-ers of inflammation. Lancet 2001; 357: 763-767.
alcohol consumption and C-reactive protein levels in the adult US population. J Am Board Fam Pract 2002; 15: 437-442.
39. Marmot M, Brunner E. Alcohol and cardiovascular disease:
the status of the U shaped curve. BMJ 1991; 303: 565-568. 40. Black PH, Garbutt LD. Stress, inflammation and