1Article based on the master’s thesis of N KLIEMANN intitled “Análise das porções e medidas caseiras em rótulos de alimentos industrializados ultraprocessados”. Universidade Federal de Santa Catarina; 2012.
2Universidade Federal de Santa Catarina, Departamento de Nutrição, Programa de Pós-Graduação em Nutrição. Campus
Universitário, Trindade, 88040-900, Florianópolis, SC, Brasil. Correspondência para/Correspondence to: RPC PROENÇA. E-mail: <[email protected]>.
Support: Coordenação de Aperfeiçoamento de Pessoal de Nível Superior.
Reference serving sizes for the Brazilian
population: An analysis of processed
food labels
1Porção de referência para a população brasileira
:
uma análise considerando rótulos de
alimentos industrializados
Nathalie KLIEMANN2
Marcela Boro VEIROS2
David Alejandro GONZÁLEZ-CHICA2
Rossana Pacheco da Costa PROENÇA2
A B S T R A C T
Objective
To compare serving sizes reported on processed food labels with reference serving sizes according to nutrition labeling legislation and the “Food Guide for the Brazilian Population”.
Methods
This cross-sectional study analyzed the labels of 2,072 processed foods in a supermarket of Florianópolis, Santa Caratina, Brazil. The foods were classified according to the Brazilian food labeling legislation. Central tendency and variability values were calculated for the serving sizes and energy values reported on the labels, as well as the ratio between the reported and reference energy value. The Spearman correlation test was performed between the reference serving size and the reference energy density, and also between the reference serving size and energy density of each study food.
Results
serving sizes presented a highly inverse correlation with the reference energy density (Spearman coefficient= 0.9) and a very low inverse correlation with the energy density of the foods analyzed (Spearman coefficient= 0.2).
Conclusion
This study showed the need for standardizing reference serving size information for the Brazilian population as well as reviewing nutrition labeling legislation in order to standardize the serving sizes reported on labels and to update the reference energy density used to calculate serving sizes.
Indexing terms: Food nutrition education. Food labeling. Industrialized foods. Nutrition policy. Nutritional facts.
R E S U M O
Objetivo
Comparar as porções declaradas nos rótulos de alimentos industrializados com as porções de referência da legislação de rotulagem nutricional e do “Guia Alimentar para a População Brasileira”.
Métodos
Estudo transversal que analisou os rótulos de 2.072 alimentos industrializados em um supermercado de Florianópolis, Santa Catarina. Os alimentos foram classificados de acordo com a legislação brasileira de rotulagem nutricional. Foram calculados valores de tendência central e de variabilidade para porção e valor energético declarados nos rótulos, além da razão entre o valor energético declarado e de referência. Teste de Correlação de Spearman foi realizado entre porção e densidade energética de referência e entre porção de referência e densidade energética de cada alimento analisado.
Resultados
A rotulagem nutricional e o Guia Alimentar apresentaram porções de referência com tamanhos e valores energéticos diferentes. As porções declaradas nos rótulos não seguiram nenhuma das referências e apresentaram valores heterogêneos, com amplitude máxima de 55-420 g entre pratos preparados prontos e semiprontos. Os valores energéticos declarados foram de 0,1 vez menor a 2,4 vezes maiores do que os valores de referência. As porções de referência da rotulagem apresentaram correlação inversa alta com a densidade energética de referência (Coeficiente de Spearman=-0,9), e muito baixa com a densidade energética dos alimentos analisados (Coeficiente de Spearman=-0,2).
Conclusão
Evidenciou-se a necessidade de padronização das informações sobre porção de referência para a população brasileira, assim como de fiscalização e revisão da legislação de rotulagem nutricional a fim de uniformizar as porções declaradas nos rótulos e atualizar a densidade energética de referência usada para o cálculo das porções.
Termos de indexação:Educação alimentar nutricional. Rotulagem de alimentos. Alimentos industrializados.
Política nutricional. Informação nutricional.
I N T R O D U C T I O N
Obesity is currently considered a major public health problem and affects large parts of the world1. The main causes of obesity include
changes in dietary and physical activity patterns, especially an increase in the consumption of processed foods as well as the size of the portions consumed2-5.
Studies have indicated that obesity and various other chronic diseases can be prevented through public policies and actions in the food environment1,6. A healthy environment should
promote and facilitate healthier food and serving size choices2-5.. Examples of population-based
(WHO) in the 2004 “Global Strategy on Diet, Physical Activity and Health”3. The WHO has kept
this recommendation in its “Global Action Plan for the Prevention and Control of Non-communicable Diseases 2013-2020”7.
In Brazil, nutrition labeling and the “Food Guide for the Brazilian Population” have emerged with the aim of promoting healthy food choices and appropriate serving sizes. The Brazilian nutrition labeling legislation8,9 has been drafted
and harmonized with other Mercosul countries10,11
and reference food serving sizes have been defined to be reported on food labels. Along the same lines, the “Food Guide for the Brazilian Population” also defines reference serving sizes for the public in order to guide people in making healthier food choices12.
In both policies, the reference serving sizes are defined based on a diet of 2,000 kcal. In this way, food groups have been defined and the number of servings per day and the reference energy value of each serving have been set for each group8,12. In addition, serving sizes in grams
or millimeters (g or mL) have been defined for most foods8,12. However, the nutrition labeling
legislation allows the serving sizes reported on labels to be up to 30% larger or smaller than the reference serving size8-9.
Studies have suggested that the lack of serving size standardization on food labels among similar kinds of food products can complicate comparison and, as a result, food choices2,13-14.
Furthermore, according to Monteiro & Cannon15,
an increase has been observed in the production and consumption of high-energy ultra-processed foods in Brazil as well as a trend towards reformulating these foods in order to reduce their sodium, trans fat, and energy content so that they can be advertised as healthy. However, considering the change in the energy standards of processed foods15, it is assumed that the
reference serving sizes (g or mL), when reported on nutrition labels of the processed foods currently available on the Brazilian market, may not match the reference energy values. Furthermore, it is
suggested that such issues can compromise the use of this information as a reference for consumption by the public.
Thus, in light of the importance of coherent educational strategies to control the serving sizes consumed by the population2, this
study analyzed the compliance (in grams/ millimeters and energy value) of the servings reported on processed food labels with the reference serving sizes according to Brazilian nutrition labeling legislation and the “Food Guide for the Brazilian Population”.
M E T H O D S
This was a descriptive and analytical cross-sectional study. The data was collected in a large supermarket in Florianópolis (SC), Brazil. The selection of the study’s location was intentional. We chose a supermarket that sells a national range of processed foods and belongs to one of the ten largest supermarket chains in Brazil, according to a survey by the Brazilian Supermarket Association in 201316. To participate in the study,
the free and clear consent of the supermarket managers was obtained.
The sample consisted of 2,072 processed foods that were available for sale during the data collection period and that met the selection criteria explained below.
The inclusion criteria were all the processed foods included in the food list created by Silveira17 classified as processed or
ultra-processed15. Processed foods are considered to
because it includes foods that are forming a growing part of the Brazilian diet18-20.
Exclusion criteria: all concentrated, powdered, dehydrated and/or mixed foods that require reconstitution by adding other ingredients. Processed foods in which the reference serving size according to the Brazilian legislation8 was
defined based on household measurements or according to the food’s nutritional profile. Bakery products prepared and packaged by the supermarket itself, as the nutrition labeling of products sold without packaging or with protective packaging is not mandatory.
Data collection was done by dietitians and trained nutrition students during two consecutive weeks in August 2011. The instrument used for data collection had been previously tested in a pilot study. The instrument included the following information: type of processed food, flavor, total weight (g or mL), brand, origin (location where the food was produced), serving size (g or mL), household measurement and energy value per serving. Magnifying glasses were available during the data collection to better view the nutritional information and plastic gloves were provided to handle chilled and/or frozen processed foods.
Variations of the same processed food available in packages of different sizes were recorded as new products, as not all of them had identical serving sizes.
Information was collected on reference serving size in energy value and in grams or milliliters according to Brazilian nutritional labeling legislation8 and the “Food Guide for the Brazilian
Population”12.
The collected data were entered into two separate databases and were subsequently checked for errors and validated in EpiData®
version 3.1.
The processed foods analyzed were divided into six groups and 38 subgroups with the same reference serving size, according to Resolução da Diretoria Colegiada (RDC) nº 359/ 20038.
Group A:Composed of bakery products, cereals, legumes, roots, tubers, and their derivatives, including the following subgroups: dry pasta (instant noodles); fresh pasta (with or without filling); fresh dough for pastries and wraps; pizza dough; chilled or frozen dough without filling (e.g. cheese bread); salty crackers with or without filling; pre-fried and/or frozen tubers and cereals (e.g. fried potatoes, polenta and cassava); breakfast cereals 1 (≤45 g per cup); breakfast cereals 2 (>45 g per cup); cereal- and flour-based snacks (e.g. potato chips, potato sticks, shoestring potatoes and ice cream cones); ready-made flour; packaged processed breads; toast; popcorn; chilled and frozen foods with filling; and cakes and similar products with or without filling.
Group B: Composed of milk and dairy products, including the following subgroups: dairy drinks, yogurt and fermented milk; cottage, nonfat ricotta, minas, nonfat soft and petit-Suisse cheese; grated cheese; ricotta, semi-hard, white, soft and cream cheese; and dairy desserts.
Group C:Composed of meats and eggs, including the following subgroups: meatballs and hamburger; patés; and meat pastries.
Group D: Composed of oils, fats and oilseeds, including the following subgroups: oilseeds (sweet and salty) and whipped cream.
Group E:Composed of sugars and products that provide energy from carbohydrates and fats, including the following subgroups: chocolates and similar sweets; chocolate confections (e.g. granulated chocolate); soft and peanut sweets (e.g. creamy sweets); sweet preparation mixtures, cake and pie frosting and ice cream syrup; cookies with or without filling; mass or individual ice creams (e.g. ice cream bars and popsickles); and candies, lollipops and lozenges.
In the descriptive analysis of the data, we initially compared the reference serving sizes of the nutrition labeling legislation8 with those of
the “Food Guide for the Brazilian Population”12.
In addition, we calculated the median and range of the serving sizes reported on the labels by food subgroup in order to assess the variability of their sizes. In each food subgroup, we also calculated the median and interquartile range for the reported energy values per serving.
Considering that both Brazilian nutrition labeling legislation8 and the “Food Guide for the
Brazilian Population”12 have reference energy
values per serving for each food group, we calculated the ratio between the energy value reported on the labels and the reference values for each subgroup. Thus, it was possible to assess the agreement between these two parameters (reported energy value and reference values).
The non-parametric Spearman correlation test was performed between reference serving size and energy density, both per 100 g of each food analyzed and per 100 g of the reference value in the nutrition labeling legislation. This analysis made comparison possible between the theoretical energy density used by the legislation to calculate serving size and the energy density of the foods analyzed in this study. This study included only products with serving sizes defined by law in grams or milliliters.
To analyze the serving sizes (g or mL) reported on labels in relation to the reference values, the foods were classified into five groups. This classification was done according to the
reference serving size under Brazilian law, following the criteria presented in Table 1. However, we have not included the foods in Group F because these foods do not have a reference serving size in grams or milliliters.
R E S U L T S
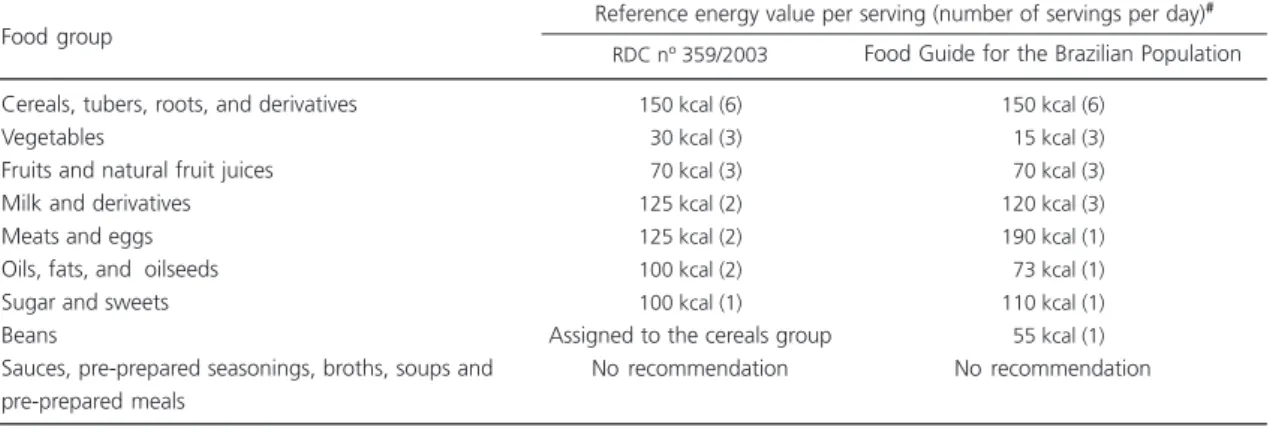
Information was collected from the nutrition labels on 2,072 processed foods. In the comparative analysis between the reference serving sizes under Brazilian law and those of the “Food Guide for the Brazilian Population”, we observed that although both use a 2,000 kcal diet as a basis, there were differences between these documents. There were disagreements in the classification of foods into groups as well as in the energy value of the serving sizes, as can be seen in Table 2. Agreement was observed only in the serving sizes of the ‘cereals, tubers, roots and derivatives’ and ‘fruits and natural fruit juices’ groups. Beans were considered to be a separate group only in the “Food Guide for the Brazilian Population”12, as the nutrition labeling legislation8
included beans in the cereals group. Reference value for ready- and semi-ready-to-consume dishes were not defined in either of the two documents analyzed8,12.
In regard to serving sizes in grams or milliliters, we found that the Food Guide12 defined
serving sizes by food type and not by food group, as the nutrition labeling legislation did8. For
example, cakes with different flavors had different serving sizes in the Food Guide - e.g. the serving
Table 1. Classification of serving sizes (g or mL) reported on labels in relation to reference serving sizes under Brazilian food labeling law.
<70% 70-99% 100% 101-130% >130%
Serving size smaller than 70% of recommended serving size (g or mL) Serving size up to 30% smaller than recommended serving size (g or mL) Serving size equal to recommended serving size (g or mL)
Serving size up to 30% larger than recommended serving size (g or mL) Serving size larger than 130% of the recommended serving size (g or mL)
Inadequate Adequate Adequate Adequate Inadequate
Note:1Classification of serving size in g or mL reported on the label in relation to the legislated reference serving size. 2Resolução da Diretoria
Colegiada nº 359/20038.
size was 30 g for carrot cake and 50 g for banana cake. However, under the nutrition labeling legislation, all cake types and flavors had the same reference serving size (60 g).
Table 3 shows the variability of serving size and energetic value per serving reported on the food labels analyzed. It also presents the ratios between the reported energy values and the reference values. The serving size analysis found that the median serving sizes of 28 subgroups (83.3%) were equal to the legislated reference values. However, serving size standardization (in which all food products have declared serving sizes equal to those recommended by law) was found in only six food subgroups (17.6%), five of which (14.7%) belong to Group A. The 28 remaining subgroups varied in reported serving sizes, with a minimum range of 21-30 g among salty crackers and a maximum range of 55-420 g among ready- and semi-ready-to-consume dishes. The greatest variations were found in the following subgroups: ready- and semi-ready-to-consume dishes; meatballs and hamburgers; meat preparations with flour and bread; and dairy drinks, yogurt and fermented milk.
Regarding energy value per serving, we observed that five food subgroups had median values (r=1.0) that agreed with the reference values defined by the legislation8 and/or the Food
Guide for the Brazilian Population12. However,
only three of these subgroups (r=1.0) agreed with both references. Table 3 also shows that the reported energy value per serving was less than the reference value (r<1.0) in the legislation8 and
Food Guide12 in 58% and 62% of the assessed
subgroups, respectively. It should be noted that the patés and grated cheese subgroups had reported energy values that were 0.1 and 0.4 times smaller than the reference values, respectively. Reported energy value per serving was greater than the reference value (r>1.0) in 28% and 22% of the subgroups in relation to the legislation8 and the Food Guide12, respectively.
The fresh pasta and dry pasta groups stand out as their reported energy values were 1.8 and 2.4 times greater than the reference values, respectively.
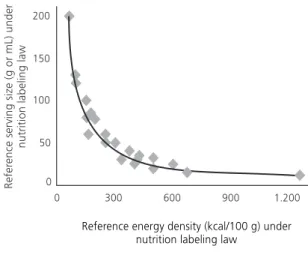
A high inverse correlation was found between the reference energy density (per 100 g) and the reference serving size established under Brazilian nutrition labeling legislation, as shown in Figure 1.
However, a low inverse correlation was found between legislated reference serving size and energy density (per 100 g) of the foods analyzed, as shown in Figure 2. In Figure 2, it can be seen that above the curve, there are processed foods that have large serving sizes defined by law,
Table 2. Comparison between reference serving sizes, in energy value, under Brazilian nutritional labeling law and according to the
“Food Guide for the Brazilian Population”.
Cereals, tubers, roots, and derivatives Vegetables
Fruits and natural fruit juices Milk and derivatives Meats and eggs Oils, fats, and oilseeds Sugar and sweets Beans
Sauces, pre-prepared seasonings, broths, soups and pre-prepared meals
Food group
150 kcal (6)
030 kcal (3)
070 kcal (3) 125 kcal (2) 125 kcal (2) 100 kcal (2) 100 kcal (1) Assigned to the cereals group
No recommendation RDC nº 359/2003
150 kcal (6)
015 kcal (3)
070 kcal (3) 120 kcal (3) 190 kcal (1)
073 kcal (1) 110 kcal (1)
055 kcal (1) No recommendation Food Guide for the Brazilian Population Reference energy value per serving (number of servings per day)#
Note:#Based on a diet of 2,000 kcal.
Table 3. Description of serving size (g or mL) and energy value per serving reported on labels and the ratio between reported energy values and the reference values under Brazilian law and according to the “Food Guide for the Brazilian Population”. Florianópolis
(SC), Brazil, 2011.
Dry pasta
Fresh pasta with or without filling Fresh dough for pastries and wraps Pizza dough
Chilled or frozen without filling Crackers
Pre-fried and/or frozen tubers and cereals
Breakfast cereals 1 (≤45 g per cup) Breakfast cereals 2 (>45 g per cup) Cereal- and flour-based snacks Pre-prepared flour
Packaged bread, sliced and unsliced Toast
Popcorn
Chilled or frozen with filling Cakes and similar foods
Dairy drinks†, yogurt and fermented milk†
Cheese: cottage, ricotta, non-fat, minas, non-fat soft, and petit-Suisse
Grated cheese
Cheese: ricotta, semi-hard, white, soft, cream cheese
Dairy desserts
Meatballs and hamburger patty
Patês
Breaded meat preparations Oilseeds
Whipped cream
Chocolates and similar products Chocolate confections Dough and peanut sweets
Frosting and syrup for cakes, pies, and ice cream
Cookies with or without filling Soft and individual ice creams Candies, lollipops and lozenges Ready and semi-ready prepared dishes
67 48 23 10 7 92 11 22 39 107 6 101 26 31 12 55 186 45 16 184 20 25 24 49 31 5 159 23 26 15 275 157 60 115 80 100 30 40 50 30 85 30 40 25 35 50 30 25 40 60 200 50 10 30 120 80 10 130 15 20 25 25 20 20 30 60 20 -85 100 30 40 50 30 85 30 40 25 35 50 30 25 45 60 180 40 10 30 105 80 10 130 15 20 25 25 20 20 30 60 20 145 (30.0;109.0) (50.0; 160.0) (30.0; 60.0) (25.5; 40.0) (-) (21.0; 30.0) (70.0; 100.0) (20.0; 30.0) (-) (10.0; 40.0) (-) (40.0; 75.0) (-) (-) (30.0; 120.0) (30.0; 60.0) (75.0; 300.0) (30.0; 60.0) (10.0; 30.0) (20.0; 120.0) (40.0; 200.0) (56.0; 420.0) (10.0; 100.0) (30.0; 275.0) (15.0; 25.0) (7.0; 20.0) (10.4; 41.0) (10.0; 25.0) (15.0; 40.0) (-) (14.0; 100.0) (40.0; 90.0) (2.0; 20.0) (55; 420) 364 275 90 113 145 124 123 110 158 127 142.5 122 112 98 134.5 219 112.5 64 46 99,5 128 149 24.5 245 87 59 133 97 104.5 56 143 114 79 335 (271; 392) (241; 293) (86; 95) (112; 117) (139; 152) (111; 135) (106; 155) (109; 113) (138; 163) (116; 141) (134; 150) (115; 138) (105; 119) (94; 102) (121; 204) (161; 247) (63; 157) (50; 80) (42.5; 100) (80,5; 110) (101; 152) (101; 178) (19; 220) (165; 305) (75; 92) (50; 60) (123; 138) (40; 117) (95; 115) (56; 63) (131; 152) (103; 135) (75; 80) (175; 401) 2.4 1.8 0.6 0.8 1.0 0.8 0.8 0.7 1.1 0.8 1.0 0.8 0.7 0.7 0.9 1.5 0.9 0.5 0.4 0.8 1.0 1.2 0.2 2.0 0.9 0.6 1.3 1.0 1.0 0.6 1.4 1.1 0.8 * 2.4 1.8 0.6 0.8 1.0 0.8 0.8 0.7 1.1 0.8 1.0 0.8 0.7 0.7 0.9 1.5 0.9 0.5 0.4 0.8 1.1 0.8 0.1 * 1.2 0.8 1.2 0.9 1.0 0.5 1.0 1.0 0.7 *
Group Food subgroup n
Reference serv. size (g or mL)
Median Range Median IQR Law1 FGBP
Ratio between median energy value and reference values Reported energy value
per serving (kcal) Reported serv. size
(g ou mL)
B C D E A F
Note: †Serving size in mL. 1Resolução da Diretoria Colegiada nº 359/20038. Dietary Guide for the Brazilian Population12. *There is no reference
value. Group A: Bread products, cereals, legumes, roots, tubers and their derivatives. Group B: Milk and derivatives. Group C: Meats and eggs. Group D: Oils, fats and oilseeds. Group E: Sugars and products that provide energy from carbohydrates and fats.
yet present high energy density. It can also be observed that, if all the foods reported the reference serving size, their energy value would not be the same as that established by law. This data indicates that the energy density of the analyzed foods is different from the theoretical energy density that was used to calculate serving sizes for nutrition labeling legislation.
In analyzing the compliance of reported serving sizes with the law, it was found that 72.4% (Confidence Interval of 95% -95%CI=70.3; 74.3) of the foods had serving sizes equal to the reference value. Among the foods that did not exactly match the reference serving size, 10.1% (95%CI=8.7; 11.5) and 3.9% (95%CI=3.0; 4.8) still complied with the law, as they were 70-99% and 101-130% in agreement, respectively. The remaining foods did not comply with the law, as 9.3% (95%CI=8.0; 10.6) had serving sizes that were too small and 4.1% (95%CI=3.2; 5.0) had serving sizes that were too large.
D I S C U S S I O N
This study’s results show that the reference serving sizes under the Brazilian nutrition labeling
legislation8 and the “Food Guide for the Brazilian
Population”12 are different for some food groups
while the serving sizes reported on labels do not generally follow either of these references. Reported serving sizes were also heterogeneous even among foods of the same group.
We point out that there are currently two official documents that provide different reference serving sizes for the Brazilian population, even though both are based on a 2,000 kcal diet8,12.
The disagreement between the serving sizes defined by these two public policies is also found in other countries such as the United States and Canada. In these countries, this difference is justified by the different purposes of the policies, as serving sizes on labels represent the amount of the food that is typically consumed while serving sizes in the Food Guides are recommended amounts2,12,21. However, this justification is not
applicable in Brazil since both documents have the same goal of promoting the selection of healthy foods in appropriate amounts.
Furthermore, research has shown that the disagreement between the serving size on nutritional labels and that of the Food Guide can cause confusion22 or lead consumers to
underestimate serving sizes23,24. In addition,
Figure 1. Relation between reference serving size (g or mL) and
reference energy density (kcal/100 g) established by Brazilian nutrition labeling law. Florianópolis (SC), Brazil, 2011.
Note: Spearman correlation; Coefficient=-0.9; N=1,957.
Figure 2. Relation between reference serving size (g or mL) under
Brazilian nutrition labeling law and energy density (kcal/100 g) of the processed foods analyzed.
Florianópolis (SC), Brazil, 2011.
several studies analyzed by Abramovitch et al.25
have shown that merely publishing reference serving sizes in food guides does not seem to be sufficient to educate the public about consuming food in appropriate amounts, and that other educational strategies are necessary. In this sense, the authors understand that agreement between these two documents could facilitate nutrition education programs for the public26,27.
The present study also found that the serving sizes reported on the labels did not conform with the reference serving sizes in grams or milliliters, nor with the reference energy values8,12. Variation was observed in reported
serving sizes among foods of the same group and the greatest range was found in the ready and semi-ready pre-prepared dishes group. This group is also the one that does not have a reference serving size in Brazil - neither in the labeling legislation8 nor in the Food Guide12.
According to a study conducted in Ireland, food guides rarely define reference serving sizes for the public for foods with high energy values, such as ready-to-consume dishes. This is due to the fact that such foods do not belong in a healthy diet. In these cases, there are merely warnings that such foods should be consumed sporadically or in small portions22. Even so, the terms
‘sporadically’ and ‘small portions’ may have no practical significance, as their interpretation is subjective. Furthermore, high consumption of these foods by Brazilians20 has been linked to
rising rates of chronic diseases15,28. Therefore, it
is suggested that defining reference serving sizes for these foods can be a means of promoting nutrition education and improving the quality of information for consumers.
The lack of standardization in the reporting of serving size in nutrition labeling was also reported in a Brazilian study that analyzed 142 labels for yogurt, dairy drinks and fermented milk sold in the state of Minas Gerais and found a range of serving sizes from 100 to 200 g (the legislated reference serving size is 200 g)29. The
variability of the foods analyzed in the present
study was even greater, reaching a range of 75 to 300 g. It is suggested that such a difference could result from a difference in sample size, as the present study used a sample that was 31% larger than that of the Grandi & Rossi study29.
Similar results have also been found in studies conducted in other countries where nutrition label information is also presented per serving. In Australia, for example, 1,070 processed foods were analyzed and serving sizes for snacks ranged from 18 g to 100 g, demonstrating a lack of uniformity13. In the United States, research has
indicated that the serving sizes reported on labels can vary from 50% to 200% of the reference values defined by the Food and Drug Administration (FDA)30,31. According to the
scientific literature, a lack of serving size standardization can compromise the comparability of processed foods and thus food choices, if this is the only information reported on nutrition labels13,22,29,32.
Furthermore, even though Brazilian law allows a variability of 30.0% more or 30.0% less than the reference value when reporting serving sizes, the present study found that 13.4% of the foods analyzed did not comply and exceeded the permitted range, which already seems quite wide. Other studies conducted in Brazil have also found high nonconformity of food labels with the Brazilian law33-36. These studies have identified the
greatest irregularities on food labels to be those referring to nutrition information33-36. Such studies
reinforce the recommendation to better regulate the nutrition information provided on food labels.
In addition to the lack of serving size uniformity, low conformity has also been observed in the reported energy value per serving compared to the legislated reference value. This agrees with the findings of Piernas & Popkin5, who elucidated
changes in the energy density of American processed foods in 1977-1978 and 2002-2003, mainly among salty snacks, processed fruit juices, French fries, hamburgers, and pizza.
Brazilian law, so that they reflect on food labels the energy recommendations per serving established by the same legislation. Furthermore, the definition of reference serving sizes per subgroup can explain this result, as foods with different flavors can have different energy densities. For example, the Food Guide defines different serving sizes for foods with different flavors that belong to the same group. In the case of corn bread and rye bread, for instance, the serving size is 70 g for the former and 60 g for the latter12. Therefore, it is suggested that the
nutrition labeling legislation’s classification of foods into subgroups also be assessed so that the reference serving sizes reflect reference energy values on food labels. Ferreira & Lanfer-Marquez37
emphasize the importance of updating Brazilian nutrition labeling regulations to incorporate new knowledge and fill in existing gaps in order to strengthen these policies as a strategy for reducing obesity rates.
Despite a lack of studies evaluating the effects of defining reference serving sizes for the population, Faulkner et al.22 point out that it is
important that reference serving sizes be established and effectively disclosed to consumers. Researchers also point to the need for establishing more realistic serving sizes than the public currently customarily consumes2,22. It
is noteworthy that the scientific community considers reference serving sizes and their respective household measurements to be essential to understanding the applicability of nutrition labeling22,38. However, studies also
emphasize that it is vital to equip the Brazilian consumer to know how to interpret nutrition labels. Thus, such information can potentially play an educational role and facilitate food choices39,40.
Finally, it is recommended that nutrition information per 100 g be included together with serving size information. According to some authors, the inclusion of such information could facilitate consumer analysis of nutrient quantities present in foods as well as comparisons between foods41,42.
Limitations of this study include using only information from labels and not performing physical or chemical analyses on the foods or even weighing them. Even so, we analyzed the information that is available to consumers on labels, which is the only information that is currently available to guide their food choices at the time of purchase. Therefore, considering the rights of the consumer and the goals of labeling as a public health policy, the reliability of this information should be guaranteed by manufacturers and be subject to oversight to ensure compliance with the law. Another of this study’s potential limitations was the inclusion of processed foods from a single supermarket. However, this store is part of a large supermarket chain and many of the processed foods analyzed are sold throughout the country.
C O N C L U S I O N
This study showed a lack of standardization in reference serving size information for Brazilian consumers. There are differences between the serving sizes established by the “Food Guide for the Brazilian Population and Brazilian” nutrition labeling legislation and those reported on processed food labels. In addition, we observed that not all foods reported the legislated reference serving sizes, demonstrating serving size variability on labels. Finally, we point out that the energy density used to calculate reference serving sizes in the legislation is different from that found on the food labels we analyzed.
Finally, we emphasize the importance of standardizing reference serving size information in the “Food Guide for the Brazilian Population”, Brazilian nutrition labeling legislation and on food labels. Such standardization aims to facilitate access to information on reference serving sizes by consumers and the use of this information in public nutrition education programs. Therefore, we suggest reviewing the permitted variation in serving sizes reported on labels, which currently can range from 30% less to 30% more than the reference serving size. The data reported here indicate that this range may be too wide, virtually precluding the possibility of comparing similar foods.
Finally, we found that 13% of the foods analyzed reported serving sizes that did not comply with the legislation despite the wide variability permitted. This seems to point to the need to carefully monitor the information reported on the labels of food products sold in Brazil.
C O N T R I B U T O R S
N KLIEMANN helped to conceive, design, and implement the study, analyze and interpret the data, and write the manuscript. DA GONZALEZ-CHICA helped to analyze the data statistically and interpret and discuss the results. MB VEIROS and RPC PROENÇA conceived, designed, coordinated, and supervised the study and the manuscript writing.
R E F E R E N C E S
1. World Health Organization. Obesity and overweight. Geneva: WHO; 2013 [cited 2013 Jul 4]. Available from: <http://www.who.int/mediacentre/factsheets/ fs311/en/>.
2. Young LR, Nestle M. Expanding portion size in the US marketplace: Implications for nutrition counseling. J Am Diet Assoc. 2003; 103(2):231-4. doi: 10.1053/jada.2003.50027.
3. World Health Organization. Global strategy on diet, physical activity and health. Geneva: WHO; 2004 [cited 2013 Jul 4]. Available from: <http://www.
who.int/dietphysicalactivity/strategy/eb11344/ strategy_english_web.pdf>.
4. Popkin BM. Global nutrition dynamics: The world is shifting rapidly toward a diet linked with noncommunicable diseases. A J Clin Nutr. 2006; 84(2):289-98.
5. Piernas C, Popkin B. Food portion patterns and trends among U.S. children and the relationship to total eating occasion size, 1977-2006. J Nutr. 2011; 141(6):1159-64. doi: 10.3945/jn.111.138727 6. Malik VS, Willett WC, Hu FB. Global obesity: Trends,
risk factors and policy implications. Nat Rev Endocrinol. 2013; 9(1):13-27. doi: 10.1038/ nrendo.2012.199
7. World Health Organization. Follow-up to the Political declaration of the high-level meeting of the general assembly on the prevention and control of non-communicable diseases. Geneva: WHO; 2013 [cited 2013 Jul 4]. Available from: <http:// apps.who.int/gb/ebwha/pdf_files/WHA66/A66_ R10-en.pdf>.
8. Brasil. Ministério da Saúde. Agência Nacional de Vigilância Sanitária. Resolução RDC nº 359, de 23 de dezembro de 2003: aprova regulamento técnico de porções de alimentos embalados para fins de rotulagem nutricional. Diário Oficial [da] República Federativa do Brasil. 2003; 26 dez.
9. Brasil. Ministério da Saúde. Agência Nacional de Vigilância Sanitária. Resolução RDC nº 360, de 23 de dezembro de 2003. Aprova regulamento técnico o sobre Rotulagem Nutricional de Alimentos Emba-lados, tornando obrigatória a rotulagem nutri-cional. Diário Oficial [da] República Federativa do Brasil. 2003; 26 dez.
10. Mercosul. Grupo Mercado Comum. Resolução nº 44/03, de 10 de dezembro de 2003. Aprova o regu-lamento técnico do Mercosul para rotulagem nutri-cional de alimentos embalados. LII GMC. Mon-tevidéu. 2003; 10 dez. 2003a.
11. Mercosul. Grupo Mercado Comum. Resolução nº 46/03, de 10 de dezembro de 2003. Aprova o regu-lamento técnico do Mercosul para rotulagem nutri-cional de alimentos embalados. LII GMC. Mon-tevidéu. 2003; 10 dez.
12. Brasil. Ministério da Saúde Guia alimentar para a população brasileira: promovendo a alimentação saudável. Brasília: Ministério da Saúde; 2005 [acesso 2013 jul 4]. Disponível em: <http://dtr2001.saude. gov.br/editora/produtos/livros/pdf/05_1109_M. pdf>.
14. Instituto Brasileiro de Defesa do Consumidor. Além da conta. Rev IDEC. 2009; 16-2.
15. Monteiro CA, Cannon G. The Impact of Transnational “Big Food” Companies on the South: A view from Brazil. PLoS Med. 2012; 9(7):1-5. doi: 10.1371/journal.pmed.1001252
16. Associação Brasileira de Supermercados. Ranking ABRAS 2013. Rev SuperHiper. 2013 [acesso em 2013 jul 23]; Disponível em: <http://www. abrasnet.com.br/clipping.php?area=20&clipping= 35850>.
17. Silveira BM. Informação alimentar e nutricional da gordura trans em rótulos de alimentos indus-trializados comercializados em um supermercado de Florianópolis [Dissertação]. Universidade Federal de Santa Catarina; 2011.
18. Instituto Brasileiro de Geografia e Estatística. Pesquisa de orçamentos familiares 2008-2009: aquisição alimentar domiciliar per capita. Rio de Janeiro: IBGE; 2010 [acesso 2011 mar 11]. Dispo-nível em: <http://www.ibge.gov.br/home/ estatistica/populacao/condicaodevida/pof/2008 _2009_aquisicao/pof20082009_aquisicao.pdf>. 19. Instituto Brasileiro de Geografia e Estatística.
Pesquisa de orçamentos familiares 2008-2009: despesas, rendimentos e condições de vida. Rio de Janeiro: IBGE; 2010 [acesso 2011 mar 11]. Dispo-nível em: <http://www.ibge.gov.br/home/ estatistica/populacao/condicaodevida/pof/ 2008_2009_aquisicao/pof20082009_aquisicao. pdf>.
20. Instituto Brasileiro de Geografia e Estatística. Pesquisa de orçamentos familiares 2008-2009: análise do consumo alimentar pessoal no Brasil. Rio de Janeiro: IBGE; 2011 [acesso 2012 jan]. Disponível em: <http://www.ibge.gov.br/home/ estatistica/populacao/condicaodevida/pof/2008_ 2009_analise_consumo/default.shtm>.
21. Sibbald B. Canada’s nutrition labels: A new world standard? CMAJ. 2003; 168(7):887.
22. Faulkner GP, Pourshahidi LK, Wallace JMW, Kerr MA, McCrorie TA, Livingstone MBE. Serving size guidance for consumers: Is it effective? Proc Nutr Soc. 2012; 71(4):610-21. doi: 10.1017/S002966 5112000766
23. Hogbin MB, Hess MA. Public confusion over food portions and servings. J Am Diet Assoc. 1999; 99(10):1209-11. doi: 10.1016/S0002-8223(99) 00297-7
24. Britten P, Haven J, Davis C. Consumer research for development of educational messages for the MyPyramid Food Guidance System. J Nutr Educ
Behav. 2006; 38(6):S108-S23. doi: 10.1016/j.jneb. 2006.08.006.PMID:17116589
25. Abramovitch SL, Reddigan JI, Hamadeh MJ, Jamnik VK, Rowan CP, Kuk JL. Underestimating a serving size may lead to increased food consumption when using Canada’s Food Guide. Appl Physiol Nutr Metab. 2012; 37(5):923-30. doi: 10.1139/H2012-0 71
26. Earl R, Porter DV, Wellman NS. Nutrition labeling: Issues and directions for the 1990s. J Am Diet Assoc. 1990; 90(11):1599-601.
27. Canadian Food Inspection Agency. Food labelling. Ottawa: Canadian Food Inspection Agency; 2013 [cited 2013 Mar 13]. Available from: <http://www. inspection.gc.ca/english/fssa/labeti/guide/ch6e. shtml#a6_1)>.
28. World Health Organization. Diet, nutrition and the prevention of chronic diseases. Geneva: WHO; 2003 [cited 2013 Jun 4]. Technical Report Series, nº 916. Available from: <http://whqlibdoc.who.int/ trs/who_trs_916.pdf>.
29. Grandi AZ, Rossi DA. Avaliação dos itens obrigatórios na rotulagem nutricional de produtos lácteos fermentados. Rev Inst Adolfo Lutz. 2010; 69(1):62-8.
30. United States Department of Agriculture. Serving sizes in the food guide pyramid and on the nutrition facts label: What’s different and why? Washington (DC): United States Department of Agriculture; 2000 [cited 2013 May 14]. Available from: <http:// www.cnpp.usda.gov/Publications/Nutrition Insights/Insight22.pdf>.
31. Usmanova N, Thor E. Comunicating nutritional information to the global consumer: Adapting to shifting consumer attitudes toward nutrition. Int Food Agrib Man Rev. 2003; 6(2):1-18.
32. Hawley KL, Roberto CA, Bragg MA, Liu PJ, Schwartz MB, Brownell KD. The science on front-of-package food labels. Public Health Nutr. 2012; 16(3):430-9. doi: 10.1017/S1368980012000754
33. Smith ACL, Almeida-Muradian LB. Rotulagem de alimentos: avaliação da conformidade frente à legislação e propostas para a sua melhoria. Rev Inst Adolfo Lutz. 2011; 70(4):463-72
34. Câmara MCC, Marinho CLC, Guilam MC, Braga AMCB. A produção acadêmica sobre a rotulagem de alimentos no Brasil. Rev Panam Salud Publica. 2008; 23(1):52-8. doi: 10.1590/S1020-498920080 00100007
Saúde Pública. 2009; 43(3):499-505. doi: 10.1590/ S0034-89102009005000020
36. Dias JR, Gonçalves ECBA. Avaliação do consumo e análise da rotulagem nutricional de alimentos com alto teor de ácidos graxos trans. Ciênc Tecnol Aliment. 2009; 29(1):177-82. doi: 10.1590/S010 1-20612009000100027
37. Ferreira AB, Lanfer-Marquez UM. Legislação brasi-leira referente à rotulagem nutricional de alimentos. Rev Nutr. 2007; 20(1):83-93. doi: 10.1590/S141 5-52732007000100009
38. Albert J. Global patterns and country experiences with the formulation and implementation of food-based dietary guidelines. Ann Nutr Metab. 2007; 51(Suppl 2):S2-S7. doi: 10.1159/000103560 39. Monteiro RA, Coutinho JG, Recine E. Consulta aos rótulos de alimentos e bebidas por freqüentadores
de supermercados em Brasília, Brasil. Rev Panam Salud Publ. 2005; 18(3):172-7.
40. Neves AM, Guimarães PIC, Mercon F. Interpretação de rótulos de alimentos no ensino de química. Quím Nova Esc. 2009; 31(1):34-9.
41. Garsetti M, de Vries J, Smith M, Amosse A, Rolf-Pedersen N. Nutrient profiling schemes: Overview and comparative analysis. Eur J Nutr. 2007; 46(2):15-28. doi: 10.1007/s00394-007-2002-7 42. Silveira BM, Gonzalez-Chica DA, Proença RPC.
Reporting of trans-fat on labels of Brazilian food products. Public Health Nutr. 2013; 16(12):2156-3. doi: 10.1017/S1368980013000050