1
Centro de Estudo e Pesquisa em Atenção Primária, Serviço de Saúde Comunitária, Grupo Hospitalar Conceição. Av. Francisco Trein, 596, 91350-200, Porto Alegre, RS, Brasil. Correspondência para/Correspondence to: LA LIMA. E-mail: <[email protected]>.
2
Universidade Federal de Santa Catarina, Centro de Ciências da Saúde, Departamento de Saúde Pública. Florianópolis, SC, Brasil.
3
Universidade do Vale do Rio dos Sinos, Programa de Pós-Graduação em Saúde Coletiva. São Leopoldo, RS, Brasil.
4
Universidade Federal de Ciências da Saúde de Porto Alegre, Departamento de Nutrição. Porto Alegre, RS, Brasil.
5
Universidade Federal do Rio Grande do Sul, Faculdade de Medicina, Programa de Pós-Graduação em Epidemiologia. Porto Alegre, RS, Brasil.
Article based on the master’s thesis of LA LIMA intitled: “Adequação dos hábitos alimentares de adultos hipertensos e diabéticos atendidos em um serviço de atenção primária à saúde”. Universidade Federal do Rio Grande do Sul; 2013.
Food habits of hypertensive and diabetics
cared for in a Primary Health Care
service in the South of Brazil
Hábitos alimentares de hipertensos e diabéticos
atendidos em um serviço de Atenção
Primária à Saúde do Sul do Brasil
Lena Azeredo de LIMA1 Fúlvio Borges NEDEL2
Maria Teresa Anselmo OLINTO3,4 Julio BALDISSEROTTO5
A B S T R A C T
Objective
Describe the eating habits of hypertensive and diabetic individuals, classify their adequacy according to the Ministry of Health’s Food Guide for the Brazilian Population and determine the association between adequate diet and the health problems under investigation.
Methods
Descriptive study from the baseline of a longitudinal study begun in 2011, with a sample of hypertensive and diabetic patients from a Primary Health Care facility in Southern Brazil, interviewed at home.
Results
of soda, sugar, salt and saturated fat. The most adequate diet was associated with poor health status and the prevalence of inadequate diet was 30.0% higher among those who were only hypertensive.
Conclusion
According to Ministry of Health guidelines, the eating habits of diabetic and hypertensive subjects are inadequate. The association between adequate diet and the health problems studied indicated a delayed improvement in diet, suggesting an urgent need for preventive and effective interventions to promote healthy eating. Keywords: Chronic disease. Diabetes Mellitus. Food habits. Hypertension. Primary Health Care.
R E S U M O
Objetivo
Descrever hábitos alimentares de hipertensos e diabéticos, classificar sua adequação de acordo com Guia Alimentar para População Brasileira do Ministério da Saúde e verificar a associação entre a adequação dos hábitos alimentares e o problema de saúde.
Métodos
Estudo descritivo, a partir da linha de base de um estudo longitudinal iniciado em 2011, com amostra de adultos hipertensos e diabéticos usuários de um serviço de atenção primária no sul do Brasil, entrevistados em seu domicílio.
Resultados
Foram analisadas 2.482 pessoas das quais 66,5% eram hipertensas, 6,5% eram diabéticas e 27,1% apresentavam hipertensão e diabetes. Dos entrevistados, 29,6% tinham hábitos alimentares inadequados, 46,9% parcialmente adequados, e 23,4% estavam adequados. Foi identificado baixo consumo de fibras e alto consumo de refrigerante, açúcar, sal e gordura saturada. A melhor adequação alimentar estava associada à pior condição de saúde, sendo que a prevalência de inadequação alimentar foi 30,0% maior nos que eram somente hipertensos.
Conclusão
Os hábitos alimentares dos diabéticos e hipertensos não estavam adequados, considerando as diretrizes do Ministério da Saúde. A associação da adequação do hábito alimentar com o problema de saúde indicou uma melhora tardia do hábito alimentar, o que aponta a necessidade premente de intervenções preventivas e efetivas na promoção da alimentação saudável.
Palavras-chave: Doença crônica. Diabetes Mellitus. Hábitos alimentares. Hipertensão. Atenção Primária à Saúde.
I N T R O D U C T I O N
Chronic Non-Communicable Diseases (CNCD) are the leading cause of death worldwide and are responsible for 63% of fatalities, although the mortality rate has declined in developed countries in recent years1,2. Like other developing
countries, Brazil is currently experiencing a triple burden of disease, where chronic conditions account for about 72% of deaths3,4 and coexist
with infectious disease, maternal disorders, perinatal conditions and vitamin deficiencies, as well as the growth of violence and external causes5,6.
Hypertension (H), prevalent in 36.0% of people aged over 40 years, and Diabetes Mellitus
(DM), present in 5.7% of adults and almost 18.0% of the elderly, are chronic conditions and primary risk factors for cardiovascular disease. Together, they are also the leading cause of hospitalization in Brazil3,4,7.
Among the determinants governing the prevalence of these diseases are rapid demographic and nutritional transition and changing lifestyles2,4,6,8. For example, there has
a negative impact on the control of CNCD2,9-11.
Food consumption stands out among modifiable risk factors and research into eating habits allows the creation of strategies to promote health through diet2,11.
In 2006 the Ministry of Health published the Food Guide for the Brazilian Population as an official instrument that establishes guidelines for healthier food choices. The Guide was distributed among primary care staff with the goal of advising professionals on health promotion and the prevention of diet-related diseases9,11, with a new
edition set for publication in 2014. The aim of this study was to describe and classify, according to recommendations in the Food Guide for the Brazilian Population, the adequacy of the eating habits of hypertensive and diabetic patients treated at a primary care facility and determine the association between diet suitability and the health problem.
M E T H O D S
Study design and sampling: this is a cross-sectional study that used baseline data collected between March and April 2011 from longitudinal study designed to assess the effects of an intervention with staff from health care units. The population studied was composed of hypertensive and diabetic adults from the catchment area of
the Serviço de Saúde Comunitária (Community
Health Care Service) of the Grupo Hospitalar
Conceição who had doctor’s appointments
through the service in the previous three years. The service is a reference for 108,000 people and consists of 12 health care units located in the northern and eastern districts of Porto Alegre, Rio
Grande do Sul State. Staff consists of doctors,
nurses, dentists, psychologists, social workers, nursing, administrative and oral health technicians, and community health care agents, with additional support provided by dieticians, pharmacists and medical specialists.
The size of the baseline sample was defined based on the objectives of the primary study that this investigation is part of, totaling
3,784 subjects chosen randomly from the records of diabetic and hypertensive adults registered on Information System. Among those selected there were 65 refusals and 281 people did not take part because they were not hypertensive or diabetic, no longer lived in the catchment area or had passed away. There were 51 people that could not be interviewed as they were on vacation or hospitalized and 889 people could not be located either because there was no recorded address, no one was home after four attempted visits, or none of the neighbors reported knowing the individual. It is quite plausible to think that the proportion of subjects who were not part of the target population was higher among those not located than those who provided information. As such, were estimated a response rate of around 75% with 2,482 people interviewed.
Variables: The baseline used a structured questionnaire applied at subjects’ homes by qualified interviewers. Dependent variables for the study were: gender, age, schooling level, marital status and socioeconomic classification determined according to the criteria of the
Associação Brasileira de Empresas de Pesquisa
(ABEP, Brazilian Association of Market Research Companies)12, grouping social classes into three
categories (A/B, C and D/E). There was a flaw in the questionnaire and the schooling level of the head of the household, an item in the proposed algorithm, was not collected. In order to remedy this problem the information was collected by telephone, with a response rate of 50%. Were estimated the correlation between the ABEP classification calculated using the schooling level of the household head and that determined using the schooling level of interviewee, establishing a Kappa index of 0.862, (95% Confidence Interval [95%CI]=0.834-0.893) for the ABEP rating grouped into 3 categories. The variable health problem was categorized as “only Hypertensive” (H), “only Diabetes Mellitus” (DM) or “Hypertension and Diabetes Mellitus” (H*DM).
entitled “How is your diet?”, from the pocket-sized Food Guide13. These enquired about the
consumption of vegetables, fruit, legumes, fish, fried foods, sausages, candy, soda and dairy products, and about the habit of removing any visible fat from poultry or meat.
Diet adequacy was classified into three levels according to the scoring system proposed in the Food Guide test, adapted for this study. Questions on physical activity and alcohol consumption were replaced by the International Physical Activity Questionnaire (IPAQ)14 and
Cut-down; Annoyed; Guilty & Eye-opener (CAGE)15, whose results were included in the diet
classification score. The question about reading food labels was excluded. As such, the cutoff points for classifying diet adequacy were adjusted slightly.
The Food Guide classifies diet into three levels: up to 28 points, from 29 to 42 points and 43 points or more. In this study these were altered to first quartile, interquartile range and third quartile (up to 28, from 28 to 34, over 34), respectively, to rate the diet as “inadequate”, “partially adequate” and “adequate”. This change in the cutoff points was based on point distribution, that is, distribution close to the normal curve. This was also used as a dichotomous variable where the categories “partially adequate” and “adequate” were combined for analysis purposes.
The Chi-square test was used with the socioeconomic variables and health problem variable. The description of the consumption of food markers and the prevalence of adequate diet were obtained using the Chi-square test as a function of the health problem. Were considered significant associations with a type I error <5% (p<0.05).
Poisson regression was used to determine the prevalence ratio, with the chronic form of the disease considered a factor when calculating the prevalence of adequate diet in each stratum. Analyses were conducted to test the independence
of the groups without considering causality. PASW Statistics 18 R software was used16.
The research project was submitted to the Research Ethics Committee of Hospital Nossa
Senhora da Conceição and approved on June 13,
2012, under Protocol number 39056.
R E S U L T S
A total of 2,483 subjects were analyzed, of which 68,0% were women. Among the variables studied, the proportion of missing data varied from 0.7% to 7.0% and was above 5.0% for two variables (schooling level and ABEP classification). Average age was 63.2 years (95%CI=62.7-63.7), 31.0% of participants completed high school and 52.0% lived with a partner. The predominant socioeconomic classification was class C (64.0%), with approximately 25.0% classed as A/B and only 11.0% D/E.
Table 1 shows that 66.5% (95%CI=64.5-68.3) exhibited only H, 6.5% (95%CI=5.6-7.5) only DM and 27.1% (95%CI=25.3-28.9) presented H*DM. Higher prevalence of H was recorded among women and DM in men. The prevalence of patients with H*DM doubled in the 40-59-year-old age range in relation to 20 to 39-year-old.
Table 1. Demographic and socioeconomic characteristics of hypertensive and diabetic patients using the Serviço de Saúde Comunitária in Porto Alegre (RS), 2011.
Total
N % (95%CI)
Gender
Male Female
Age
20-39 40-59 60-74 75-84 >85
Marital status
Single Stable Union
Classification (ABEP)**
A-B C D-E
Schooling level***
≤finished elementary school
≥finished high school
2,482
780 1,685
89 824 1,067
404 81
1,181 1,301
578 1,499
261
1,592 716
100
31.6 68.4
03.6 33.4 43.6 16.4
03.3
48.0 52.0
24.7 64.1 11.2
69 31
1,638 66.50
(64.5 - 68.3)
63.70
67.70
77.50
69.70
62.90
64.60
77.80
67.50
65.50
65.20
67.60
63.60
66.67 67.90
160
06.5 (5.5 - 7.5)
08.6
05.5
12.4
08.6
05.7
03.5
03.7
05.7
07.2
06.9
06.2
07.3
05.8
08.8
Note: *Chi-square test; **Missing data: 7.01%; ***Missing data: 5.9%.
H: People with Hypertension; DM: People with Diabetes Mellitus; H*DM: People with Hypertension and Diabetes Mellitus; 95%CI: 95% Confidence Interval; ABEP: Associação Brasileira de Estudos Populacionais.
Characteristics N % H DM H*DM p-value
667 27.1 (25.3 - 28.8)
27.7 26.8
10.1 21.7 31.4 31.9 18.5
26.8 27.3
27.9 26.2 29.1
27.6 23.3
<0.010
<0.001
<0.288
<0.671
<0.015
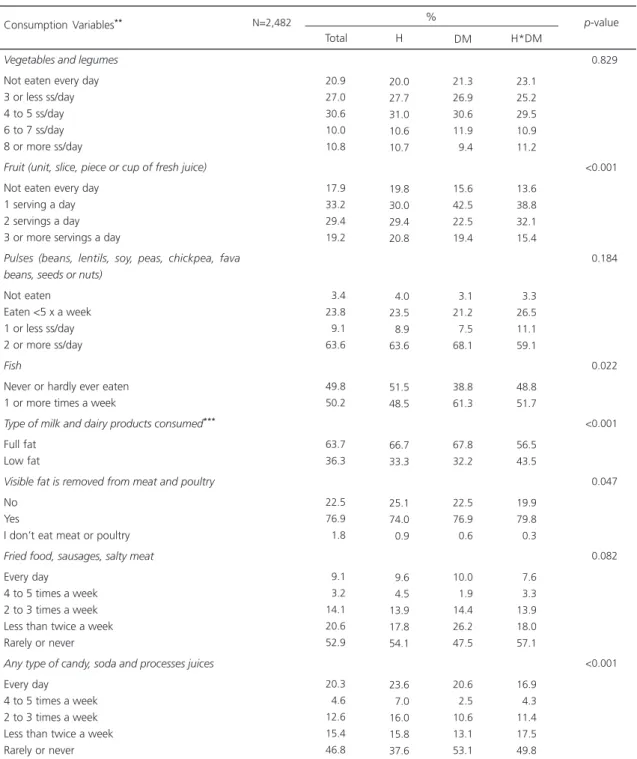
among hypertensive subjects. Fried food and sausages were consumed twice a week or more by around 26.0% of participants. Approximately 40.0% of diabetics reported daily consumption of candy, soda or artificial fruit juices.
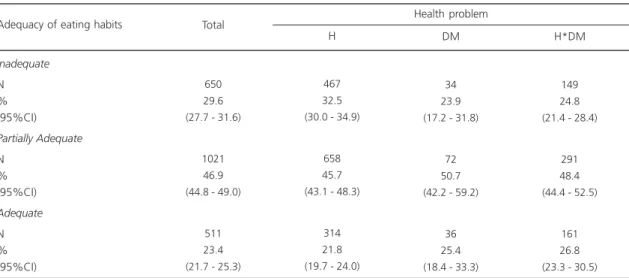
Table 3 shows the classification of diet adequacy and its association with the health problem. Inadequate eating habits were prevalent in 29.6% (95%CI=27.7-31.6) of the sample, with higher levels recorded (32.5%) among those suffering from H. Adequate diet was observed in 23.4% (95%CI=21.7-25.3) of the sample and was more prevalent in those with H*DM (26.8%). The prevalence ratio for inadequate diet was 30% higher in hypertensive subjects compared to diabetics or those suffering from both diseases, as shown in Table 4.
D I S C U S S I O N
The greater prevalence of hypertension among women recorded in this study was also observed in the telephonic inquiry17. On the other
hand, for this sample diabetes was more frequent among men, unlike the results of the telephonic inquiry, which found that DM was more common in women17.
With respect to schooling level, data from this study indicate that people who have completed high school or tertiary education exhibit lower comorbidity and high DM levels, similar to Vigilância de Fatores de Risco e Proteção para Doenças Crônicas por Inquérito Telefônico
which H and DM were twice as prevalent in people with less than 8 years of schooling17.
Socioeconomic classification showed a
Table 2. Eating habits according to the health problem in diabetic and hypertensive patients using the Serviço de Saúde Comunitária in Porto Alegre (RS), 2011.
Vegetables and legumes
Not eaten every day 3 or less ss/day 4 to 5 ss/day 6 to 7 ss/day 8 or more ss/day
Fruit (unit, slice, piece or cup of fresh juice)
Not eaten every day 1 serving a day 2 servings a day 3 or more servings a day
Pulses (beans, lentils, soy, peas, chickpea, fava beans, seeds or nuts)
Not eaten Eaten <5 x a week 1 or less ss/day 2 or more ss/day
Fish
Never or hardly ever eaten 1 or more times a week
Type of milk and dairy products consumed***
Full fat Low fat
Visible fat is removed from meat and poultry
No Yes
I don’t eat meat or poultry
Fried food, sausages, salty meat
Every day 4 to 5 times a week 2 to 3 times a week Less than twice a week Rarely or never
Any type of candy, soda and processes juices
Every day 4 to 5 times a week 2 to 3 times a week Less than twice a week Rarely or never
N=2,482 20.9 27.0 30.6 10.0 10.8 17.9 33.2 29.4 19.2 03.4 23.8 09.1 63.6 49.8 50.2 63.7 36.3 22.5 76.9 01.8 09.1 03.2 14.1 20.6 52.9 20.3 04.6 12.6 15.4 46.8 20.0 27.7 31.0 10.6 10.7 19.8 30.0 29.4 20.8 04.0 23.5 08.9 63.6 51.5 48.5 66.7 33.3 25.1 74.0 00.9 09.6 04.5 13.9 17.8 54.1 23.6 07.0 16.0 15.8 37.6 21.3 26.9 30.6 11.9 09.4 15.6 42.5 22.5 19.4 03.1 21.2 07.5 68.1 38.8 61.3 67.8 32.2 22.5 76.9 00.6 10.0 01.9 14.4 26.2 47.5 20.6 02.5 10.6 13.1 53.1 23.1 25.2 29.5 10.9 11.2 13.6 38.8 32.1 15.4 03.3 26.5 11.1 59.1 48.8 51.7 56.5 43.5 19.9 79.8 00.3 07.6 03.3 13.9 18.0 57.1 16.9 04.3 11.4 17.5 49.8 <0.829 <0.001 <0.184 <0.022 <0.001 <0.047 <0.082 <0.001
Note: *Chi-square test; **Missing data: 0.68%; ***System missing data: 8.46% (subjects who reported not consuming milk or dairy products);
Missing data:5.9%.
H: People with Hypertension; DM: People with Diabetes Mellitus; H*DM: People with Hypertension and Diabetes Mellitus; Ss: Soup spoon.
Consumption Variables**
Total H DM H*DM
p-value %
Table 3. Eating habits according to the health problem in diabetic and hypertensive patients using the Serviço de Saúde Comunitária in Porto Alegre (RS), 2011.
Inadequate
N % (95%CI)
Partially Adequate
N % (95%CI)
Adequate
N % (95%CI)
650 29.6 (27.7 - 31.6)
1021 46.9 (44.8 - 49.0)
511 23.4 (21.7 - 25.3)
467 32.5 (30.0 - 34.9)
658 45.7 (43.1 - 48.3)
314 21.8 (19.7 - 24.0)
34 23.9 (17.2 - 31.8)
72 50.7 (42.2 - 59.2)
36 25.4 (18.4 - 33.3)
149 24.8 (21.4 - 28.4)
291 48.4 (44.4 - 52.5)
161 26.8 (23.3 - 30.5)
Adequacy of eating habits Total
H DM H*DM
Health problem
Note: Probability for the table: Chi-square: 15.96 (4 degrees of freedom); p-value = 0.003.
H: People with Hypertension; DM: People with Diabetes Mellitus; H*DM: People with hypertension and Diabetes Mellitus;95%CI: 95% Confidence Interval.
Table 4. Prevalence ratio for inadequate eating habits as a function of the health problem of diabetic and hypertensive patients using the Serviço de Saúde Comunitária in Porto Alegre (RS), 2011.
H*DM H DM
1 1.31 0.97
Chronic condition PR
1.12 - 1.53 0.70 - 1.34 95%CI
Note: Chi-square for linear trend: 10.28 (1 degree of freedom)
p-value = 0.001.
H: Hypertension; DM: Diabetes Mellitus; H*DM: Hypertension and Diabetes Mellitus; PR:Prevalence Ratio;95%CI: 95% Confidence Interval.
The increased prevalence of comorbidity associated with higher age was also observed in 2010 Instituto Brasileiro de Geografia e Estatística
(IBGE, Brazilian Institute of Geography and Statistics) data, which showed a 45% rise in the presence of chronic disease between the ages of 40 and 59 years and a prevalence of 65% from 50 years, reaching almost 80% in those aged 65 years or more. When asked about the number of chronic diseases, comorbidity doubled from 40 years old and tripled among those aged 65 years or more7. The Vigitel 2010 recorded an almost
three-fold increase in the prevalence of H and DM among those older than 45 years, climbing to almost six times higher for H and ten times for DM from 65 years old17.
Most respondents did not follow the dietary guidelines recommended by the Ministry of Health for the general population11. In regard
to food markers of a healthy diet, insufficient fiber consumption was observed as a result of low fruit and vegetable intake and excessive consumption of soda, sugar, salt and saturated fat. A baseline study in 16 countries that included approximately 2,790 overweight or obese people with type 2 diabetes (Action for Health and Diabetes Group [Look AHEAD]) also concluded that most people do not adhere to dietary recommendations18.
Fruit and vegetable intake in this study was far below that recommended by the World Health Organization of at least five daily servings for the general populationl2 or the level stipulated in the
Food Guide of at least 3 servings of fruit and 3 of legumes or vegetables every day11. Nevertheless,
to data from a population-based survey that found that 9.2 to 24.0% of people ate five servings of fruit and vegetables every day17. The study by
Levy-Costa et al.19 evaluated food availability in
urban areas from 1970 to 2003 and found a lack of fruit and vegetables in peoples’ diets.
The results of the “Look AHEAD” baseline study assessing the eating habits of diabetics showed adequate vegetable consumption of 38%18. The diabetic subjects in the present study
reported less satisfactory vegetable and legume intake. Considering that diabetics from both studies are monitored by health care services and that vegetable and legume consumption are emphasized for their role in glycemic control20,
the findings of the present study are less satisfactory.
The habit of eating one serving of pulses at least five times a week, in line with Ministry of Health11 recommendations, observed in diabetic
and hypertensive subjects in comparison to the general population was similar to the Brazilian average (66.7%) and higher than the percentage recorded in Porto Alegre (49.7%)17.
The Food Guide recommends eating fish at least twice a week11, however, our study found
that almost half the subjects never or hardly ever did so. According to the study by Levy-Costa et al.19, based on the Family Budget Survey, fish
consumption declined by 50% from 1970 to 2003.
The consumption of full fat milk and dairy products in the present study exceeded the estimates of the 2010 telephonic inquiry, which indicated a national average of 56.0% and 44.3%
in Porto Alegre (RS)17. Failure to remove visible
fat from meat and poultry was less common in this study than in the telephonic inquiry, which estimated that in Porto Alegre (RS) 35.0% of the adult population do not remove visible fat, a percentage similar to the national average17. The
Food Guide suggests low fat milk and dairy products and recommends that visible fat be
removed from meat and poultry to lower saturated fat intake11.
Eating fried food, sausages and sweets and drinking soda or artificial fruit juice more than twice a week was very common among interviewees. The Ministry of Health highlights the need to lower salt intake and emphasizes high levels as one of the causes of hypertension, limiting daily salt consumption to five grams for the general population11. A single serving of the
above mentioned foods typically contains the recommended salt intake for an entire day. The Brazilian Food Guide recommends a maximum of one daily serving of these foods for the general population, while the consumption of candy by diabetics should be monitored according to the glycemic load21,22.
A distinctive characteristics found among diabetic subjects was that more than half reported they did not eat candy regularly, a habit considered appropriate, while more than one third ate candy on a daily basis, although this amount decreased among those with H*DM. The AHEAD study found candy consumption above recommended levels in 28% of the diabetics assessed, a lower percentage than that recorded in the present study.
Four major studies on food availability between 1970 and 2003 reported high consumption of sugar, fats in general and processed foods11,23-25. In the presence of a chronic
condition, reduced consumption of these nutrients is highly recommended given their relationship with H23 and DM22,26 and risk of
cardiovascular diseases2,11. Nevertheless, despite
being monitored by a health care service, the eating habits of hypertensive and diabetic individuals in this study were not satisfactory.
than that of hypertension (222 DALY per
100,000)27 and that the presence of H*DM is
worse than suffering from only one of the conditions, it can be suggested that the severity of a chronic condition is a motivating factor in dietary changes and greater contact with health care services.
A higher prevalence ratio of inadequate diet was found in the group consisting of only hypertensive participants (Table 4), which can also be observed in more detail in the differences in fruit and fish intake and removal of visible fat from meat and poultry, shown in Table 2. The detection of poorer eating habits among hypertensive subjects indicates the need for strategies aimed at preventing comorbidities and complications in this population. Diabetics reported eating more fish and less candy, but consumed full fat milk and dairy products (Table 2). Those with H*DM and a more adequate diet (Table 3) tended to remove visible fat from meat and consume dairy products with a lower fat content (Table 2).
Limitations of the present study were related to the questions on eating habits, in that the test from which they were taken was not validated. As such, like most food surveys there is potential for measurement bias, with one of the problems encountered being serving sizes. In order to reduce this bias, tables of homemade servings were described in the manual and examples were given in the questionnaire. Another point to be considered is that the study deals with people suffering from diseases who frequently receive diet-related information from either the media or health care professionals. An additional limitation was that part of the sample could not be located despite efforts to compensate for the loss. Nevertheless, for the purposes of this study the sample size was sufficient for analyses. It is quite plausible to consider that the proportion of subjects who were not part of the target population was higher among those not located than those who provided information.
C O N C L U S I O N
The study demonstrated that eating habits among diabetic and hypertensive subjects, monitored by primary health care services, were inadequate according to Ministry of Health guidelines. The association between better diet and the presence of both diseases indicates a delayed change in eating habits, since poor diet is a known risk factor for chronic diseases and their complications. It is important to work with the population in applying preventive measures that promote the adoption of healthy eating habits before health deteriorates. Further studies are suggested to identify the most effective and feasible techniques for promoting a healthy diet in primary health care.
A C K N O W L E D G E M E N T S
Dr. Luciane Kopittke and Dr. Airton Tetelbom Stein.
C O N T R I B U T O R S
LA LIMA and FB NEDEL collaborated in the conception, design, analysis and interpretation of data. MTA OLINTO collaborated in the analysis and interpretation of data. J BALDISSEROTTO collaborated in the conception and design of article.
R E F E R E N C E S
1. World Health Organization. World Health Statistics 2012. Geneva: WHO; 2012 [cited 2013 Mar 24]. Available from: http://apps.who.int/iris/bitstream/ 10665/44844/1/9789241564441_eng.pdf 2. World Health Organization. Diet, nutrition and the
prevention of report of a joint WHO/FAO Expert Consultation. Geneva: WHO; 2003.
3. Brasil. Plano de ações estratégicas para o enfren-tamento das Doenças Crônicas não Transmissíveis (DCNT) no Brasil, 2011-2022. Brasília: Ministério da Saúde; 2011 [acesso 2013 mar 16]. Disponível em: http://portal.saude.gov.br/portal/arquivos/pdf/ cartilha_dcnt_completa_portugues.pdf
non-communicable diseases in Brazil: Burden and current challenges. Lancet. 2011 [cited 2013 Feb 28]; 377(9781):1949-61. Available from: http:// www.ncbi.nlm.nih.gov/pubmed/21561658 5. Mendes EV. O cuidado das condições crônicas na
atenção primária à saúde: o imperativo da conso-lidação da estratégia da saúde da família. Brasília: Organizaçao Pan-Americana da Saúde; 2012. 6. Mendes EV. As redes de atenção à saúde Health
care networks. Ciênc Saúde Colet. 2010; 15(5):2297-305.
7. Instituto Brasileiro de Geografia e Estatística. Pes-quisa nacional por amostra de domicílios. Rio de Janeiro: IBGE; 2010.
8. Olinto MTA. Padrões alimentares: análise de com-ponentes principais. In: Kac G, Sichieri R, Gigante DP, editores. Epidemiologia nutricional. Rio de Ja-neiro: Fiocruz; 2009. p.213-25.
9. Brasil. Ministério da Saúde. Secretaria de Políticas de Saúde. Plano de reorganização da atenção à hipertensão arterial e ao diabetes mellitus: manual de hipertensão arterial e diabetes mellitus. Brasília: Ministério da Saúde; 2002.
10. Olinto MT, Gigante DP, Horta B, Silveira V, Oliveira I, Willett W. Major dietary patterns and cardiovascular risk factors among young Brazilian adults. Eur J Nutr. 2012 [cited 2013 Mar 17]; 51(3):281-91. Available from: http://www. pubmed central.nih.gov/articlerender.fcgi?artid=33130 34&tool=pmcentrez&rendertype= abstract 11. Brasil. Ministério da Saúde. Guia alimentar para a
população brasileira. Brasília: Ministério da Saúde; 2008.
12. Associação Brasileira de Empresas de Pesquisa. Critério de classificação econômica Brasil. São Paulo: Abep; 2011 [acesso 2011 dez 12]. Disponível em: www.abep.org
13. Brasil. Ministério da Saúde. Guia alimentar: como ter uma alimentação saudável. Brasília: Ministério da Saúde; 2006.
14. Craig CL, Marshall AL, Sjöström M, Bauman AE, Booth ML, Ainsworth BE, et al. International physical activity questionnaire: 12-country reliability and validity. Med Sci Sports Exercise. 2003 35(8):1381-95.
15. Shayesta D, Jacek K. The CAGE questionnaire for alcohol misuse: A review of reliability and validity studies. Clin Invest Med. 2007 [cited 2013 May 14]; 30(1):33-41. Available from: http://cimonline. ca/index.php/cim /article/view/447/563
16. R Core Team. A language and environment for statistical computing. Vienna: R Foundation for Statistical Computing; 2012 [cited 2013 May 11]. Available from: http://www.r-project.org/
17. Brasil. Ministério da Saúde. Vigitel Brasil 2010. Vigilância de fatores de risco e proteção para doenças crônicas por inquérito telefônico. Brasília: Ministério da Saúde; 2011 [acesso 2012 nov 29]. Disponível em: http://bvsms.saude.gov.br/bvs/ publicacoes/vigitel_2010.pdf
18. Miller GD, Mobley C, Reeves R. Action for Health in Diabetes (Look AHEAD) Trial. J Am Diet Assoc. 2009; 109(8):1367-75.
19. Levy-Costa RB, Sichieri R, Pontes NS, Monteiro CA. Disponibilidade domiciliar de alimentos no Brasil: distribuição e evolução (1974-2003). Rev Saúde Pública. 2005; 39(4):530-40.
20. De Natale C, Annuzzi G, Bozzetto L, Mazzarella R, Costabile G, Ciano O, et al. Effects of a plant-based carbohydrate/fiber diet versus high-monounsaturated fat/low-carbohydrate diet on postprandial lipids in type 2 diabetic patients. Diabetes Care. 2009 [cited 2013 Feb 2]; 32(12):2168-73. Available from: http://www. pubmedcentral.nih.gov/articlerender.fcgi?artid= 2782970&tool=pmcentrez&rendertype=abstract 21. American Diabetes Association. Nutrition
recommendations and interventions for diabetes: A position statement of the American Diabetes Association. Diabetes Care. 2007; 30(Suppl. 1):S48-65.
22. American Diabetes Association. Standards of medical care in diabetes - 2010. Diabetes Care. 2010; 33(Suppl. 1):S11-61.
23. Savica V, Bellinghieri G, Kopple JD. The effect of nutrition on blood pressure. Annu Rev Nutr. 2010; 30:365-401.
24. Campbell NRC, Johnson JA, Campbell TS. Sodium consumption: An individual’s choice? Int J Hypertens. 2012; (2012).
25. Centers for Disease Control and Prevention. Vital signs: Food categories contributing the most to sodium consumption - United States, 2007-2008. MMWR Morb Mortal Wkly Rep. 2012; 61(5):92-8. 26. Inzucchi SE, Bergenstal RM, Buse JB, Diamant M, Ferrannini E, Nauck M, et al. Management of hyperglycemia in type 2 diabetes: A patient-centered approach: Position statement of the American Diabetes Association (ADA) and the European Association for the Study of Diabetes (EASD). Diabetes Care. 2012; 35(6):1364-79. 27. Bonita R, Magnusson R, Bovet P, Zhao D, Geneau
R, Suh I, et al. Non-communicable diseases 2 country actions to meet UN commitments on non-communicable diseases: A stepwise approach. Lancet. 2013; 381(9866):575-84.