Cross-cultural validity of the
demand-control questionnaire:
Swedish and Brazilian workers
Validade transcultural da escala
demanda-controle: trabalhadores
suecos e brasileiros
I Laboratório de Epidemiologia Clínica.
Instituto Nacional de Infectologia Evandro Chagas. Fundação Oswaldo Cruz. Rio de Janeiro, RJ, Brasil
II Departamento de Epidemiologia. Instituto
de Medicina Social. Universidade do Estado do Rio de Janeiro. Rio de Janeiro, RJ, Brasil
III Centre for Health Equity Studies. Stockholm
University. Karolinska Institute. Stockholm, Sweden
IV Aging Research Center. Karolinska Institute.
Stockholm University. Stockholm, Sweden
V Stress Research Institute. Stockholm
University. Stockholm, Sweden Correspondence:
Yara Hahr Marques Hökerberg Laboratório de Epidemiologia Clínica Instituto Nacional de Infectologia Fundação Oswaldo Cruz
Av. Brasil, 4036 sala 201-A Manguinhos 21040-361 Rio de Janeiro, RJ, Brasil E-mail: [email protected] Received: 9/6/2013
Approved: 4/9/2014
Article available from: www.scielo.br/rsp
ABSTRACT
OBJECTIVE: To evaluate the cross-cultural validity of the Demand-Control Questionnaire, comparing the original Swedish questionnaire with the Brazilian version.
METHODS: We compared data from 362 Swedish and 399 Brazilian health
workers. Conirmatory and exploratory factor analyses were performed to
test structural validity, using the robust weighted least squares mean and variance-adjusted (WLSMV) estimator. Construct validity, using hypotheses testing, was evaluated through the inspection of the mean score distribution of the scale dimensions according to sociodemographic and social support at work variables.
RESULTS: The conirmatory and exploratory factor analyses supported the
instrument in three dimensions (for Swedish and Brazilians): psychological
demands, skill discretion and decision authority. The best-it model was
achieved by including an error correlation between work fast and work intensely (psychological demands) and removing the item repetitive work (skill discretion). Hypotheses testing showed that workers with university degree had higher scores on skill discretion and decision authority and those with high levels of Social Support at Work had lower scores on psychological demands and higher scores on decision authority.
CONCLUSIONS: The results supported the equivalent dimensional
structures across the two culturally different work contexts. Skill discretion
and decision authority formed two distinct dimensions and the item repetitive work should be removed.
DESCRIPTORS: Questionnaires. Working Conditions. Stress,
Psychological. Cross-Cultural Comparison. Validation Studies. Factor analysis, Statistical.
Yara Hahr Marques HökerbergI
Michael Eduardo ReichenheimII
Eduardo FaersteinII
Sonia Regina Lambert PassosI
Johan FritzellIII,IV
Susanna ToivanenIII
The demand-control model states that workers exposed
to high levels of job strain – a combination of high psychological demands and low job decision latitude – have an increased risk of ill health compared to those
exposed to low job strain.16 Social support at work was
added later as a dimension that would potentially buffer the effect of high strain on stress-related illness.13 The
model has been tested mostly in relation to cardiovas-cular diseases and related risk factors.3,32
The Job Content Questionnaire (JCQ) is a 49-item instrument, originally proposed to measure job strain
dimensions.14 Abridged versions were proposed for
multidimensional studies, such as the Swedish demand-control-support and the Whitehall Job Characteristics questionnaires.19 The demand-control-support
ques-tionnaire (DCSQ) includes 17 items grouped into three main dimensions: psychological demands (work fast, work intensely, work effort, enough time, and
conlicting demands), decision latitude – subdivided
into skill discretion (learning new things, skill level, take initiative, repetitive work) and decision authority
RESUMO
OBJETIVO: Avaliar a validade transcultural da escala demanda-controle, comparando o questionário original sueco com a versão brasileira.
MÉTODOS: Foram comparados os dados de trabalhadores de saúde, 362 suecos
e 399 brasileiros. Foram utilizadas análise fatorial conirmatória e exploratória
para avaliar a validade estrutural, usando o estimador robusto de mínimos quadrados ponderados ajustados para média e variância (WLSMV). A validade
de construto via teste de hipóteses foi avaliada pela inspeção da distribuição
dos escores médios das dimensões da escala segundo as características
sociodemográicas e níveis de apoio social no trabalho.
RESULTADOS: A análise fatorial conirmatória e exploratória corroborou o instrumento em três dimensões (suecos e brasileiros): demandas psicológicas,
uso de habilidades e autonomia para decisão. O modelo de melhor ajuste foi
obtido após incluir uma correlação de resíduos entre os itens trabalho rápido e trabalho intenso (demandas psicológicas) e remover o item trabalho repetitivo (uso de habilidades). O teste de hipóteses mostrou que trabalhadores com nível
universitário apresentaram maiores escores em uso de habilidades e autonomia para decisão e aqueles com grau elevado de apoio social no trabalho obtiveram
escores menores em demandas psicológicas e maiores em autonomia para decisão. CONCLUSÕES: Os resultados conirmaram a equivalência da estrutura dimensional em dois contextos laborais culturalmente diferentes. Uso de
habilidades e autonomia para decisão formaram duas dimensões distintas e o item trabalho repetitivo deveria ser removido da escala.
DESCRITORES: Questionários. Condições de Trabalho. Estresse Psicológico. Comparação Transcultural. Estudos de Validação. Análise Fatorial.
INTRODUCTION
(how to do the work and what to do at work) – and social support at work (pleasant atmosphere, relationships at work, coworkers’ support, helpful coworkers, relation-ship with supervisors and friendly workers). According to the psychometric literature, dimension represents the latent variable (not observed), which summarizes the original set of observed variables (e.g., items).4,11,30
Validation studies have been conducted using different versions of the JCQ;2,5,6,17,20,25,26,28 ive studies using the DCSQ were identiied:10,12,22,27,31 one was restricted to
an internal consistency analysis31 and four evaluated
dimensional validity using factor analysis.10,12,22,27
Mase et al22 (2012) evaluated the Japanese version of
DCSQ applied to 212 workers from 19 day nurseries
and nursery schools. The exploratory factor analysis
showed a three-factor solution, which did not corrobo-rate the hypothesized theoretical model since psycho-logical demands and skill discretion were combined to form a single dimension. Sanne et al27 (2005) conducted an exploratory factor analysis on data obtained from
namely, psychological demands, decision latitude, and social support at work. The authors found that for white-collar men and blue-white-collar women, decision latitude was split into skill discretion and decision authority in a four-factor solution.
The best it model of a Brazilian version of DCSQ12 assessed through conirmatory factor analysis (CFA)
was achieved when psychological demands, skill discre-tion and decision authority were considered in a
three-factor solution, after the exclusion of social support at
work. Moreover, a correlated error measurement between the items work fast and work intensely (psychological
demands) was observed and the item repetitive work
evidenced low and non-statistical signiicant loadings
on all dimensions. Another Brazilian study10 also found correlated residuals (measurement errors) when itting a one-dimensional conirmatory model on psycholog
-ical demands. Unfortunately, the second order solution
modeled for decision latitude could not be estimated.
Consistently with the DCSQ indings,12,27 some JCQ
studies concluded that Decision Latitude should be better operationalized as two separate dimensions.17,26,28 Thus,
using decision latitude score as a whole, when combined with demands for the Karasek’s quadrant terms, may be unable to distinguish risk factors and outcomes related to each (sub) dimension. Additionally, repetitive work has consistently appeared as the most troublesome item.5,14,20,26
According to the Consensus-based standards for the selection of health status measurement instruments – the COSMIN checklist –, cross-cultural validity should be assessed in addition to structural validity and hypoth-eses testing as part of the construct validity domain.23
CFA is one of the recommended statistical techniques to evaluate how equivalent the performance of items and dimensions are, in both the original and culturally adapted version of the instrument.23 However, rarely,
the DCSQ studies applied the CFA approach to a hetero-geneous sample, which enables to evaluate correlated items and factorial convergent and discriminant validity –crucial information to allow scale improvements.
Thus, the purpose of this study is to further explore the
DCSQ cross-cultural validity using the CFA approach in
two culturally distinct contexts: Sweden, a high income
country where the questionnaire was originally devel-oped; and Brazil, a middle income country where work opportunities and job related social policies and rights are more unevenly distributed.
METHODS
Health workers were considered for this study because they represent a relatively high status occupational class, albeit with some internal sociocultural heterogeneity. Brazilian and Swedish databases covering the same time
period, of similar sample size and including relevant vari-ables for the present analysis were available.
Brazilian data (BR) originated from a cross-sectional multidimensional study (2004-2005) investigating all workers in a public health research institute in Rio de Janeiro city, Southeastern Brazil. Of 497 estimated active workers, 424 agreed to participate and 399 (80.3%) completed the self-administered DCSQ at the workplace. Workers less than 18 years of age, and those either on a leave of absence or retired, or who
had worked for less than two years, were excluded.
Swedish data (SW) were drawn from the Swedish Longitudinal Occupational Survey of Health (SLOSH), a nationally representative cohort of the Swedish working population, in a follow-up of the Swedish Work Environment Survey, conducted by Statistic Sweden in 2003. For the present study, we analyzed data
from the irst follow-up wave carried out in 2006. The
self-administered questionnaires were sent to the partic-ipants by mail. We selected workers with occupational characteristics similar to those of the Brazilian sample and included workers from specialized health centers, general hospitals, laboratories, ambulance crews, and veterinary staff. Of the 391 health workers who were followed up in 2006, 362 (92.6%) completed the DCSQ.
The cross-cultural adaptation process of the DCSQ Brazilian version was described elsewhere.1 Briely,
conceptual, item, semantic and operational equivalences were evaluated. Measurement equivalence was restricted to test-retest reliability and internal consistency.
DCSQ dimension scores were calculated by summing up the unweighted item scores by dimension; for
psychological demands scores ranged from ive to 20, and for decision latitude scores ranged from six to 24.
The four-point response options varied from “often” (four points) to “never/almost never” (one point).
Social Support at Work consists of six items answer -able by a four-point-Likert scale ranging from “strongly
agree” to “strongly disagree” (scoring from six to 24).
This dimension is applied to respondents as part of the DCSQ, but is hypothesized to buffer the association between job strain and stress-related disorders.13
Sociodemographic characteristics included age, sex and
education level (< high school, high school and univer-sity degree). Job titles were evaluated according to the
major groups of the International Standard Classiication
of Occupations (ISCO, 1988) and grouped as white-collar (major ISCO groups one to four) and blue-white-collar
workers (major ISCO groups ive to nine).
which is suitable for categorical indicators.24 In agreement
with the theoretical model13,16 and previous study results,12 we excluded the Social Support at Work dimension from
factor analysis of the DCSQ (to be referred to as DCQ hereafter). Since the DCQ is comprised of 11 four-level ordinal items, polychoric correlation matrices were used.7
First, CFA was performed on each sample to corrob-orate the factor structure proposed by the original demand-control model. Basically, two models were
tested: Model 1 predicted the existence of two corre -lated latent factors representing psychological demands and decision latitude; Model 2 consisted of three corre-lated latent factors (due to the subdivision of deci-sion latitude in two factors): psychological demands, skill discretion and decision authority. We evaluated the magnitude of the factor loadings, item residuals (or uniqueness), i.e., the portion of an indicator not
explained by the latent factor, and factor correlations.4 Modiication indices were evaluated to inspect potential
item cross loadings and item residual (error) correlations. Possible item cross loadings and correlations between item
measurement errors involving modiication indices values equal to or greater than 10 would be further examined, as well as the magnitude of the corresponding expected
parameter changes for freely estimated parameters.4
Goodness of it was evaluated using three indices. The root mean square error of approximation (RMSEA)
incorporates a penalty function for poor model parsi-mony, accounting for sample size vis-à-vis the number of estimated parameters. Values under 0.06 suggest an approximate (good) it, whereas values above 0.10 indi
-cate a poor it and that the model should be rejected.4 The Comparative Fit Index (CFI) and the Tucker-Lewis index (TLI) represent incremental it indices contrasting
the hypothesized model to a more restricted nested baseline model, the “null model”. Both range from zero
to one, with values > 0.9 considered an adequate it.18 Second, exploratory structural equation modeling
(ESEM) was performed on each sample to investigate plausible alternative dimensional structures to be further evaluated through the CFA approach. ESEM has been utilized to additionally evaluate whether the same dimen-sional pattern replicates across the two samples (facto-rial invariance). Basically, this procedure consisted of
itting separate and grouped exploratory models (one to four factors) within the CFA framework. We ixed factor
variances to a value of one and the latent means to zero in the Swedish and Brazilian samples. For the grouped
ESEM analysis we also ixed the item residual variances
to a value of one in the Swedish sample only. All load-ings are freely estimated and geomin oblique rotation is used. ESEM allows implementation of other func-tions that may otherwise only be accomplished within a CFA framework, such as evaluating error measurement correlation and measurement invariance across groups.21
Third, factor-based convergent and discriminant validity were evaluated using the parameters obtained in the CFA models based on the theoretical proposition and outlined in ESEM analysis. Factor-based convergent validity assesses the degree to which items of the same dimension are corre-lated and is measured by internal consistency and average
variance extracted. Internal consistency was measured
by composite reliability, since the traditional Cronbach’s
alpha coeficient tends to underestimate reliability except
under restricted assumptions of equal common factor load-ings and uncorrelated measurement errors. Composite
reli-ability is deined for each factor by the ratio between the
true variance (the squared sum of the standardized factor loadings) and the observed variance (the squared sum of the standardized factor loadings plus the sum of their related uniquenesses, ranging from zero to one. Values
≥ 0.70 indicates acceptable internal consistency.4,11 Average variance extracted assesses the amount of vari -ance captured by a common factor in relation to the amount of variance due to random measurement error.11 Average variance extracted ranges from 0 to 1 and a factor shows convergent validity when ≥ 0.50, indi -cating that at least 50.0% of the variance in a measure is due to the hypothesized latent factor. If correlated measurement errors were considered in the CFA model, the sum of nonzero error covariances, multiplied by 2, was added to the denominator for average variance
extracted and composite reliability.4 Ninety ive percent conidence intervals (95%CI) for average variance extracted and composite reliability were obtained via
a bootstrap method with 1,000 replications.
Factor-based discriminant validity assesses the degree to which different dimensions of the same construct are distinct,18 which is corroborated if the average variance extracted square root of a given factor is above the absolute
value of its correlation with any other factor in the model.8
External construct validity (hypotheses testing) assess -ment was evaluated when inspecting mean-score distri-bution of demand and control dimensions according to sociodemographic characteristics and social support at work levels. T-test and ANOVA were used to evaluate mean differences across two or more independent groups, respectively. We tested the hypothesis that younger and female workers of lower socioeconomic status who reported lower scores of social support at work would perceive higher levels of psychological demands, and lower levels of skill discretion and decision authority. These analyses were performed in Stata SE, version 10.0.
The Brazilian study was approved by the Research
and Ethics Committee of the Instituto de Pesquisa
RESULTS
The Brazilian sample was younger, had a lower propor-tion of women, had fewer years of formal educa-tion and a lower proporeduca-tion of blue-collar workers (Table 1). White-collar workers included mostly clerks and professionals, respectively, in the Swedish and Brazilian samples. Health professionals (SW = 60 and BR = 78) were predominantly medical doctors (SW = 27 and BR = 38), nurses (SW = 30 and BR = 12) and psychologists (SW = 5 and BR = 14). Technicians (SW = 132 and BR = 82) included more nurse assis-tants (SW = 75 and BR = 21) and lifescience techni-cians (SW = 25 and BR = 43).
The CFA model results are presented in Table 2. Compared to the two-factor model, the three-factor model showed better item loadings and uniquenesses, particularly related to the items postulated as part of the skill discretion dimension and more evidenced in the Swedish sample. The item repetitive work resulted in low loadings and high uniquenesses in both models and samples. The magnitude of factor correlations
ranged from 0.10 to 0.44. These models had poor it
for both samples (RMSEA > 0.08), the three-factor
model (M2) it better (CFI/TLI > 0.90) than the
two-factor model (M1).
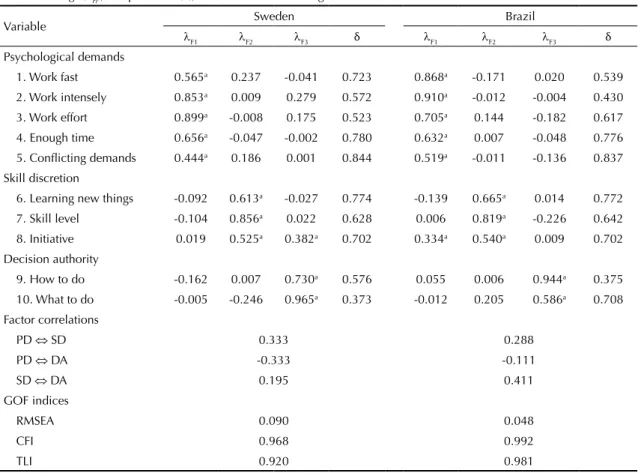
Exploratory models evaluated within a CFA frame -work (ESEM) were suitable for both samples and
conirmed the three-factor structure clearly related
to psychological demands, skill discretion and
decision authority (Table 3). Consistently with the CFA models, the item repetitive work resulted in low loadings (< 0.25) and high uniqueness (> 0.90) in both samples (data not shown) and was therefore deleted from the revised ESEM model. Factor loadings arising from the revised ESEM model were suitable for both samples, with the item conlicting demands on psycho-logical demands showing the lowest of all loadings (SW = 0.44 and BR = 0.52). The item initiative loaded not only on skill discretion (SW = 0.52 and BR = 0.54), but also on decision authority (0.38) in the Swedish sample and on psychological demands (0.33) in the Brazilian sample. In the Swedish sample, inspection
of the modiication indices (MI) suggested that freely
estimating the item residual correlation between work
fast and work intensely (psychological demands)
would decrease the Chi-square of the model by 28.94,
with an expected parameter change of 0.52. This item measurement correlation was conirmed in the sepa -rate Swedish and Brazilian ESEM models (SW = 0.403 and BR = 0.362) and improved the fit indices: RMSEA = 0.064 (SW) and 0.040 (BR), CFI = 0.985 (SW) and 0.995 (BR) and TLI = 0.960 (SW) and 0.987 (BR). The two-group model considering this item
measurement correlation provided a good it to the data, approximately the same it as those obtained with
separate ESEM models (RMSEA = 0.053, CFI = 0.991, TLI = 0.975). These results support the factorial invari-ance of the DCQ, which means that the same ESEM
model was able to it data from the Brazilian and
Swedish samples.
Table 1. Sociodemographic characteristics of the Brazilian and Swedish hospital workers.
Variable Sweden N = 362 Brazil N = 399
n % n %
Age: Mean (SD) 49.2 9.8 35.7 11.2
Sex
Male 63 17.4 126 31.7
Female 299 82.6 272 68.3
Education level
< High school 119 32.9 44 11.2
High school 122 33.7 155 39.3
University 121 33.4 195 49.5
Occupation
Major ISCO-88 group 1a 13 3.6 20 5.5
Major ISCO-88 group 2b 73 20.2 146 40.4
Major ISCO-88 group 3c 132 36.5 82 22.7
Major ISCO-88 group 4d 28 7.7 61 17.0
Major ISCO-88 groups 5 to 9e 116 32.0 52 14.4
SD: Standard deviation; ISCO-88: International Standard Classification of Occupations, 1988 a Managers and senior officials.
b Professionals (medical doctors, nurses, pharmacists, psychologists, social workers). c Technicians and associate professionals.
d Clerks.
Since these results had been observed in previous
CFA-type analyses on the Brazilian sample,12 we
tested and conirmed an alternate model including
the above mentioned item residual correlation in both samples (M3, Table 2). As in the previous model the item initiative cross-loaded on decision authority and psychological demands in the Swedish and Brazilian samples, respectively. The magnitude of factor corre-lations ranged from 0.18 to 0.34 and from 0.12 to 0.40 for the Swedish and Brazilian samples, respectively.
Goodness-of-it indices were suitable for both samples (RMSEA < 0.07, CFI and TLI > 0.90). Modiication
indices suggested that the item learning new things has a negative cross loading on psychological demands in the Brazilian sample.
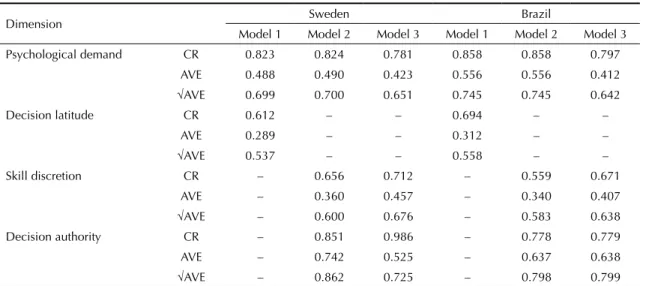
Although almost all composite reliability
coeffi-cients were suitable, the average variance extracted
was not (< 0.50), particularly with regard to the Skill Discretion dimension in both samples (Table 4). The
Table 2. Confirmatory factor analysis of the demand-control questionnaire: standardized factor loadings (λ), uniquenesses (δ), factor correlations and goodness-of-fit indices.
Variable
Sweden Brazil
M1 M2 M3 M1 M2 M3
λ δ λ δ λ δ λ δ λ δ λ δ
Item Psychological demands Psychological demands
1. Work fast 0.671 0.550 0.683 0.534 0.624 0.611 0.807 0.590 0.804 0.594 0.735 0.678 2. Work intensely 0.778 0.395 0.765 0.414 0.715 0.489 0.916 0.400 0.913 0.407 0.851 0.526 3. Work effort 0.845 0.285 0.842 0.292 0.872 0.239 0.765 0.644 0.776 0.630 0.816 0.577 4. Enough time 0.636 0.595 0.630 0.603 0.634 0.598 0.648 0.762 0.640 0.769 0.661 0.750
5. Conflicting demands
0.516 0.733 0.539 0.710 0.542 0.706 0.530 0.848 0.534 0.846 0.551 0.835
Decision latitude
Skill discretion Decision latitude
Skill discretion
6. Learning new things
0.098 0.990 0.528 0.721 0.543 0.705 0.510 0.860 0.445 0.896 0.584 0.812
7. Skill level 0.133 0.982 0.726 0.472 0.793 0.372 0.506 0.863 0.597 0.803 0.704 0.710
8. Initiative 0.351 0.877 0.775 0.399 0.669 0.419 0.564 0.826 0.893 0.450 0.620 0.645 9. Repetitive work 0.280 0.922 0.180 0.968 – – 0.047 0.999 -0.104 0.995 – –
Decision authority Decision authority
10. How to do 0.924 0.147 0.918 0.158 0.886 0.215 0.692 0.722 0.785 0.620 0.775 0.632
11. What to do 0.806 0.350 0.801 0.358 0.833 0.306 0.745 0.667 0.812 0.584 0.821 0.570 Cross loadings
DA ⇒ item 8 – – – – 0.310 – – – – – – –
PD ⇒ item 8 – – – – – – – – – – 0.327 –
Item correlation
Item 1 ⇔ Item 2 – – – – 0.282 – – – – – 0.368 –
Factor correlations
PD ⇔ DL -0.261 – – 0.104 – –
PD ⇔ SD – 0.298 0.400 – 0.440 0.229
PD ⇔ DA – -0.339 -0.340 – -0.129 -0.129
SD ⇔ DA – 0.333 0.091 – 0.401 0.472
GOF indices
RMSEA 0.148 0.091 0.067 0.134 0.082 0.058
CFI 0.798 0.926 0.971 0.862 0.951 0.982
TLI 0.741 0.901 0.956 0.823 0.934 0.972
PD: Psychological Demands; DL: Decision Latitude; SD: Skill Discretion; DA: Decision Authority GOF: Goodness-of-fit; RMSEA: Root mean square error of approximation; CFI: Comparative fit index; TLI: Tucker-Lewis index
Models performed using WLSMV mean and variance-adjusted estimator and theta parameterization.
square root of average variance extracted of all dimen -sions (M2 > 0.58 and M3 > 0.65) were above the absolute value of all CFA-based factor correlations, which ranged for the Swedish and Brazilian samples respectively, from 0.30 to 0.34 and from 0.13 to 0.44 for the 3-factor model (M2 = psychological demands
⇔ skill discretion ⇔ decision authority) and from 0.09 to 0.40 and from 0.13 to 0.47 when cross load-ings and error measurement correlations were added to alternative models M3 (Table 2).
Table 5 describes the mean score distribution of the demand control components according to sociodemo-graphic variables and Social Support at Work. Since the factor analysis showed that the item repetitive work
did not belong to the DCQ, it was not computed for the skill discretion score.Workers aged over 30 presented higher scores on psychological demands and decision authority dimensions only in the Brazilian sample. Workers with university degrees had higher scores on job strain components and those with high levels
(≥ 21) of social support at work had lower scores for
psychological demands and higher scores for decision
authority (p < 0.001). When compared to blue-collar workers, white-collar workers had higher scores on skill discretion in the Swedish (MISCO1-4 = 10.7, SDISCO1-4 = 1.1 and MISCO5-9 = 10.1, SDISCO5-9 = 1.6; F = 15.8, p < 0.001) and Brazilian samples (MISCO1-4 = 10.9, SDISCO1-4 = 1.4 and MISCO5-9 = 9.2, SDISCO5-9 = 2.0; F = 54.2, p < 0.001) (data not shown).
DISCUSSION
Our study corroborated the structural validity of the DCQ, when applied to Swedish and Brazilian hospital workers. The three-factor solution represented by the psychological demands, skill discretion, and decision authority dimensions was also generated in previous
studies on Brazilian restaurant workers12 and on
Norwegian male workers in high-status occupations.27 The same dimensional structure was also identiied in at least ive studies that used the larger JCQ.14,17,25,28,29
In our study, the item repetitive work did not belong to any of the factors in the Brazilian or Swedish samples. The same result was observed among Brazilian
Table 3. Exploratory factor analysis using structural equation models of the Demand-Control Questionnaire: standardized factor loadings (λFi), uniquenesses (δ), factor correlations and goodness-of-fit indices.
Variable Sweden Brazil
λF1 λF2 λF3 δ λF1 λF2 λF3 δ
Psychological demands
1. Work fast 0.565a 0.237 -0.041 0.723 0.868a -0.171 0.020 0.539
2. Work intensely 0.853a 0.009 0.279 0.572 0.910a -0.012 -0.004 0.430 3. Work effort 0.899a -0.008 0.175 0.523 0.705a 0.144 -0.182 0.617 4. Enough time 0.656a -0.047 -0.002 0.780 0.632a 0.007 -0.048 0.776 5. Conflicting demands 0.444a 0.186 0.001 0.844 0.519a -0.011 -0.136 0.837
Skill discretion
6. Learning new things -0.092 0.613a -0.027 0.774 -0.139 0.665a 0.014 0.772 7. Skill level -0.104 0.856a 0.022 0.628 0.006 0.819a -0.226 0.642 8. Initiative 0.019 0.525a 0.382a 0.702 0.334a 0.540a 0.009 0.702 Decision authority
9. How to do -0.162 0.007 0.730a 0.576 0.055 0.006 0.944a 0.375
10. What to do -0.005 -0.246 0.965a 0.373 -0.012 0.205 0.586a 0.708 Factor correlations
PD ⇔ SD 0.333 0.288
PD ⇔ DA -0.333 -0.111
SD ⇔ DA 0.195 0.411
GOF indices
RMSEA 0.090 0.048
CFI 0.968 0.992
TLI 0.920 0.981
GOF: Goodness-of-fit; RMSEA: Root mean square error of approximation; CFI: Comparative fit index; TLI: Tucker-Lewis index; PD: Psychological demands; SD: Skill discretion; DA: Decision authority
Model performed using WLSMV estimator, geomin rotation and theta parameterization, without the item repetitive work. a Standardized factor loadings (λ
Table 4. Composite reliability (95% confidence intervals) and average variance extracted as measured by confirmatory factor analysis of the demand-control questionnaire.
Dimension Sweden Brazil
Model 1 Model 2 Model 3 Model 1 Model 2 Model 3
Psychological demand CR 0.823 0.824 0.781 0.858 0.858 0.797
AVE 0.488 0.490 0.423 0.556 0.556 0.412
√AVE 0.699 0.700 0.651 0.745 0.745 0.642
Decision latitude CR 0.612 – – 0.694 – –
AVE 0.289 – – 0.312 – –
√AVE 0.537 – – 0.558 – –
Skill discretion CR – 0.656 0.712 – 0.559 0.671
AVE – 0.360 0.457 – 0.340 0.407
√AVE – 0.600 0.676 – 0.583 0.638
Decision authority CR – 0.851 0.986 – 0.778 0.779
AVE – 0.742 0.525 – 0.637 0.638
√AVE – 0.862 0.725 – 0.798 0.799
CR: Composite Reliability; AVE: average variance extracted
Models performed using WLSMV estimator and theta parameterization.
Model 1: 2-factor solution: Psychological demands ⇔ Decision latitude; Model 2: 3-factor solution: Psychological demands ⇔ Skill discretion ⇔ Decision authority; Model 3: Psychological demands ⇔ Skill discretion ⇔ Decision authority, without item 9, with item measurement correlation between item 1 ⇔ item 2 and cross loadings Decision authority ⇒ item 8 (Sweden) and Psychological demands ⇒ item 8 (Brazil).
restaurant workers,12 although not in a large sample of
Norwegian workers.27 Even though this inding has been
observed in several JCQ studies,6,14,25,29 results may not
be comparable, since the length and the items’ response pattern are different from DCQ.9,15
Error measurement correlation between work fast and
work intensely was conirmed for both samples, which may be interpreted as relecting some redundancy in these items. This inding has been detected among
Brazilian restaurant workers,25 nursing staff10 and in a
study of Canadian hospital workers using the JCQ.26
Since the indings showed that the item initiative not
only loaded on Skill Discretion, as expected, but also
on the decision authority and psychological demands factors in the Swedish and Brazilian samples, respec-tively, we reviewed the item contents across the versions, particularly with regard to semantics and
wording. We identiied an item wording difference
between the Swedish and the English versions (“Does your work require creativity?” and “Does your job require you to take the initiative?”, respectively) that might have affected the comparison between the Swedish and the Brazilian versions, since the latter was adapted directly from the English version.1 Further
studies using a qualitative approach could help clari-fying the cultural differences regarding the item on ‘initiative’. Nevertheless, the evidence that the item consistently cross-loads suggests its unsuitability in both cultures.4
Albeit exclusive to the Brazilian sample, the negative
cross-loading from learning new things on the
psycho-logical demands factor identiied through the CFA approach failed to materialize when using an explor -atory modeling process. This may be because the CFA’s strict requirement of zero-loadings on nontarget factors ends up forcing a single spurious negative cross-loading to accommodate information that would otherwise be adequately redistributed over several inconspicuous cross-loadings as implied by the more parsimonious ESEM approach,21 probably more adequate for latent
psychosocial constructs such as the DCQ.
Patterns of mean score distribution for skill discretion (BR) and decision authority (SW and BR) across educa-tion levels, for skill discreeduca-tion (SW and BR) across occupation groups, and for psychological demands and decision authority across social support levels (SW and BR) are in accordance with the theoretical model16 and
with other JCQ validation studies.14,25
Our findings need to be evaluated in light of the strengths and limitations of our study. To our
knowl-edge, this is the irst comparative study using ESEM
and CFA approaches on the structural and cross-cultural validity of the DCQ in two culturally different societies. Other methodological strengths can also be cited. For
one, we have explicitly evaluated item residual correla
-tion in a uniied context of exploratory and conirmatory
Table 5. Demand-control mean scores (with standard deviations) according to sociodemographic characteristics and level of social support at work: Swedish and Brazilian hospital workers.
Variable
Sweden Brazil
Psychol. Demands
Skill Discretion
Decision Authority
Psychol. Demands
Skill Discretion
Decision Authority
Sex a a a a
Male 13.6 (2.9) 10.1 (1.8) 6.1 (1.4) 12.9 (3.3) 10.4 (1.9) 5.3 (1.6) Female 13.6 (2.6) 10.6 (1.2) 5.6 (1.5) 13.3 (3.2) 10.8 (1.4) 5.7 (1.6)
Age a c
< 30 13.5 (2.3) 10.4 (1.6) 4.7 (0.9) 12.5 (3.1) 10.5 (1.6) 5.2 (1.5) 30 to 50 13.6 (2.5) 10.5 (1.4) 5.6 (1.4) 13.5 (3.3) 10.8 (1.4) 5.8 (1.5) ≥ 50 13.6 (2.7) 10.5 (1.3) 5.8 (1.5) 13.5 (3.3) 10.4 (1.8) 5.7 (1.7)
Education a c b c c
< High School 13.3 (2.8) 10.0 (1.5) 5.5 (1.5) 13.5 (3.1) 9.5 (1.8) 4.8 (1.8) High School 13.4 (2.6) 10.6 (1.2) 5.7 (1.5) 12.5 (3.1) 10.4 (1.6) 5.2 (1.5)
University 14.1 (2.4) 10.9 (1.1) 5.8 (1.4) 13.6 (3.3) 11.2 (1.2) 6.0 (1.4)
SSW c c c c
Low (< 17) 15.0 (2.4) 10.3 (1.4) 4.9 (1.4) 14.8 (3.1) 10.8 (1.4) 5.0 (1.6) Medium 13.5 (2.6) 10.5 (1.4) 5.8 (1.4) 13.8 (3.0) 10.5 (1.6) 5.4 (1.5)
High (≥ 21) 12.8 (2.5) 10.6 (1.2) 6.0 (1.4) 12.2 (3.2) 10.7 (1.6) 5.9 (1.5) SSW: Social support at work
a p < 0.05 b p < 0.01
c p < 0.001 obtained by student t-test (sex and occupation) or ANOVA prob > F (age, education and social support at work).
recommendations suggested by Montecarlo simulations
of CFA- and ESEM-based multiple group analyses21
and when using the WLSMV estimator for non-normal observational data.4 In terms of limitations, our samples
were restricted to health workers, although there were
workers from six of the nine major ISCO groups in
both samples.
Our results showed that DCQ has the same dimensional structure in the Swedish and Brazilian hospital workers
conirming the cross-cultural validity of this instrument.
Consistently with several other DCQ and JCQ studies, the item ‘repetitive work’should be removed from the demand control construct at least in our studied work environments. As most items were hypothesized as part of the Decision Latitude dimension, this could indicate the need to revise the content of this dimension, perhaps by contemplating the scrutiny and eventual introduc-tion of new and better items.
Our results suggest that the demand-control model
may still be valid in contemporary labor contexts. The
DCQ should be operationalized as a three-dimensional instead of a two-dimensional scale and without the item
assessing repetitive work. Since this study additionally sought to compare the Swedish and Brazilian data and thus enables an evaluation across different domains, our results may also be regarded as indicating the instru-ment’s psychometric invariance, be it only provision-ally and pending more rigorous analyses.4,21 International
comparative studies on the association of job strain
and health-related outcomes would beneit from truly
comparable scales. This would help resolve one source
of inconsistency of empirical results in this research ield.
Remaining issues – which argue for revising the model – include how items cover the latent trait in terms of intensity and the reproducibility of these results across a wider spectrum of socio-occupational groups.
ACKNOWLEDGMENTS
To Töres Theorell, Olle Lundberg, Constanze Leineweber and Gabriella Olsson for their comments; Cathrin Wiksell and Reidar Österman for their tech-nical assistance; Maria Angelica Borges dos Santos
REFERENCES
1. Alves MGM, Chor D, Faerstein E, Lopes CS, Werneck GL. Short version of the “job stress scale”: a Portuguese-language adaptation. Rev Saude Publica. 2004;38(2):164-71. DOI:10.1590/S0034-89102004000200003
2. Araújo TM, Karasek R. Validity and reliability of the Job Content Questionnaire in formal and informal jobs in Brazil. Scand J Work Environ Health Suppl. 2008;(6):52-9.
3. Backé EM, Seidler A, Latza U, Rossnagel K, Schumann B. The role of psychosocial stress at work for the development of cardiovascular diseases: a systematic review. Int Arch Occup Environ Health. 2012;85(1):67-79. DOI:10.1007/s00420-011-0643-6
4. Brown TA. Confirmatory factor analysis for applied research. New York: The Guilford Press; 2006. (Methodology in the Social Sciences).
5. Edimansyah BA, Rusli BN, Naing L, Mazalisah M. Reliability and construct validity of the Malay version of the Job Content Questionnaire (JCQ). Southeast Asian J Trop Med Public Health. 2006;37(2):412-6.
6. Escribà-Aguir V, Más Pons R, Flores Reus E. Validación del “Job Content Questionnaire” en personal de enfermeria hospitalario. Gac Sanit. 2001;15(2):142-9. DOI:10.1016/S0213-9111(01)71533-6
7. Finney SJ, DiStefano C. Non-normal and categorical data in structural equation modeling. In: Hancock GR, Mueller RO, editors. Structural equation modeling: a second course. Greenwich: Information Age Publishing; 2006. p.269-314.
8. Fornell C, Larcker DF. Evaluating structural equation models with unobservable variables and measurement error. J Mark Res. 1981;18(1):39-50. DOI:10.2307/3151312
9. Fransson EI, Nyberg ST, Heikkilä K, Alfredsson L, Bacquer D, Batty GD, et al. Comparison of alternative versions of the job demand-control scales in 17 European cohort studies: the IPD-Work consortium. BMC Public Health. 2012;12:62. DOI:10.1186/1471-2458-12-62
10. Griep RH, Rotenberg L, Vasconcellos AGG, Landsbergis P, Comaru CM, Alves MGM. The psychometric properties of demand-control and effort-reward imbalance scales among Brazilian nurses. Int Arch Occup Environ Health. 2009;82(10):1163-72. DOI:10.1007/s00420-009-0460-3
11. Hair JF, Black WC, Babin BJ, Anderson RE, Tatham RL. SEM: confirmatory factor analysis. In: Hair JF, Black WC, Babin BJ, Anderson RE, Tatham RL, editors. Multivariate data analysis. 6.ed. Upper Saddle River: Pearson Prentice Hall; 2006. p.770-842.
12. Hökerberg YH, Aguiar OB, Reichenheim M, Faerstein E, Valente JG, Fonseca MJ, et al. Dimensional structure of the demand control support questionnaire: a Brazilian context. Int Arch Occup Environ Health. 2010;83(4):407-16. DOI:10.1007/s00420-009-0488-4
13. Johnson JV, Hall EM. Job strain, work place social support, and cardiovascular disease: a cross-sectional study of a random sample of the Swedish working population. Am J Public Health. 1988;78(10):1336-42. DOI:10.2105/AJPH.78.10.1336
14. Karasek R, Brisson C, Kawakami N, Houtman I, Bongers P, Amick B. The Job Content Questionnaire (JCQ): an instrument for internationally comparative assessments of psychosocial job characteristics. J Occup Health Psychol. 1998;3(4):322-55. DOI:10.1037/1076-8998.3.4.322
15. Karasek R, Choi B, Ostergren PO, Ferrario M, De Smet P. Testing two methods to create comparable scale scores between the Job Content Questionnaire (JCQ) and JCQ-like questionnaires in the European JACE Study. Int J Behav Med. 2007;14(4):189-201. DOI:10.1080/10705500701638336
16. Karasek R, Theorell T. Healthy work: stress, productivity, and the reconstruction of working life. New York: Basic Books; 1990.
17. Kawakami N, Fujigaki Y. Reliability and validity of the Japanese version of Job Content Questionnaire: replication and extension in computer company employees. Ind Health. 1996;34(4):295-306. DOI:10.2486/indhealth.34.295 10
18. Kline RB. Principles and practice of structural equation modeling. New York: Guilford Press; 2005. (Methodology in the Social Sciences).
19. Landsbergis P, Theorell T, Schwartz J, Greiner BA, Krause N. Measurement of psychosocial workplace exposure variables. Occup Med. 2000;15(1):163-88.
20. Li J, Yang W, Liu P, Xu Z, Cho SI. Psychometric evaluation of the Chinese (mainland) version of Job Content Questionnaire: a study in university hospitals. Ind Health. 2004;42(2):260-7. DOI:10.2486/indhealth.42.260
21. Marsh HW, Muthén B, Asparouhov T, Lüdtke O, Robitzsch A, Morin AJS, et al. Exploratory structural equation modeling, integrating CFA and EFA: application to students’ evaluations of university teaching. Struct Equ Modeling. 2009;16(3):439-76. DOI:10.1080/10705510903008220
22. Mase J, Ota A, Inoue K, Iida T, Tsutsumi A, Yatsuya H, et al. Reliability and validity of the Japanese translated version of the Swedish Demand-Control-Support Questionnaire. Ind Health. 2012;50(6):467-75. DOI:10.2486/indhealth.MS1282
23. Mokkink LB, Terwee CB, Patrick DL, Alonso J, Stratford PW, Knol DL, et al. The COSMIN checklist for assessing the methodological quality of studies on measurement properties of health status measurement instruments: an international Delphi study. Qual Life Res. 2010;19(4):539-49. DOI:10.1007/s11136-010-9606-8
24. Muthén LK, Muthén BO. Mplus statistical analysis with latent variables: user´s guide. 5.ed. Los Angeles: Muthén & Muthén; 1998-2007.
26. Sale JE, Kerr MS. The psychometric properties of Karasek’s demand and control scales within a single sector: data from a large teaching hospital. Int Arch Occup Environ Health. 2002;75(3):145-52. DOI:10.1007/s004200100289
27. Sanne B, Torp S, Mykletun A, Dahl AA. The Swedish Demand-Control-Support Questionnaire (DCSQ): factor structure, item analyses, and internal consistency in a large population. Scand J Public Health. 2005;33(3):166-74. DOI:10.1080/14034940410019217
28. Schreurs PJG, Taris TW. Construct validity of the demand-control model: a double cross-validation approach. Work Stress. 1998;12(1):66-84. DOI:10.1080/02678379808256849
29. Smith CS, Tisak J, Hahn SE, Schmieder RA. The measurement of job control. J Organ Behav. 1997;18(3):225-37. DOI:10.1002/(SICI)1099-1379(199705)18:3<225::AID-JOB797>3.0.CO;2-E
30. Streiner DL, Norman GR. Health measurement scales: a practical guide to their development and use. 4.ed. Oxford: Oxford University Press; 2008.
31. Theorell T. The demand-control-support model for studying health in relation to the work environment: an interactive model. In: Orth-Gomér K, Schneiderman N, editors. Behavioral medicine approaches to cardiovascular disease prevention. Mahwah: Lawrence Erlbaum Associates; 1996, p.69-85.
32. Toivanen S. Social determinants of stroke as related to stress at work among working women: a literature review. Stroke Res Treat. 2012;2012:873678. DOI:10.1155/2012/873678
Article based on the doctoral thesis of Hokerberg YHM, entitled: “Demanda e controle no trabalho e hipertensão arterial: validade dimensional e meta-análise”, presented to the Instituto de Medicina Social of the Universidade do Estado do Rio de Janeiro, in 2010.
The first author was supported by the Conselho Nacional de Desenvolvimento Científico e Tecnológico – CNPq and the Swedish Foundation for International Cooperation in Research and Higher Education – STINT (drn IG2007-2 070) during the sandwich doctoral period in Stockholm (January to April, 2009).
Preliminary versions of this study were presented at the Seminar Series at the Centre for Health Equity Studies in April 2009 and to the second IMS/CHESS workshop: Health and Society in December 2009.