Chronic joint symptoms in adults: A population-based study
SILVIA HELENADE OLIVEIRA MORAIS1, WELLINGTON SEGHETO1, DANIELLE CRISTINA GUIMARÃESDA SILVA1, FRANCE ARAÚJO COELHO1,
VANESSA GUIMARÃES REIS1, FABRÍCIA GERALDA FERREIRA1*, KARINA OLIVEIRA MARTINHO1, ANNA LÍGIA CABRALDA ROCHA2,
MILENE CRISTINE PESSOA3, GIANA ZARBATO LONGO1
1Department of Nutrition and Health, Universidade Federal de Viçosa (UFV), Viçosa, MG, Brazil 2Health Division, UFV, Viçosa, MG, Brazil
3Department of Clinical and Social Nutrition, Universidade Federal de Ouro Preto (UFOP), Ouro Preto, MG, Brazil
S
UMMARYStudy conducted at Universidade Federal
de Viçosa (UFV), Viçosa, MG, Brazil
Article received: 12/29/2016
Accepted for publication: 2/5/2017
*Correspondence:
Address: Rua Augusta Siqueira, 490, Caiçaras
Barbacena, MG – Brazil Postal code: 36205-362
http://dx.doi.org/10.1590/1806-9282.63.07.575
Objective: To analyze factors associated with chronic joint symptoms (CJS) in adults.
Method: A population-based, cross-sectional study was performed with a sample of 1,217 adults aged between 20 and 59 years, in the city of Viçosa, in 2014. The sampling process was performed by conglomerates and sample was selected using a two-stage cluster-sampling scheme. First, 30 of the 99 census tracts of Viçosa were randomly selected using a random sampling scheme, without replacement. Household questionnaires were applied to obtain CJS data, sociodemographic conditions, behavioral factors and health status. Multivariable analysis was conducted using Poisson regression, adjusted for the sampling design effect, using the svy commands in Stata software.
Results: Prevalence of CJS totaled 31.27%, significantly higher in women (18.45). Age ranges 40-49 (PR 1.50; 95CI 1.16-1.92) and 50-59 years (PR 1.55; 95CI 1.07-2.25); overweight (PR 1.60; 95CI 1.28-2.00); obesity (PR 1.60; 95CI 1.11-2.29); and those who self-reported performing heavy work (PR 1.27; 95CI 1.09-1.48) showed higher prevalences of CJS.
Conclusion: Women and individuals who were older, overweight and performing heavy work had a higher risk of CJS in this adult population residing in Viçosa, MG, Brazil.
Keywords: health surveys, rheumatic diseases, joints, adults.
I
NTRODUCTIONChronic joint symptoms (CJS) are defined as the presence of pain, edema, morning stiffness and mobility limitation on most days for a minimum period of six weeks.1 These
symptoms are usually associated with arthritis and can affect individuals at different ages, leading to functional limitations in daily and professional activities.2
The health impact of CJS prevalence estimates is dif-ficult to establish because these symptoms are self-report-ed rather than mself-report-edically diagnosself-report-ed. However, there is evidence that both self-reported symptoms and medical diagnosis have good validity.3 In addition, for population
screening, evaluating CJS is more feasible and may be an alternative for prevention, early diagnosis and insertion of interventions that may reduce the impact of probable chronic arthropathy, as well as the financial cost with expensive drug treatment.
There are reports of CJS prevalence in some countries, such as those found in the telephone health survey of in-dividuals aged 18 years and older in the United States.4 In
this survey, 10% of respondents reported having CJS, reach-ing 33% when reportreach-ing medical diagnosis of arthritis is included. Prevalence in 2005 was 14% in that country.5 In
a survey conducted in Italy, 27% of respondents reported having joint pain/swelling, and 14.7% had morning stiff-ness.6 More recently a population-based survey conducted
in Australia with individuals between 16 and 96 years of age has obtained a prevalence of 11%7 for symptoms. These
differences in prevalence among studies may be related to the way the data are obtained or differences arising from the population, requiring further investigation.
these studies, prevalence rates were respectively 44.2% among elderly individuals from Minas Gerais8 and 45.6%
in an elderly population from São Paulo.9 With adult
populations, to date, the only study found was conduct-ed by Silva et al.,10 who identified a prevalence of 36.5%
in the south of Brazil.
Considering the scarcity of studies, particularly in the adult population, taking into account the impact on productive capacity and quality of life of this population and on the possibility of early identification of diseases such as arthritis, our study aimed to verify the prevalence of CJS and its associations with socioeconomic, demo-graphic, behavioral and biological factors, in adults of Viçosa, Minas Gerais, Brazil.
M
ETHODThis is a cross-sectional, population-based study con-ducted between September 2012 and April 2014 in Viçosa, Minas Gerais. The reference population consisted of adults between 20 and 59 years of age, complete at the time of the research, of both sexes and living in the urban area of the municipality. This age group comprised approximate-ly 52% of the total population, or 43,431 individuals.11
We used Epi-Info software, version 3.5.2®,12 to calculate
the sample size, with the following parameters: reference population (43,431 individuals); confidence level of 95%; expected prevalence of CJS was 36.5%,10 sample error of 4.0
percentage points; and study design effect of 1.7. Ten percent (10%) was added to compensate for declines and losses and 20% to adjust for confounding variables. The calculated sample was 1,217 individuals. It should be emphasized that the sample of our study is probabilistic, composed of con-glomerates and in two stages (census and domicile).
Procedures for data collection included the selection of census tracts, according to recommendations described in the literature. Thirty (30) sectors were selected, without replacement. After sorting the sectors, we identified four blocks for each sector, numbered their corners, and then established the starting point for data collection in each block clockwise, also by drawing lots.
All individuals residing in the household were con-tacted and invited to participate in the study. We considered it a loss when households were visited for at least four times, including a visit at night and at weekends, but the inter-viewer did not locate the individual to be interviewed. Those who declined to participate in the study were contacted again by the study supervisor and, in case the disagreement remained, were counted as refusals. Exclusion criteria were as follows: pregnant women, individuals who were bedrid-den or unable to obtain the measures, and those who had
a mental disability that prevented them from answering the questions in the questionnaire. Data collection was always conducted by a team of professionals trained to apply the questionnaires and the anthropometric measure-ments were performed by a single evaluator with the pur-pose of minimizing variations and maintaining the inter-nal validity of the study. Details on the procedures for planning and carrying out the study can be obtained from the study by Segheto et al.13
The dependent variable included CJS, defined as the affirmative response to the presence of pain or tenderness, swelling or hardening of the joints that lasted most days, for at least one month and a half, considering the last 12 months. The questions were adapted from the arthritis module of the Behavioral Risk Factor Surveillance System.4
As independent variables, the following sociodemo-graphic characteristics were evaluated: sex (male and fe-male); age in years categorized as age group every 10 years; skin color according to Vigitel14 and also categorized as
white or non-white; formal education in years categorized as 0-4 years, 5-8 years, 9-12 years and > 13 years; and social class based on the tool of the Brazilian Association of
Research Companies15 and grouped as upper (A + B),
middle (C) or lower (D + E).
Behavior-related variables included smoking habit and physical activity level (PAL). Smoking was categorized as smokers, former smokers and non-smokers regardless of frequency and amount of cigarettes.16 The level of
physical activity in leisure was assessed according to the International Physical Activity Questionnaire (IPAQ), validated for the Brazilian population,17 including the
fourth domain relating to recreation, sports, exercise or leisure activities. PAL was calculated by adding the time spent with moderate physical activities plus twice the time with vigorous activities, and categorized as irregu-larly active (< 150 minutes of activities in the week) or physically active (≥ 150 minutes of activities in the week).18
Body mass index (BMI) was calculated based on the ratio of body mass to stature squared, both self-reported. We used the criteria proposed by the World Health
Orga-nization (WHO)19 to categorize the BMI (≤ 25 kg/m2 =
adequate; 25 kg/m2 to 29,99 kg/m2 = overweight, and ≥
30 kg/m2 = obese), with low-weight individuals grouped
into the normal weight category.
The self-reported diagnosis of diseases (hypertension, diabetes and arthritis) was evaluated through objective questions.14,20,21 In addition, family history of arthritis or
rheu-matism?” “Do you have the need to lift heavy weights or need a lot of muscular strength during work activities, and do you repeat the same task many times?”10
Control was performed in 10% of the sample, by
tele-phone, with ten random questions being reproduced.13
After these procedures, the data were entered twice in Epi-Data, by previously trained typists, and checked using “data compare.” Consistency checks and analyzes were performed using statistical package Stata version 13.0.22
The analysis was weighted by gender, age and formal education, with weights determined by the ratio of the proportions of individuals, according to the Brazilian Census Bureau – IBGE,11 and in the sample, using svy
commands. Initially, a descriptive analysis of the preva-lence of CJS with its respective confidence intervals (95CI) was performed. Proportions, prevalence ratios and their respective 95% confidence intervals were presented to verify the associations between the dependent and each independent variables. Multiple analysis was performed using Poisson regression. Variables with p<0.20 were
in-cluded in the bivariate analysis, and the criterion for their permanence in the final model was p<0.05.
This project was approved by the Human Research Ethics Committee of Universidade Federal de Viçosa (pro-tocol no. 008/2012). All participants signed an informed consent form in two counterparts prior to the start of data collection.
R
ESULTSMost of the evaluated individuals were young (20-29 years old), non-white, had higher education, belonged to the middle class, did not smoke, were physically inactive, self--reported adequate nutritional status, no diagnosis of hypertension or diabetes mellitus, no family history of arthritis, did not perform heavy work, and always per-formed repetitive tasks (Table 1).
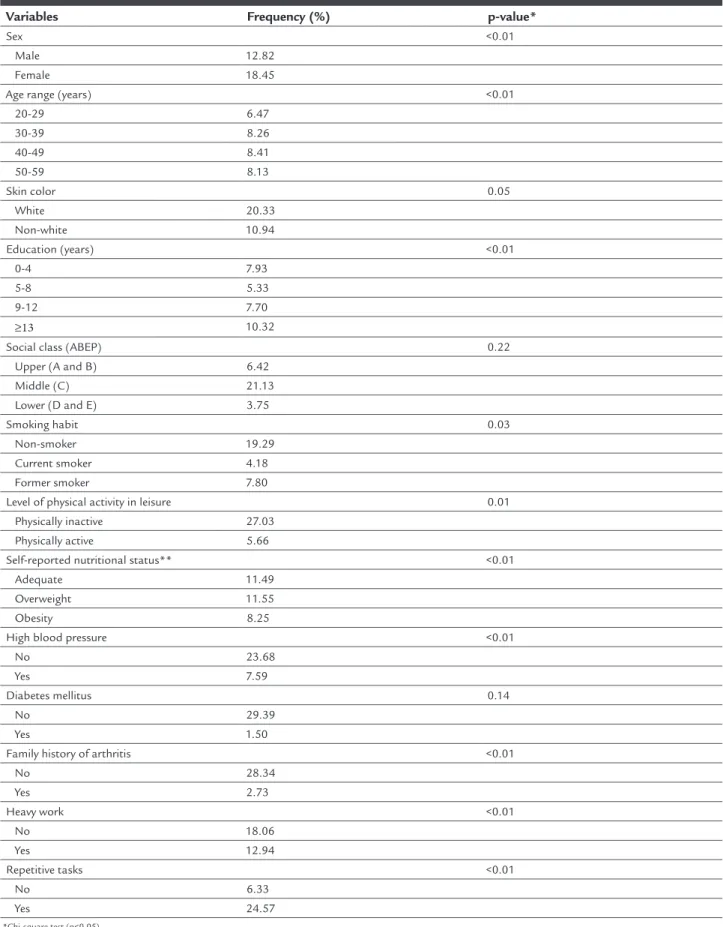
The estimated prevalence of CJS was 31.27%, statisti-cally higher among women and individuals in the age group of 40-49 years. Regarding skin color, there was no difference for the presence of CJS. Chronic joint symptoms
TABLE 1 Sociodemographic, behavioral and health characteristics of the population. Viçosa, MG, 2012-2014.
Variable Proportion (%) Conidence interval (95CI)
Sex
Male 49.20 (45.73-52.67)
Female 50.80 (47.32-54.26)
Age range (years)
20-29 32.78 (24.34-42.50)
30-39 25.24 (21.07-29.91)
40-49 22.93 (18.30-28.31)
50-59 19.05 (15.10-23.74)
Skin color
White 39.60 (33.45-46.09)
Non-white 60.39 (53.90-66.54)
Education (years)
0-4 19.04 (12.32-28.23)
5-8 15.19 (11.30-20.11)
9-12 21.47 (18.09-25.29)
≥13 44.29 (32.57-56.67)
Social class (ABEP)
Upper (A and B) 24.53 (19.00-31.06)
Middle (C) 64.68 (59.92-69.16)
Lower (D and E) 10.77 (7.30-15.61)
Smoking
Non-smoker 65.47 (59.88-70.65)
Current smoker 16.17 (13.16-19.71)
Former smoker 18.35 (13.78-24.01)
were more frequent in individuals with more years of formal education (p<0.01) and belonging to the middle class, with similar distribution in the upper and lower classes (p=0.22). Regarding behavioral characteristics, CJS were more frequent in non-smokers and in physically inactive individuals (p<0.05). Regarding nutritional status, overweight individuals presented a higher prevalence of CJS compared to individuals who self-reported adequate nutritional status or obesity (p<0.01). CJS were more frequent in subjects who reported normal blood pressure and absence of family history of arthritis (p<0.01). Regard-ing the diagnosis of diabetes mellitus, there was no dif-ference between individuals who reported having or not having this diagnosis (p=0.14). As for the performance of heavy work, CJS was more frequent in individuals report-ing that they did not perform such activities; however, 24.57% of the participants reported repetitive work (p<0.01) (Table 2).
Female subjects, those aged 40 to 49 years and 50 to 59 years, those overweight and obese, and those who needed strength for work activities (Table 3) were all as-sociated with CJS.
D
ISCUSSIONStudies of this nature, which estimate the presence of CJS in adults, are still scarce. Our study found a prevalence of CJS of 31.27%, higher than that found in the US pop-ulation,4 as well as in the Italian6 and Australian7
popula-tions, which presented respectively a prevalence of 10, 27 and 11%. In Brazil, a population-based study conducted in the city of Pelotas, Rio Grande do Sul, estimated prev-alence data for CJS at 36.50%.10 The factors associated
with the higher prevalence of CJS are sex, age, overweight and heavy work.
The differences observed in our study regarding the prevalence of CJS compared with those described in other countries4,6,7 may be related to the different characteristics
of each of the populations analyzed, including social class, culture and quality of life, and more. Another important aspect that may have influenced the different prevalences observed when comparing our study with those performed with the North American and European population is the methodology used to investigate CJS. Studies conducted by the Centers for Disease Control and Prevention4 and by
Busija et al.7 were performed by telephone and may have
TABLE 1 (cont.) Sociodemographic, behavioral and health characteristics of the population. Viçosa, MG, 2012-2014.
Variable Proportion (%) Conidence interval (95CI)
Level of physical activity in leisure
Physically inactive 78.03 (71.37-83.49)
Physically active 21.96 (16.50-28.62)
Self-reported nutritional status*
Adequate 50.98 (45.41-56.52)
Overweight 32.64 (28.61-36.95)
Obesity 16.37 (12.55-21.06)
High blood pressure
No 82.77 (78.69-86.20)
Yes 17.22 (13.79-21.30)
Diabetes mellitus
No 94.50 (90.39-96.91)
Yes 5.49 (3.08-9.60)
Family history of arthritis
No 94.65 (93.20-95.81)
Yes 5.34 (4.18-6.79)
Heavy work
No 66.66 (57.34-74.83)
Yes 33.34 (25.17-42.65)
Repetitive tasks
Never 28.30 (22.11-35.42)
Always 71.70 (64.57-77.88)
*The nutritional status was obtained based on the ratio between body mass and squared stature, both self-reported. The cut-off points adopted were ≤ 25 kg/m2 = adequate; 25 kg/m2 to 29.99 kg/
TABLE 2 Prevalence of chronic articular symptoms, according to sociodemographic, behavioral and health variables. Viçosa, MG, 2012-2014.
Variables Frequency (%) p-value*
Sex <0.01
Male 12.82
Female 18.45
Age range (years) <0.01
20-29 6.47
30-39 8.26
40-49 8.41
50-59 8.13
Skin color 0.05
White 20.33
Non-white 10.94
Education (years) <0.01
0-4 7.93
5-8 5.33
9-12 7.70
≥13 10.32
Social class (ABEP) 0.22
Upper (A and B) 6.42
Middle (C) 21.13
Lower (D and E) 3.75
Smoking habit 0.03
Non-smoker 19.29
Current smoker 4.18
Former smoker 7.80
Level of physical activity in leisure 0.01
Physically inactive 27.03
Physically active 5.66
Self-reported nutritional status** <0.01
Adequate 11.49
Overweight 11.55
Obesity 8.25
High blood pressure <0.01
No 23.68
Yes 7.59
Diabetes mellitus 0.14
No 29.39
Yes 1.50
Family history of arthritis <0.01
No 28.34
Yes 2.73
Heavy work <0.01
No 18.06
Yes 12.94
Repetitive tasks <0.01
No 6.33
Yes 24.57
*Chi-square test (p<0.05).
**The nutritional status was obtained based on the ratio between body mass and squared stature, both self-reported. The cut-off points adopted were ≤ 25 kg/m2 = adequate; 25 kg/m2 to 29.99 kg/m2
TABLE 3 Descriptive characteristics and prevalence of CJS according to sociodemographic, behavioral and health factors among adults in Viçosa, MG, 2012-2014.
Variables Gross prevalence ratio (95CI) p-value Adjusted prevalence ratio* p-value
Sex <0.01 <0.01
Male 1.00 1.00
Female 1.39 (1.13-1.72) 1.49 (1.23-1.81)
Age range (years) <0.01 0.02
20-29 1.00 1.00
30-39 1.66 (1.31-2.10) 1.30 (0.99-1.72)
40-49 1.86 (1.47-2.34) 1.50 (1.16-1.92)
50-59 2.16 (1.65-2.83) 1.55 (1.07-2.25)
Skin color 0.06 0.61
White 1.00 1.00
Non-white 1.22 (0.99-1.50) 1.07 (0.82-1.39)
Education (years) <0.01 0.64
≥13 1.00 1.00
9-12 1.54 (1.25-188) 1.15 (0.76-1.74)
5-8 1.50 (1.19-1.89) 1.29 (0.74-2.24)
0-4 1.79 (1.30-2.45) 0.86 (0.55-1.35)
Social class (ABEP) 0.11 0.55
Upper (A and B) 1.00 1.00
Middle (C) 1.25 (0.99-1.58) 1.21 (0.94-1.56)
Lower (D and E) 1.33 (0.85-2.08) 1.06 (0.75-1.52)
Smoking habit 0.07 0.42
Non-smoker 1.00 1.00
Current smoker 0.88 (0.59-1.30) 0.90 (0.60-1.36)
Former smoker 1.44 (1.05-1.98) 1.11 (0.80-1.56)
Level of physical activity in leisure 0.15 0.42
Irregularly active 1.00 1.00
Physically active 0.84 (0.66-1.07) 1.12 (0.83-1.51)
Self-reported nutritional status** <0.01 <0.01
Adequate 1.00 1.00
Overweight 1.59 (1.26-2.02) 1.60 (1.28-2.00)
Obesity 2.00 (1.37-2.92) 1.60 (1.11-2.29)
High blood pressure <0.01 0.83
No 1.00 1.00
Yes 1.54 (1.25-1.90) 0.66 (0.30-1.44)
Diabetes mellitus 0.60 0.33
No 1.00 1.00
Yes 0.88 (0.53-1.44) 1.01 (0.71-1.56)
Family history of arthritis 0.01 0.09
No 1.00
Yes 1.37 (1.07-1.76) 1.23 (0.96-1.56)
Heavy work <0.01 <0.01
No 1.0 1.00
Yes 1.43 (1.19-1.72) 1.27 (1.09-1.48)
Repetitive tasks 0.02 0.38
No 1.00 1.00
Yes 1.53 (1.08-2.17) 1.06 (0.92-1.22)
CJS: chronic joint symptoms. *All variables were adjusted.
**The nutritional status was obtained based on the ratio between body mass and squared stature, both self-reported. The cut-off points adopted were ≤ 25 kg/m2 = adequate; 25 kg/m2 to 29.99
underestimated the prevalence of CJS by excluding indi-viduals who do not own a telephone.
Regarding the difference in prevalence between the sexes, we found that the prevalence was higher in women (RP 1.38; 95CI 1.13-1.69) compared to men, corroborating the study by Silva et al.,10 which showed a prevalence 1.5
times higher (95CI 1.3-1.6) than in men. The literature states that the highest estimate of CJS prevalence in women may be related to differences and variations in the profile of female sex hormones.23,24 In addition,
hor-monal variations in association with overweight may trigger an endocrine imbalance of systemic repercussion that will act to destroy joint cartilage.25
We observed an increase in the prevalence of CJS with age, so that in the age group from 40 to 49 and 50 to 59 years the prevalence of CJS was 1.50 times (95CI 1.16-1.92) and 1.55 times (95CI 1.07-2.25) higher compared to the age group 20-29 years. These results are similar to those observed in other studies.7,9,10 Aging promotes a
physio-logical wear of the joints that, combined with insuffi-ciency in the repair of articular cartilage, mainly in the presence of comorbidities,25,26 can render the prevalence
higher in older individuals.
Similar to other studies,10,27 overweight and obesity
were associated with increased prevalence of CJS. One explanation for this association is the mechanical stress caused by excess weight28,29 and the proinflammatory
properties of some adipocytokines,10 such as visfatin.30
Reducing body weight could be a strategy aimed at de-creasing the prevalence of CJS in adults.
Performing heavy work was associated with the pres-ence of CJS. Importantly, organic tissues need to have a sufficient amount of function and tension to maintain their integrity.31 If this tension does not have adequate
stress, there may be atrophy and, in case of excessive stress to the organic capacity, degenerative changes.31 This may
be related to the response to cumulative mechanical stress on the joints, which can cause symptoms from an early stage of osteoarthritis.10
CJS can cause functional limitation, decrease in qual-ity of life and emotional disturbance in the study popula-tion. The clinical significance of symptom complaint is uncertain, but the identification of its prevalence and associated factors, especially those modifiable, may con-tribute to early diagnosis and establishment of interven-tions that reduce the impact of future arthropathy.
In order to reduce the prevalence of CJS and limit its impact on the individual, society and public health agen-cies, the following strategies are recommended: broaden-ing access to primary health care; promotbroaden-ing education
among patients, the general population and health pro-fessionals; encouraging weight control and appropriate practice of physical activity; and raising awareness of er-gonomics at work. The results of our study may serve as a basis for the implementation of public policies, through educational programs aimed at the self-care of adults with chronic joint symptoms to prevent future disabilities. Despite all the methodological procedures followed for the development of our study, such as sample selection, interview training, and quality control, our study has lim-itations, one of which is to obtain estimates for CJS based on self-report not medically confirmed. However, it is not feasible for population studies to perform clinical exams because they are more expensive than self-report. Another important limitation is the occurrence of memory bias related to the pain, swelling and hardening of the joints in the last 30 days prior to the home interview, which may underestimate the prevalence of these factors. Finally, it is impossible to establish a causal line according to the tem-porality of the study design. Nevertheless, estimates of the prevalence of self-reported chronic diseases have been con-sidered a simple and objective way to obtain health infor-mation, with good levels of agreement with data on the actual prevalence of the disease in the population.32
We thus conclude that the prevalence of CJS is high. There was a positive and independent association between CJS and female gender, age, overweight, obesity and heavy work. By identifying potentially modifiable factors as-sociated with CJS, such as nutritional status and work overload, it is possible to establish early intervention strategies that result in the minimization of future risks of osteoarticular disease. In addition, studies using this approach and performing this type of screening may prevent future disability.
R
ESUMOSintomas articulares crônicos em adultos: um estudo de base populacional
Objetivo: Analisar os fatores associados aos sintomas articulares crônicos (SAC) em adultos.
apli-cação de questionário contendo questões relativas a variá-veis de SAC, sociodemográficas, comportamentais e de saúde. Para verificar as associações, apresentaram-se pro-porções, razões de prevalência e seus respectivos intervalos de confiança de 95%. A análise múltipla foi realizada por meio da regressão de Poisson, utilizando o conjunto de comandos svy do software Stata, o qual considera o efeito da expansão da amostra na análise dos dados.
Resultados: A prevalência estimada de SAC foi de 31,27%, maior nas mulheres (18,45%). Estiveram associadas ao SAC as mulheres (RP 1,49; IC95% 1,23-1,81); as idades de 40 e 49 (RP 1,50; IC95% 1,16-1,92) e 50 e 59 anos (RP 1,55; IC95% 1,07-2,25); o sobrepeso (RP 1,60; IC95% 1,28-2,00); a obesidade (RP 1,60; IC95% 1,11-2,29); e aqueles que autorreferiram realização de trabalho pesado (RP 1,27; IC95% 1,09-1,48).
Conclusão: O sexo feminino, a faixa etária de 40 a 59 anos, o sobrepeso, a obesidade e a realização de trabalho pesado foram fatores de risco para SAC em adultos de Viçosa, MG.
Palavras-chave: inquéritos epidemiológicos, doenças reumáticas, articulações, adultos.
R
EFERENCES1. Silva VR. Sintomas articulares crônicos em adultos de Pelotas/RS – Prevalência e determinantes [dissertation]. Pelotas: Faculdade de Medicina, Universidade Federal de Pelotas; 2008.
2. Feinglass J, Nelson C, Lawther T, Chang WR. Chronic joint symptoms and prior arthritis diagnosis in community surveys: implications for arthritis prevalence estimates. Public Health Rep. 2003; 118(3):230-9.
3. Rasooly I, Papageorgiou AC, Badley EM. Comparison of clinical and self reported diagnosis for rheumatology outpatients. Ann Rheum Dis. 1995; 54(10):850-2.
4. Centers for Disease Control and Prevention (CDC). Prevalence of self-reported arthritis or chronic joint symptoms among adults--United States, 2001. MMWR Morb Mortal Wkly Rep. 2002; 51(42):948-50.
5. Bolen J, Helmick CG, Sacks JJ, Gizlice Z, Potter C. Should people who have joint symptoms, but no diagnosis of arthritis from a doctor, be included in surveillance efforts? Arthritis Care Res (Hoboken). 2011; 63(1):150-4. 6. Cimmino MA, Parisi M, Moggiana GL, Maio T, Mela GS. Prevalence of
self-reported peripheral joint pain and swelling in an Italian population: the Chiavari study. Clin Exp Rheumatol . 2001; 19(1):35-40.
7. Busija L, Buchbinder R, Osborne RH. Quantifying the impact of transient joint symptoms, chronic joint symptoms, and arthritis: a population-based approach. Arthritis Rheum . 2009; 61(10):1312-21.
8. Machado GP da M, Barreto SM, Passos VM de A, Lima-Costa MFF de. Projeto Bambuí: prevalência de sintomas articulares crônicos em idosos. Rev Assoc Med Bras. 2004; 50(4):367-72.
9. Falsarella GR, Coimbra IB, Barcelos CC, Costallat LTL, Carvalho OMF, Coimbra AM. Prevalence and factors associated with rheumatism and ch-ronic joint symptoms in elderly community. Geriatr Gerontol Int. 2013; 13(4):1043-50.
10. Silva VRL da, Menezes AMB, Noal RB. [Chronic joint symptoms in adults from Pelotas, Rio Grande do Sul State, Brazil: prevalence and determinants]. Cad Saúde Pública. 2009; 25(12):2571-82.
11. Instituto Brasileiro de Geografia e Estatística (IBGE). Censo Demográfico 2010. Características da população e dos domicílios. Rio de Janeiro; 2010. 12. Dean AG. Epi Info, version 6: a word processing, database, and statistics program for epidemiology on microcomputers. Atlanta: Centers for Disease Control and Prevention; 1994. p. 1-602.
13. Segheto W, Silva DCG, Coelho FA, Reis VG, Morais SHO, Marins JCB, et al. Body adiposity index and associated factors in adults: method and logistics of a population-based study. Nutr Hosp. 2015; 32(1):101-9.
14. Ministério da Saúde. Vigitel Brasil 2012: Secretaria de Vigilância em Saúde, Secretaria de Gestão Estratégica e Participativa. VIGITEL Brasil 2011: vigilância de fatores de risco e proteção para doenças crônicas por inquérito telefônico. Brasília; 2012.
15. Associação Brasileira de Empresas de Pesquisa-ABEP. Critérios de classificação econômica. São Paulo; 2012.
16. Steele EM, Claro RM, Monteiro CA. Behavioural patterns of protective and risk factors for non-communicable diseases in Brazil. Public Health Nutr. 2014; 17(2):369-75.
17. Pardini R, Matsudo S, Araújo T, Matsudo V, Andrade E, Braggion G, et al. Validation of the international physical activity questionnaire (IPAQ version 6): pilot study in Brazilian young adults. Med Sci Sports Exerc. 1997; 29(6):S5-S9.
18. Haskell WL, Lee I-M, Pate RR, Powell KE, Blair SN, Franklin BA, et al. Physical activity and public health updated recommendation for adults from the American College of Sports Medicine and the American Heart Association. Med Sci Sport Exerc. 2007; 39(8):1423-34.
19. World Health Organization. Obesity: preventing and managing the global epidemic. Report of a WHO consultation. (WHO Technical Report Series 894). Geneva: World Health Organization; 2000.
20. Rodrigues IG, Barros MB de A. Osteoporose autorreferida em população idosa: pesquisa de base populacional no município de Campinas, São Paulo. Rev Bras Epidemiol . 2016; 19(2):294-306.
21. Bonotto GM, Mendoza-Sassi RA, Susin LRO. Conhecimento dos fatores de ris-co modificáveis para doença cardiovascular entre mulheres e seus fatores associa-dos: um estudo de base populacional. Ciênc Saúde Coletiva. 2016; 21(1):293-302. 22. Stata Corp. Stata Statistical Software Release 13.0. College Station, Px: Stata
Corporation; 2013.
23. Karlson EW, Mandl LA, Hankinson SE, Grodstein F. Do breast-feeding and other reproductive factors influence future risk of rheumatoid arthritis? Results from the Nurses’ Health Study. Arthritis Rheum. 2004; 50(11):3458-67. 24. Richette P, Corvol M, Bardin T. Estrogens, cartilage, and osteoarthritis. Joint
Bone Spine. 2003; 70(4):257-62.
25. Breedveld FC. Osteoarthritis--the impact of a serious disease. Rheumatology. 2004; 43(Suppl 1):4i-8.
26. Ward BW, Schiller JS, Goodman RA. Multiple chronic conditions among US adults: a 2012 update. Prev Chronic Dis. 2014; 11:E62.
27. Miller CW, James NT, Fos PJ, Zhang L, Wall P, Welch C. Health status, physical disability, and obesity among adult Mississippians with chronic joint symptoms or doctor-diagnosed arthritis: findings from the Behavior Risk Factor Surveillance System, 2003. Prev Chronic Dis. 2008; 5(3):A85. 28. Felson DT. Does excess weight cause osteoarthritis and if so, why? Ann
Rheum Dis. 1996; 55(9):668-70.
29. Centers for Disease Control and Prevention (CDC). Prevalence and impact of arthritis among women--United States, 1989-1991. MMWR Morb Mortal Wkly Rep. 1995; 44(17):329-34.
30. Sippel C, Bastian RM de A, Giovanella J, Faccin C, Contini V, Dal Bosco SM. Inflammatory processes of obesity. Rev Atenção à Saúde. 2014; 12(42):48-56. 31. Amadio AC, Serrão JC. Contextualização da biomecânica para a investigação do movimento: fundamentos, métodos e aplicações para análise da técnica esportiva. Rev Bras Educ Física e Esporte. 2007; 21(Esp):61-85.