Levels of uric acid and increased diastolic blood pressure:
Risk factors for atrial fibrillation in patients older than 60 years
YANIEL CASTRO-TORRES1*, NABEEL YAR KHAN2, RAIMUNDO CARMONA-PUERTA3
1Hospital Universitario Celestino Hernández Robau, Santa Clara, Villa Clara, Cuba 2Policlínico Aracelio Rodríguez Castellón, Cumanayagua, Cienfuegos, Cuba 3Cardiocentro Ernesto Che Guevara, Santa Clara, Villa Clara, Cuba
S
UMMARYStudy conducted at Policlínico Aracelio Rodríguez Castellón, Cumanayagua, Cienfuegos, and at Hospital Universitario Celestino Hernández Robau, Santa Clara, Villa Clara, Cuba
Article received: 11/27/2016
Accepted for publication: 12/19/2016
*Correspondence:
Address: Luz Caballero, 161 e/Hospital y Alejandro Oms. Santa Clara, Villa Clara – Cuba Postal code: 50200 [email protected] [email protected]
http://dx.doi.org/10.1590/1806-9282.63.07.600
Objective: To characterize the maximum P-wave duration (Pmax) and P-wave dispersion (PWD) according to blood pressure (BP) and uric acid (UA) levels in geriatric patients.
Method: An analytical study was performed in 83 patients aged over 60 years treated at the Family Medical Office 5 of the Aracelio Rodríguez Castellón Polyclinic, in Cienfuegos, Cuba between January and December 2015. The sample was divided into two groups (patients with hyperuricemia and patients with normal UA levels).
Results: We found a linear and significant correlation between diastolic BP and Pmax in patients with hyperuricemia (r=0.695; p=0.026), but not in patients with normal UA (r=0.048; p=0.757). A linear and significant correlation was demonstrated between diastolic BP and PWD in patients with hyperuricemia (r=0.657; p=0.039), but not in patients with normal UA (r=0.054; p=0.730). Conclusion: There is correlation between diastolic BP and Pmax plus PWD in elderly patients with hyperuricemia.
Keywords: atrial fibrillation, risk factor, P-wave, P-wave dispersion, uric acid, geriatrics.
I
NTRODUCTIONCardiovascular diseases are the leading cause of morbid-ity and mortalmorbid-ity worldwide. They currently account for approximately 1/3 of global deaths.1 Atrial fibrillation (AF) is the most frequent cardiac arrhythmia found in clinical practice. Its prevalence is close to 33.5 million people, and it is associated with an increased risk of car-diovascular complications and decline in the quality of life of patients.2,3 Traditionally, advanced age, high blood pressure (HBP), heart failure, valvular heart disease, isch-emic heart disease and diabetes mellitus have been con-sidered risk factors for developing AF. On the other hand, recent studies have shown that increased plasma levels of uric acid (UA) constitute a risk factor for AF. Accumula-tion of UA in the body increases the acAccumula-tion of pro-inflam-matory substances, raises the levels of oxidative stress and boosts the activity of the renin-angiotensin-aldosterone system, favoring the development of AF.4-8
During the last few years, useful electrocardiograph-ic markers have been developed to predelectrocardiograph-ict AF. Some have been proposed, such as maximum (Pmax)9 and minimum
P-wave duration,10 P-wave terminal force in lead V111 and P-wave dispersion (PWD).12-15
Although AF has been associated with increased blood pressure (BP) and UA levels, there are still no studies worldwide that address the relation between Pmax plus PWD and BP plus UA in patients over 60 years of age, in whom there is an increased risk of AF. Taking these ele-ments into account, our study aimed to characterize Pmax and PWD according to BP and UA levels in geriatric pa-tients in a health clinic.
M
ETHODby UA > 357 mmol/L in women and > 425 mmol/L in men, according to the reference parameters of the labo-ratory used for the investigation. Patients using anti-gout drugs, patients with gouty arthritis, acute or chronic renal failure, lymphomas or leukemia or who refused to participate in the study were excluded. In both of the groups, clinical, anthropometric, laboratory and elec-trocardiographic variables were collected.
Data collection
Each patient underwent a medical interview for collection of the clinical variables of the study that were reflected in a survey designed for this purpose. The individual autonomy of each patient was respected regarding par-ticipation in the study. Individuals who were not able to answer the questions or did not meet the inclusion and exclusion criteria were not interviewed. The patients sought medical consultation for three consecutive days, where the clinical and anthropometric variables were obtained. BP was checked for three consecutive days and an average of three readings was obtained. BP was always recorded by the same staff members, either a licensed nurse or the doctor in the practice. The requirements for an appropriate BP check were considered as recommend-ed by current HBP guidelines.16 A properly calibrated sphygmomanometer KANGJU model KT-A02 distrib-uted by the Ministry of Public Health of Cuba was used. The weight and height of the patients were obtained using a scale and a stadiometer, respectively. Both were properly calibrated.
Laboratory variables were obtained from a single sample of fasting blood. The conventional method was used for sample analysis, and all values were presented according with the International System of Units.
Each patient underwent an electrocardiogram. Elec-trocardiograms were conducted with the patients in supine position by an expert who guaranteed their ad-equate performance. The ECG device was a CARDIOCID BB made in Cuba. All electrocardiograms were recorded at a speed of 25 mm/s and 1 mV voltage = 10 mm. ECG results were digitized for further analysis. The measure-ments were made using a digital caliper by two experts on the subject. Electrocardiograms with artifacts were excluded, as well as those with measurable P-waves in less than 10 leads. P-wave maximum and minimum duration were obtained from the maximum and mini-mum values obtained for these parameters, respective-ly. PWD is defined as the difference between the maxi-mum and minimaxi-mum P-wave duration, taking into account the 12 ECG leads.
Data analysis and processing
The collected data was analyzed using Statistical Package for the Social Sciences (SPSS) for Windows Version 21.0. The results were displayed in tables and statistical graphs. Qualitative variables were shown as absolute and relative frequencies. Statistical analysis of the qualitative variables was performed using Chi-square.
Quantitative variables were expressed as arithmetic mean ± standard deviation. Kolmogorov-Smirnov test was performed to determine the distribution of the quantitative variables. Variables with a normal distribution were exam-ined using the Student’s t-test, while those without a nor-mal distribution were analyzed by the Wilcoxon Test. Pear-son’s linear correlation test was performed to determine the association between Pmax plus PWD and diastolic blood pressure (DBP) in both groups. Based on the results of the linear regression analysis, the test was adjusted tak-ing into account the followtak-ing variables: personal history of hypertension, diabetes mellitus and body mass index. A p-value < 0.05 was considered statistically significant.
Our research was approved by the Ethics Committee of the Aracelio Rodríguez Castellón Polyclinic, in Cu-manayagua, Cienfuegos, Cuba.
R
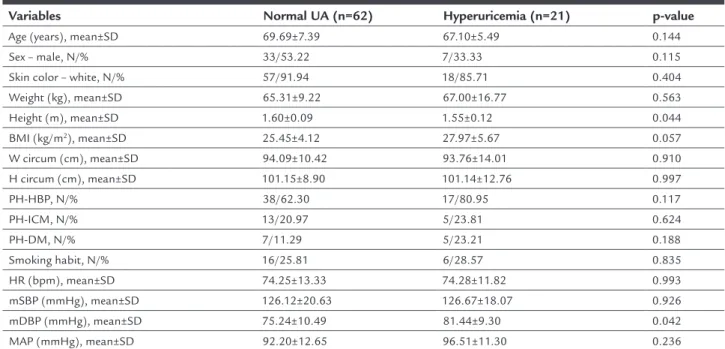
ESULTSHyperuricemia was present in 25.3% of patients. Cases with hyperuricemia have a higher frequency of personal history of HBP, ischemic heart disease, diabetes mellitus and smoking (80.95 vs. 62.30%, 23.81 vs. 20.97%, 23.21 vs. 11.29%, 28.57 vs. 25.81%, respectively), although with-out significant differences. Weight and body mass index are higher in cases with hyperuricemia, although without statistical significance (67.00±16.77 kg vs. 65.31±9.22 kg; p=0.563, and 27.97±5.67 kg/m2 vs. 25.45±4.12 kg/m2; p=0.057). Patients with hyperuricemia have higher mean DBP values compared to those with normal UA (81.44±9.30 vs. 75.24±10.49; p=0.042).
Figure 1 shows that there is a linear and significant correlation between mean DBP and Pmax in patients with hyperuricemia (r=0.695; p=0.026), but not in patients with normal UA levels (r=0.048; p=0.757).
Figure 2 shows that there is a linear and significant cor-relation between the mean DBP and PWD in patients with hyperuricemia (r=0.657; p=0.039), but not in patients with normal UA (r=0.054; p=0.730).
D
ISCUSSIONTable 1 shows the characterization of the sample ac-cording to clinical and anthropometric variables in both study groups. It can be observed that certain traditional risk factors such as history of HBP, body mass index and smoking are found more frequently in patients with hy-peruricemia compared to those with normal UA. Chuan et al.8 found that patients with hyperuricemia have a significantly higher body mass index than patients with normal UA (24.5±3.7 kg/m2 vs. 23.0±3.4 kg/m2; p≤0.0001). In another study evaluating the risk of AF in patients with and without hyperuricemia, the authors demonstrated that patients in the third quartile of UA levels have a prevalence of HBP of 20.4%, while 13.5 and 12.0%, respec-tively, were in the lower quartiles.17 Recently, a study of 1,296 patients over 60 years of age with AF investigating the prevalence of left ventricular hypertrophy showed that hypertension has a higher prevalence among patients with hyperuricemia compared to those with normal UA (77.8 vs. 74.2%).18
Hyperuricemia is a recognized risk factor for cardio-vascular disease. Increased UA levels have been associated with the development of coronary artery disease, HBP, diabetes mellitus and heart failure,19 so it is common for cardiovascular risk factors such as HBP, obesity and smok-ing to be more prevalent in patients with hyperuricemia. Increased UA may also be part of a complex process in which other cardiovascular risk factors are involved. This process could be the cause of higher levels of oxidative
stress and systemic inflammation favoring the develop-ment of cardiac diseases including AF.
In our investigation, mean systolic blood pressure (SBP), mean DBP, and mean BP are higher in patients with hyperuricemia. These results are consistent with several previous investigations. Sun et al.20 conducted case-control research on 11,956 patients in China in order to determine the association between UA levels and the risk of AF. They found that among other risk factors, SBP and DBP are significantly higher in patients with hyperuricemia com-pared to patients with normal UA (145.9±23.8 mmHg vs. 141.2±23.4 mmHg; p<0.01, and 85.7±12.7 mmHg vs. 81.5±11.5 mmHg; p<0.01, respectively). In this investiga-tion, the authors also found that high levels of UA repre-sent a risk factor for developing AF.
High levels of UA have been shown to be a risk factor for HBP.21,22 Hyperuricemia is equally common in pre-hy-pertensive patients. Some studies have shown that the prev-alence of hyperuricemia is 40-60% in patients with uncon-trolled hypertension.23 In animal models, it has been observed that there is a direct correlation between plasma levels of UA and BP. In these cases, the use of drugs inhibiting the enzyme xanthine oxidase decreases UA levels and BP.24
Several pathophysiological mechanisms have been proposed to explain this association. In laboratory rats with hyperuricemia, the development of microvascular renal disease with histological changes similar to athero-sclerosis precedes the development of HBP.25 Experiments
TABLE 1 Clinical variables in patients with hyperuricemia and normal UA.
Variables Normal UA (n=62) Hyperuricemia (n=21) p-value
Age (years), mean±SD 69.69±7.39 67.10±5.49 0.144 Sex – male, N/% 33/53.22 7/33.33 0.115 Skin color – white, N/% 57/91.94 18/85.71 0.404 Weight (kg), mean±SD 65.31±9.22 67.00±16.77 0.563 Height (m), mean±SD 1.60±0.09 1.55±0.12 0.044 BMI (kg/m2), mean±SD 25.45±4.12 27.97±5.67 0.057
W circum (cm), mean±SD 94.09±10.42 93.76±14.01 0.910 H circum (cm), mean±SD 101.15±8.90 101.14±12.76 0.997 PH-HBP, N/% 38/62.30 17/80.95 0.117 PH-ICM, N/% 13/20.97 5/23.81 0.624
PH-DM, N/% 7/11.29 5/23.21 0.188
Smoking habit, N/% 16/25.81 6/28.57 0.835 HR (bpm), mean±SD 74.25±13.33 74.28±11.82 0.993 mSBP (mmHg), mean±SD 126.12±20.63 126.67±18.07 0.926 mDBP (mmHg), mean±SD 75.24±10.49 81.44±9.30 0.042 MAP (mmHg), mean±SD 92.20±12.65 96.51±11.30 0.236
developed in cultured cells demonstrate that increased levels of UA induce cell proliferation, inflammation, ox-idative stress and activation of the local renin-angioten-sin system.26,27
The relation between UA and HBP seems to be con-sistent in numerous investigations and our study supports these results. As previously discussed, hyperuricemia and HBP are risk factors for the development of AF, so the control of these factors may represent a therapeutic al-ternative for patients with this type of arrhythmia.
Figures 1 and 2 show that there is a significant cor-relation between mean DBP and Pmax plus PWD in pa-tients with hyperuricemia but not in papa-tients with normal UA. Currently, there are no studies that reproduce these results, so our work is the first to demonstrate the relation between DBP and markers of AF and their relation with UA levels. Increased values of AF predictors associated with DBP makes us reason that there is an increased risk in these patients to develop this type of arrhythmia. This risk is marked in cases with hyperuricemia. A previous
study evaluating cardiovascular reactivity and its relation with PWD in normotensive and hypertensive patients demonstrates that there is a correlation between DBP reactivity and Pmax.28
Bearing in mind the alterations of HBP in the heart, and the relation between UA levels and the development of AF, the results of our study are justified. High DBP and hyperuricemia lead to atrial changes favoring an increase in electrical pulse duration and heterogeneity in the atria. These changes, in turn, lead to increased Pmax and PWD. Based on these findings, we can hypothesize that regardless of whether or not the person is hypertensive, in patients over 60 years of age with hyperuricemia there is an increase in the values of AF markers that accompany a rise in DBP that, theoretically, predisposes these patients to AF.
The main limitation of our study was the cross-sec-tional design, which prevented the knowledge of patients who might have developed AF. Similarly, the size of the sample and the absence of variables reflecting the patients’ inflammatory status could influence the results.
FIGURE 1 Linear correlation between mean DBP and Pmax values adjusted by personal history of high blood pressure, diabetes mellitus and body mass index in patients with hyperuricemia and normal UA.
UA: uric acid; Pmax: maximum P-wave duration; mDBP: mean diastolic blood pressure.
Pmax (ms).
100.00
95.00
90.00
85.00
80.00
75.00
70.00
mDBP (mmHg)
60 80 100 120
r=0.048; p=0.757
r=0.695; p=0.026
C
ONCLUSIONThere is correlation between Pmax/PWD and DBP values in patients with hyperuricemia.
R
ESUMENNiveles de ácido úrico y presión arterial diastólica elevada: factores de riesgo de fibrilación atrial en pacientes mayo-res de 60 años
Objetivo: Caracterizar la máxima duración de la onda P (Pmáx) y la dispersión de la onda P (DP) según las cifras de tensión arterial (TA) y los niveles de ácido úrico (AU) en pacientes geriátricos.
Método: Se realizó un estudio analítico en 83 pacientes mayores de 60 años pertenecientes al Consultorio Médi-co de la Familia 5 del PoliclíniMédi-co Aracelio Rodríguez Cas-tellón, Cienfuegos, Cuba entre enero y diciembre de 2015. La muestra se dividió en dos grupos (pacientes con hipe-ruricemia y pacientes con AU normal).
Resultados: Existe correlación lineal y significativa entre la tensión arterial diastólica y la Pmáx en los pacientes con hiperuricemia (r=0,695; p=0,026), mas no en los pacientes con AU normal (r=0,048; p=0,757). Se demuestra correla-ción lineal y significativa entre la tensión diastólica y la DP en los pacientes con hiperuricemia (r=0,657; p=0,039), aunque no en los pacientes con AU normal (r=0,054; p=0,730), respectivamente.
Conclusión: Existe correlación entre la Pmáx y la DP y las cifras de tensión arterial diastólica en pacientes geriá-tricos con hiperuricemia.
Palabras claves: fibrilación atrial, factor de riesgo, onda P, dispersión de la onda P, ácido úrico, geriatría.
R
EFERENCES1. Mendis S. The contribution of the Framingham Heart Study to the prevention of cardiovascular disease: a global perspective. Prog Cardiovasc Dis. 2010; 53(1):10-4.
2. Chugh SS, Rothy GA, Gillum RF, Mensah GA. Global burden of atrial fibrillation in developed and developing nations. Glob Heart. 2014; 9(1):113-9.
PWD (ms).
75.00
70.00
65.00
60.00
55.00
50.00
45.00
40.00
35.00
30.00
25.00
20.00
mDBP (mmHg)
50 60 70 80 90 100 110 120 r=0.054; p=0.730
r=0.657; p=0.039
Plasma UA levels Normal Hyperuricemia
FIGURE 2 Linear correlation between mean DBP and PWD adjusted by personal history of high blood pressure, diabetes mellitus and body mass index in patients with hyperuricemia and normal UA.
3. Baena-Díez JM, Grau M, Forés R, Fernández-Bergés D, Elosua R, Sorribes M et al. Prevalencia de fibrilación auricular y factores asociados en España, análisis de seis estudios de base poblacional. Estudio DARIOS. Rev Clin Esp. 2014; 214(9):505-12.
4. Koza Y, Simsek Z, Hakan Tas M. Uric acid levels and atrial fibrillation. Angiology. 2014; 65(2):168.
5. Tamariz L, Agarwal S, Soliman EZ, Chamberlain AM, Prineas R, Folsom AR, et al. Association of serum uric acid with incident atrial fibrillation (from the Atherosclerosis Risk in Communities [ARIC] Study). Am J Cardiol. 2011; 108(9):1272-6.
6. Valbusa F, Bertolini L, Bonapace S, Zoppini G, Arcaro G, Byrne CD, et al. Relation of elevated serum uric acid levels to incidence of atrial fibrillation in patients with type 2 diabetes mellitus. Am J Cardiol. 2013; 112(4):499-504. 7. Tamariz L, Hernandez F, Bush A, Palacio A, Hare JM. Association between serum uric acid and atrial fibrillation: a systematic review and meta-analysis. Heart Rhythm. 2014; 11(7):1102-8.
8. Chuang SY, Wu CC, Hsu PF, Chia-Yu Chen R, Liu WL, Hsu YY, et al. Hyperuricemia and incident atrial fibrillation in a normotensive elderly population in Taiwan. Nut Metab Cardiovas Dis. 2014; 24(9):1020-6. 9. Caldwell J, Koppikar S, Barake W, Redfearn D, Michael K, Simpson C, et al.
Prolonged P-wave duration is associated with atrial fibrillation recurrence after successful pulmonary vein isolation for paroxysmal atrial fibrillation. J Interv Card Electrophysiol. 2014; 39(2):131-8.
10. Chang IC, Austin E, Krishnan B, Benditt DG, Quay CN, Ling LH, et al. Shorter minimum P-wave duration is associated with paroxysmal lone atrial fibrillation. J Electrocardiol. 2014; 47(1):106-12.
11. Tereshchenko LG, Henrikson CA, Sotoodehnia N, Arking DE, Agarwal SK, Siscovick DS, et al. Electrocardiographic deep terminal negativity of the P wave in V1 and risk of sudden cardiac death: The Atherosclerosis Risk in Communities (ARIC) Study. J Am Heart Assoc. 2014; 3(6):e001387. 12. Yamada T, Fukunami M, Shimonagata M, Kumagai K, Sanada S, Ogita H, et
al. Dispersion of signal-averaged P wave duration on precordial body surface in patients with paroxysmal atrial fibrillation. Eur Heart J. 1999; 20(3):211-20. 13. Chandy J, Nakai T, Lee RJ, Bellows W, Dzankic S, Leung J. Increases in P-wave dispersion predict postoperative atrial fibrillation after coronary artery bypass graft surgery. Anesth Analg. 2004; 98(2):303-10.
14. Salah A, Zhou S, Liu Q, Yan H. P wave indices to predict atrial fibrillation recur-rences post pulmonary vein isolation. Arq Bras Cardiol. 2013; 101(6):519-27. 15. Dogan U, Dogan EA, Tekinalp M, Tokgoz OS, Aribas A, Akilli H, et al. P-wave dispersion for predicting paroxysmal atrial fibrillation in acute ischemic stroke. Int J Med Sci. 2012; 9(1):108-14.
16. Mancia G, Fagard R, Narkiewicz K, Redón J, Zanchetti A, Böhm M, et al.; Task Force Members. 2013 ESH/ESC Guidelines for the management of hypertension: the Task Force for the Management of Arterial Hypertension of the European Society of Hypertension (ESH) and of the European Society of Cardiology (ESC). Eur Heart J. 2013; 34(28):2159-219.
17. Chao TF, Hung CL, Chen SJ, Wang KL, Chen TJ, Lin YJ, et al. The association between hyperuricemia, left atrial size and new-onset atrial fibrillation. Int J Cardiol. 2013; 168(4):4027-32.
18. Liang WY, Liu WW, Liu ML, Xiang W, Feng XR, Huang B, et al. Serum uric acid level and left ventricular hypertrophy in elderly male patients with nonvalvular atrial fibrillation. Nutr Metab Cardiovasc Dis. 2016; 26(7):575-80.
19. Feig DI, Kang DH, Johnson RJ. Uric acid and cardiovascular risk. N Engl J Med. 2008; 359(17):1811-21.
20. Sun GZ, Guo L, Wang J, Ye N, Wang XZ, Sun YX. Association between hyperuricemia and atrial fibrillation in rural China: a cross-sectional study. BMC Cardiovasc Disord. 2015; 15:98.
21. Forman JP, Choi H, Curhan GC. Plasma uric acid level and risk for incident hypertension among men. J Am Soc Nephrol. 2007; 18(1):287-92. 22. Acevedo A, Benavides J, Chowdhury M, Lopez M, Pena L, Montenegro A, et
al. Hyperuricemia and cardiovascular disease in patients with hypertension. Conn Med 2016; 80(2):85-90.
23. Cannon PJ, Stason WB, Demartini FE, Sommers SC, Laragh JH. Hyperuricemia in primary and renal hypertension. N Engl J Med. 1966; 275(9):457-64.
24. Edwin K, Garrison JC. Renina y angiotensina. In: Goodman & Gilman, editors. Las bases farmacológicas de la terapéutica médica. McGraw-Hill. México DF; 1996. v.2, p. 791-3.
25. Mazzali M, Kanellis J, Han L, Feng L, Xia YY, Chen Q, et al. Hyperuricemia induces a primary renal arteriolopathy in rats by a blood pressure-indepen-dent mechanism. Am J Physiol Renal Physiol. 2002; 282(6):F991-7. 26. Kang DH, Park SK, Lee IK, Johnson RJ. Uric acid-induced C-reactive protein
expression: implication on cell proliferation and nitric oxide production of human vascular cells. J Am Soc Nephrol. 2005; 16(12):3553-62. 27. Corry DB, Eslami P, Yamamoto K, Nyby MD, Makino H, Tuck ML. Uric acid
stimulates vascular smooth muscle cell proliferation and oxidative stress via the vascular renin-angiotensin system. J Hypertens. 2008; 26(2):269-75. 28. Carmona Puerta R, Chávez González E, Hurtado González K, Rizo Rivero