Development and validation of a food frequency
questionnaire (FFQ-Porto Alegre) for adolescent,
adult and elderly populations from Southern
Brazil
Desenvolvimento e validação de um questionário
de freqüência alimentar (QFA-Porto Alegre) para
a população de adolescentes, adultos e idosos
do Sul do Brasil
1 Programa de Pós-graduação em Saúde Coletiva, Universidade do Vale do Rio dos Sinos, São Leopoldo, Brasil.
2 Faculdade de Medicina, Universidade Federal do Rio Grande do Sul, Porto Alegre, Brasil.
3 Hospital de Clínicas de Porto Alegre, Universidade Federal do Rio Grande do Sul, Porto Alegre, Brasil. Correspondence S. C. Fuchs
Programa de Pós-graduação em Epidemiologia, Faculdade de Medicina, Universidade Federal do Rio Grande do Sul. Rua Ramiro Barcelos 2600, sala 415, Porto Alegre, RS 90035-003, Brasil. [email protected]
Ruth Liane Henn 1
Sandra Costa Fuchs 2
Leila Beltrami Moreira 2
Flavio Danni Fuchs 3
Abstract
This study assessed the validity of a food frequen-cy questionnaire (FFQ-Porto Alegre), covering 135 food items, in comparison with the average of two consecutive 24-hour dietary recall question-naires for adolescents, adults, and elderly who were randomly selected from a population-based survey. The Pearson correlation coefficients and cross-classification by quartiles of intake were used. The nutrients were log transformed and energy adjusted. The mean of adjusted de-atten-uated correlation coefficient for adolescents was 0.44 and ranged from 0.18 (zinc) to 0.69 (folate) and for adult and elderly participants they were, respectively, 0.42, ranging from 0.16 (iron) to 0.73 (energy) and 0.52, ranging from 0.25 (vitamin E) to 0.84 (energy). The average classification per-centage into the same or adjacent quartile for the two methods was 74.6% for adolescents, 74.9% for adults, and 81.2% for the elderly population. The FFQ showed fair relative validity for adoles-cents and adults, and may be used to study the dietary determinants of obesity and non-trans-missible diseases in epidemiological surveys.
Food Consumption; Questionnaires; Validation Studies; Aged; Adolescent
Introduction
The establishment of overall eating patterns – the combination of foods and nutrients consumed by individuals 1 – makes it possible to identify the determinants of overweight, which are as-sociated with high blood pressure 2 and other non-transmissible diseases 3. There are several methods for the assessment of food and nutri-ent consumption and energy intake, including 24-hour recall (24hR), food diary, food frequency questionnaire (FFQ), and biomarkers 4. All meth-ods have advantages and limitations and the choice among them depends on the purpose for which the information is intended. The 24hR is based on gathering information on the consump-tion of drinks and foods in a period of 24 hours, through the interview. In the food diary, all foods and beverages consumed in one or more days are recorded by the participant. On the other hand, the FFQ is based on the frequency of consump-tion of each item from a list of foods, for a period of time ranging from months to a year. It is based on the premise that the ingestion of food for a longer period of time is more appropriate when it comes to assessing the association between dietary patterns and chronic diseases. The 24hR and the FFQ are the most frequently used tools in epidemiological studies nowadays 4,5.
done and described in an appropriate manner. The FFQ development requires several decisions about food selection, the number of items to be investigated, and the method for measuring the portion sizes, if the FFQ is quantitative. Valida-tion is usually performed using a food diary 6 or 24hR 7,8,9 as the reference method. In general, the validity is determined through correlation coef-ficients, comparing the average intake, obtained via the FFQ and the reference method, as well as the classification of individuals according to the nutrient intake distribution in both methods 10.
In this study, we described the development and validation of a FFQ in two populations – ado-lescents and adults – living in Porto Alegre, the capital of Rio Grande do Sul State in Brazil, who were randomly selected to participate in a popula-tion-based study (SOFT Study – Syndrome of Obe-sity and Risk Factors for Cardiovascular Diseases).
Methods
FFQ development
In order to identify food items that should be part of the FFQ, 268 individuals between the ages of 12 and 90 were selected at schools, universities, and recreational areas for the elderly population, in Porto Alegre and the Metropolitan area. The sam-ple comprised 61 adolescents (14.9 ± 1.3 years), 120 adults (30.2 ± 10.9 years) and 87 elderly (68.7 ± 7.5 years) who completed a 24hR. The reported food items were compared to those identified in a population-based study, conducted in Rio de Ja-neiro, Brazil 11. The list of foods and preparations reported in Porto Alegre was similar to that of Rio de Janeiro. However, fourteen food items that were part of FFQ in Rio de Janeiro – for instance, angu, okra, yam, cará, oxtail – did not take part in the food list that was developed for the FFQ-Porto Alegre. Another 64 food items were added includ-ing nuts (walnuts, almonds, chestnuts), polenta, lentils, sushi, sashimi, tofu, etc. The decision was initially based upon the frequency of consump-tion (5% or more), but excepconsump-tions included food items that represent the influence of German, Italian, Japanese, and southern Brazilian cuisine. This food list was tested again and some changes were made, particularly in the amount of food items of the FFQ, with a reduction in the number of items through its aggregation. The inclusion of options related to the frequency, quantity and portions of the foods was pre-tested in groups of persons with different ages and education lev-els. The final version of the FFQ was pre-tested and contained 135 food items. Figure 1 shows the Portuguese version of the FFQ.
FFQ validation
The SOFT Study investigated adolescents (12-19) and adults (20-90 years of age) using a cross-sectional design, from a population-based sam-pling from Porto Alegre. Details of the study can be found elsewhere 12. In this validity study, a sub-sample of 127 adolescents and 127 adults was selected through a simple random sampling based on the previous household mapping. The sample size was based on the recommendation that 100-200 subjects should be interviewed 5. Participants were interviewed at home by nutri-tionists and graduate students, certified to apply the instruments, and participants responded at the same interview to two 24hR and one FFQ. The 24hR investigated the food intake of two con-secutive periods of 24 hours prior to the inter-view and the FFQ surveyed the food intake of the last 12 months. The application of the two dietary surveys was randomized in order to minimize potential bias increasing the awareness and af-fecting the answers given in the second method.
In the FFQ, the information on food intake was converted into daily intake (grams or mil-liliters). In the 24hR, all food items, preparation methods, recipes, quantity and size of portions were recorded, as well as the brand of industrial-ized products. The portion size was documented from the album of photographs of different foods and household items, usually employed for their measurement 13. Quality control procedures in-cluded the food survey supervision, and repeated interviews, with additional questioning if needed. The nutritional analysis of food intake in the FFQ and 24hR was performed using the Programa de Apoio à Nutrição, developed by the Center for Health Informatics at the Federal University in São Paulo. Some food items that were not part of the database of the program were added based on the Table for Evaluation of Food Consumption in Household Measures 14 and the food labels.
Other variables under study
Do <MÊS> do ano passado até agora, quantas vezes por dia ou por semana ou por mês ou por ano você comeu os alimentos que eu vou citar? Quantos meses do ano? Quantas <PORÇÕES> você comeu a cada vez?
Alimentos Quantas vezes Unidade de tempo Quantidade
0 1 2 3 4 5 6 7 8 9 10 Outro D S M A Meses/Ano
Cacetinho/Bisnaguinha ( ) UP ( ) UG
Sanduíche de presunto e queijo/ Torrada
( ) Unidade
Pão (sanduíche/forma/leite/caseiro/ manteiga/batata)
( ) Fatia
Pão (integral/centeio/trigo/aveia) ( ) Fatia
Pão light ( ) Fatia
Sanduíche natural ( ) Unidade
Cuca/Pão doce ( ) FP ( ) FM ( ) FG
Bolo ( ) FP ( ) FM ( ) FG
Pão de queijo ( ) UP ( ) UM ( ) UG
Bolacha (doce/recheada) ( ) Unidade ( ) Pacote
Bolacha salgada ( ) Unidade ( ) Pacote
Sucrilhos ( ) 1/2 PS ( ) PS ( ) XP ( ) XM ( ) XG
Aveia/Germe de trigo/Granola ( ) CSopa
Barra de cereal ( ) Unidade
Nescau, Toddy ou outros ( ) CChá ( ) CSopa
Milk shakes/Batida ( ) CP ( ) CM ( ) CG
Leite integral ( ) CP ( ) CM ( ) CG
Leite desnatado ( ) CP ( ) CM ( ) CG
Leite semi-desnatado ( ) CP ( ) CM ( ) CG
Leite de soja ( ) CP ( ) CM ( ) CG
Iogurte integral ( ) Pote ( ) GP ( ) GG
Iogurte (desnatado/light) ( ) Pote ( ) GP ( ) GG
Requeijão normal/Käshimier ( ) Ponta de faca ( ) CChá
Requeijão light ( ) Ponta de faca ( ) CChá
Queijo (mussarela/lanche/colonial/ provolone)
( ) FP ( ) FM ( ) FG
Queijo (branco/minas/ricota) ( ) FP ( ) FM ( ) FG
Creme de leite/Nata ( ) CChá ( ) CSopa
Leite condensado ( ) CChá ( ) CSopa
Manteiga/Margarina normal ( ) Ponta de faca ( ) CChá
Margarina light ( ) Ponta de faca ( ) CChá
Maionese normal ( ) Ponta de faca ( ) CChá
Maionese light ( ) Ponta de faca ( ) CChá
Mortadela/Salame/Murcilha/Presunto gordo
( ) FP ( ) FM ( ) FG
Presunto magro/Peito de peru/ Chester
( ) FP ( ) FM ( ) FG
Mel/Geléia/Chimia/Uvada/Goiabada/ Figada/Pessegada/Marmelada
( ) Ponta de faca ( ) CChá
Geléia diet/Chimia diet ( ) CChá ( ) CSopa
Salada de frutas ( ) CP ( ) CM ( ) CG ( ) Pote
Figure 1
Food frequency questionnaire used in the Syndrome of Obesity and Risk Factors for Cardiovascular Diseases (SOFT Study).
Abacate ( ) UP ( ) UG
Abacaxi ( ) FP ( ) FG
Banana ( ) UP ( ) UM ( ) UG
Caqui ( ) UP ( ) UG
Laranja/Bergamota ( ) UP ( ) UG
Maçã/Pêra ( ) UP ( ) UG
Mamão/Papaia ( ) Fatia ( ) Unidade
Melancia ( ) FP ( ) FM ( ) FG
Melão ( ) FP ( ) FM ( ) FG
Morango ( ) UP ( ) UG
Pêssego/Ameixa ( ) UP ( ) UG
Uva ( ) CaP ( ) CaM ( ) CaG
Suco de laranja ( ) CP ( ) CM ( ) CG
Suco de frutas natural ( ) CP ( ) CM ( ) CG
Sucos artificiais adoçados ( ) CP ( ) CM ( ) CG
Arroz branco ( ) CSopa
Arroz integral ( ) CSopa
Feijão/Lentilha ( ) CoP ( ) CoM ( ) CoG
Grão de bico ( ) CoP ( ) CoM ( ) CoG
Canjica ( ) CoP ( ) CoM ( ) CoG
Salada de batata ou maionese ( ) CSopa
Batata cozida ( ) UP ( ) UM ( ) UG
Nhoque ( ) CSopa ( ) Pegador
Batata frita ( ) Pegador ( ) Porção
Aipim cozido ( ) PP ( ) PM ( ) PG
Aipim frito/Polenta frita ( ) PP ( ) PM ( ) PG
Polenta (cozida/assada) ( ) CSopa ( ) PP ( ) PM ( ) PG
Bolinho de arroz ou batata ( ) Unidade
Macarrão/Massas ( ) Pegador ( ) CSopa
Panqueca/Canelone/Rondele ( ) Unidade
Lasanha ( ) PP ( ) PM ( ) PG
Abóbora/Moranga ( ) CSopa
Abobrinha/Chuchu ( ) CSopa
Agrião/Alface/Chicória/Radiche/ Rúcula
( ) Pires ( ) Folhas
Salada misturada ( ) CSopa ( ) Pires
Beterraba (crua/cozida) ( ) CSopa
Brócolis/Couve/Espinafre ( ) CSopa ( ) Ramo
Cebola (crua/assada) ( ) CSopa
Cenoura (crua/cozida) ( ) CSopa
Couve-flor ( ) CSopa ( ) Ramo
Milho verde ( ) EspigaP ( ) EspigaM
Milho enlatado ( ) CSopa
Repolho ( ) CSopa
Vagem ( ) CSopa
Figure 1 (continued)
Do <MÊS> do ano passado até agora, quantas vezes por dia ou por semana ou por mês ou por ano você comeu os alimentos que eu vou citar? Quantos meses do ano? Quantas <PORÇÕES> você comeu a cada vez?
Alimentos Quantas vezes Unidade de tempo Quantidade
0 1 2 3 4 5 6 7 8 9 10 Outro D S M A Meses/Ano
(continues)
Tomate cru ( ) UP ( ) UM ( ) UG
Legumes variados ( ) CSopa
Legumes empanados fritos ( ) Ramo ( ) Rodela
Sopa de legumes ou de verduras ( ) CoP ( ) CoM ( ) CoG
Sopa com arroz/massa/capeletti ( ) CoP ( ) CoM ( ) CoG
Ovo/Omelete/Ovo mexido ( ) Unidade ( ) CSopa
Cachorro-quente/Xis de carne ou frango
( ) Unidade
Pastelão/Empadão/Quiche ( ) PP ( ) PM ( ) PG
Pizza ( ) FP ( ) FM ( ) FG
Pastel/Coxinha/Rissoles/Croquete (fritos)
( ) UP ( ) UM ( ) UG
Guisado/Almôndega ( ) CSopa ( ) Unidade
Churrasco ( ) PP ( ) PM ( ) PG
Carne de gado ( ) PP ( ) PM ( ) PG
Frango com pele ( ) PP ( ) PM ( ) PG
Frango sem pele ( ) PP ( ) PM ( ) PG
Carne de porco ( ) PP ( ) PM ( ) PG
Carne de soja ( ) CSopa
Bucho/Mondongo ( ) CSopa ( ) Prato
Vísceras (moela/fígado) ( ) Pedaço ( ) CSopa
Coraçãozinho ( ) Unidade
Bacon/Toucinho Registrar só a freqüência
Lingüiça/Salsichão ( ) Unidade ( ) CSopa
Salsicha ( ) UP ( ) UM ( ) UG
Peixe (fresco/congelado) ( ) PP ( ) PM ( ) PG
Tofu ( ) Fatia
Sushi ( ) Unidade
Sashimi ( ) Fatia
Sardinha/Atum (conserva) ( ) Lata ( ) CSopa
Camarão ( ) CSopa ( ) Unidade
Chocolate em barra/Bombom ( ) UP ( ) UM ( ) UG
Brigadeiro/Negrinho/Doce com chocolate
( ) Unidade
Pudim/Ambrosia/Doce de leite/Arroz doce/Flan
( ) CSopa ( ) PP ( ) PM ( ) PG
Sorvete ( ) CSopa ( ) Bola
Sorvete light ( ) CSopa ( ) Bola
Tortas em geral ( ) PP ( ) PM ( ) PG
Fruta em calda ( ) PP ( ) PM ( ) PG
Café preto passado ( ) XP ( ) XM ( ) XG
Café expresso ( ) XP ( ) XM ( ) XG
Café solúvel ( ) CChá
Café cappuccino ( ) XP ( ) XM ( ) XG
Figure 1 (continued)
Do <MÊS> do ano passado até agora, quantas vezes por dia ou por semana ou por mês ou por ano você comeu os alimentos que eu vou citar? Quantos meses do ano? Quantas <PORÇÕES> você comeu a cada vez?
Alimentos Quantas vezes Unidade de tempo Quantidade
0 1 2 3 4 5 6 7 8 9 10 Outro D S M A Meses/Ano
Chá ( ) XP ( ) XM ( ) XG
Chimarrão ( ) Cuia ( ) Térmica
Água (fora café/chá) ( ) CP ( ) CM ( ) CG
Refrigerante ( ) CP ( ) CM ( ) CG
Refrigerante (diet/light) ( ) CP ( ) CM ( ) CG
Açúcar ( ) CChá ( ) CSopa
Adoçante (líquido/pó) ( ) Gotas ( ) Sachês
Amendoim/Nozes/Castanha-do-Pará/ Castanha de caju
( ) Punhado ( ) Unidade
Uva passa ( ) CSopa
Guloseimas/Paçoquinha/ Rapadurinha/Maria-mole/ Merenguinho/Puxa-puxa
( ) Unidade
Bala/Chiclete ( ) Unidade
Pipoca ( ) SaP ( ) SaM ( ) SaG
Chips/Fandango/Milhopã ( ) SaP ( ) SaM ( ) SaG
Outro
International Obesity Task Force (IOTF) guide-lines, corresponding to overweight (BMI ≥ 25kg/ m2) at the age of 18 years 16.
Data analysis
Each food item in the FFQ and 24hR was mea-sured as a continuous variable, multiplying the number of times that each item was consumed by its frequency (daily, weekly, monthly, or annu-al) and by the number of months per year that the food was consumed. The amount was based on the number of portions in predetermined sizes, whether in natural units, household measures, or weights and volumes of usually consumed portions 14. The consumption of nutrients and energy was transformed by natural logarithm to obtain normal distributions, through the formula log (x+1) 17.
Mean ± standard deviation and ratio of the average consumption of nutrients and energy
were determined for the FFQ and for the average of two consecutive 24hR. Differences between methods were tested through a paired t test for log-transformed data. In order to assess the rela-tive validity between the FFQ and the average of the two 24hR, Pearson correlations were calcu-lated for non-adjusted nutrients and nutrients corrected for energy. Energy-adjusted nutrient intakes were computed as the residuals from the linear regression model with total caloric intake as the independent variable and absolute nu-trient intake as the dependent variable 4. As the residuals vary from person to person and may have negative values, a constant was added to them. The constant for each nutrient was calcu-lated as the nutrient intake for the average energy intake of the sample 4. As daily variations in the intra-individual food intake could attenuate the correlations between the FFQ and the reference method, the correlation coefficients were cor-rected by the ratio of the intra- and
ual variances, obtained by analysis of variance of a classification criterion in both recalls 4, through the following equation:
rv = ro (1 + λ/n)1/2;
where rv is the true correlation, ro is the correla-tion observed between the FFQ and average of the 24hR, λ is the intra- and inter-individual vari-ance ratio in the 24hR, and n is the number of replicates, which comprised two recalls. The cor-relation coefficients between 0.4 and 0.7 indicate a good concordance between both diet evalua-tion methods 4.
The concordance between the FFQ and aver-age of the 24hR was assessed via classification of individuals according to their distribution in energy and nutrient quartiles. The exact con-cordance percentage (classification in the same quartile by both methods), classification in the same quartile or an adjacent quartile, and dis-agreement (classification in opposite quartiles) were calculated. SPSS version 14 (SPSS Inc., Chi-cago, USA) was used for data analysis.
Results
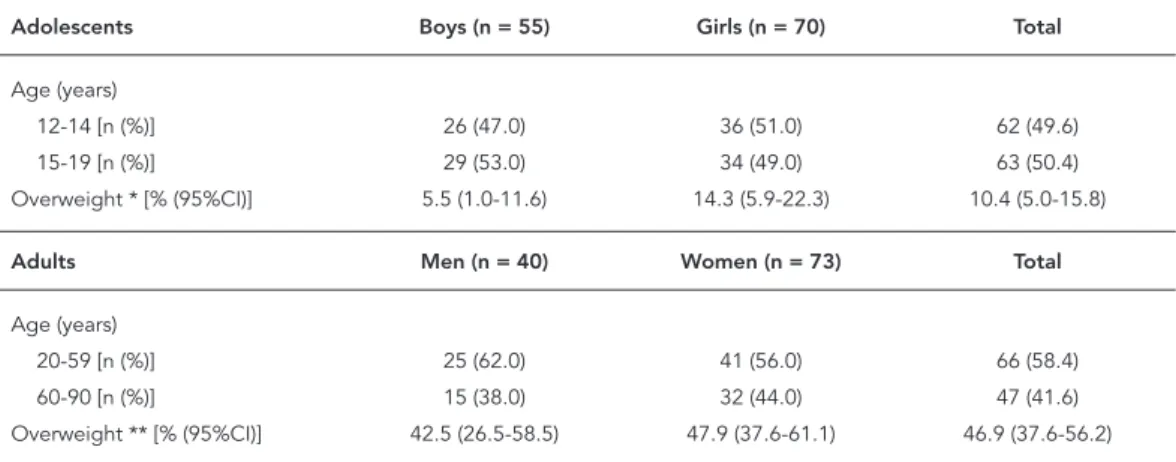
From a total of 127 participants randomly se-lected for the validity study, 13 declined to par-ticipate, representing 10.2% of refusals, and one participant was excluded from the analysis for being on a diet, for a diagnostic procedure. Among the 127 randomly selected adolescents (12-19 years of age), 125 provided complete data for the validity study. Among 113 adults aged 55
± 18 years, 42% were 60 years old or older, there was a predominance of women, and 46.9% were overweight (Table 1). In the adolescent popula-tion, 56% were girls, had an average 15 ± 2 years of age and 10.4% were overweight.
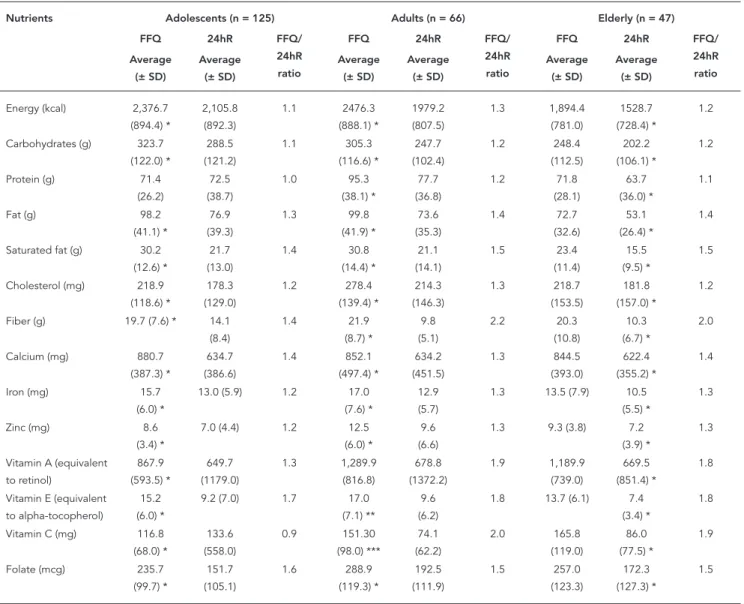
Table 2 shows statistically significant differ-ences between the estimated consumption from the FFQ and the average of the two 24hR for adult and elderly participants. The exception was the protein intake among teenagers, the average consumption of which was similar (p = 0.5). The absolute intake of macro- and micronutrients detected by the FFQ was higher than that of the 24hR, particularly for fiber, vitamins A, E, C for adults and elderly participants, as the ratio of consumption in the FFQ was about twice that in the 24hR.
The not adjusted correlation coefficient be-tween the two methods of food consumption investigation – FFQ and 24hR – ranged from 0.31 (vitamin E) to 0.57 (calcium) among ado-lescents (Table 3), 0.29 (vitamin E) to 0.66 (cal-cium) among adults, and 0.34 (vitamin E) to 0.69 (vitamin C) among the elderly. The adjusted and de-attenuated correlation coefficients for most nutrients were higher than 0.50 for elderly par-ticipants, yet only five and four of them had co-efficients equal to or higher than 0.50 for adults and adolescents, respectively. Overall, the energy adjustment increased the magnitude of correla-tion coefficients, except for fiber and vitamins A and C among the elderly, and calcium for adoles-cents. There was an increase in the de-attenuated and energy-adjusted coefficients for most
nutri-Table 1
Characteristics of participants in the validity study of the food frequency questionnaire (FFQ) among adolescents and adults in the Syndrome of Obesity and Risk Factors for Cardiovascular Diseases (SOFT Study).
Adolescents Boys (n = 55) Girls (n = 70) Total
Age (years)
12-14 [n (%)] 26 (47.0) 36 (51.0) 62 (49.6)
15-19 [n (%)] 29 (53.0) 34 (49.0) 63 (50.4)
Overweight * [% (95%CI)] 5.5 (1.0-11.6) 14.3 (5.9-22.3) 10.4 (5.0-15.8)
Adults Men (n = 40) Women (n = 73) Total
Age (years)
20-59 [n (%)] 25 (62.0) 41 (56.0) 66 (58.4)
60-90 [n (%)] 15 (38.0) 32 (44.0) 47 (41.6)
Overweight ** [% (95%CI)] 42.5 (26.5-58.5) 47.9 (37.6-61.1) 46.9 (37.6-56.2)
* BMI by age and sex, corresponding to BMI ≥ 25kg/m2 at 18 years old;
ents, but vitamin E for adults and cholesterol for adolescents. The average de-attenuated energy correlation coefficients for adults (r = 0.42) and adolescents (r = 0.44) were similar (Table 3), but lower than for the elderly (r = 0.52).
Table 4 shows that the agreement between methods for food intake in the same quartile or in an adjacent quartile was 69% or more for all the nutrients, except fat and zinc among adolescents, above 70% for most nutrients, except vitamin E, iron, zinc, and folate among adults, and for the elderly greater than 0,72 for all nutrients except carbohydrates. On average, 75% of the adults and
adolescents and 81% of the elderly were classi-fied in the same or in an adjacent quartile by both methods. Considering the error in the classifica-tion of consumpclassifica-tion quartiles, an average of 6.2% of adolescents and 6.1% of adults were in oppo-site quartiles versus 3% of the elderly.
Discussion
In this study we described the development of a FFQ with 135 food items, providing details for the assessment of its suitability as well as for replica-Table 2
Average intake of energy, macronutrients and micronutrients estimated by the food frequency questionnaire (FFQ), 24-hour recall (24hR) survey, and the ratio between both methods in adolescents, adults < 60 years and adults ≥ 60 years in the Syndrome of Obesity and Risk Factors for Cardiovascular Diseases
(SOFT Study).
Nutrients Adolescents (n = 125) Adults (n = 66) Elderly (n = 47)
FFQ 24hR FFQ/
24hR ratio
FFQ 24hR FFQ/
24hR ratio
FFQ 24hR FFQ/
24hR ratio Average (± SD) Average (± SD) Average (± SD) Average (± SD) Average (± SD) Average (± SD)
Energy (kcal) 2,376.7 (894.4) * 2,105.8 (892.3) 1.1 2476.3 (888.1) * 1979.2 (807.5) 1.3 1,894.4 (781.0) 1528.7 (728.4) * 1.2
Carbohydrates (g) 323.7 (122.0) * 288.5 (121.2) 1.1 305.3 (116.6) * 247.7 (102.4) 1.2 248.4 (112.5) 202.2 (106.1) * 1.2
Protein (g) 71.4 (26.2) 72.5 (38.7) 1.0 95.3 (38.1) * 77.7 (36.8) 1.2 71.8 (28.1) 63.7 (36.0) * 1.1
Fat (g) 98.2
(41.1) * 76.9 (39.3) 1.3 99.8 (41.9) * 73.6 (35.3) 1.4 72.7 (32.6) 53.1 (26.4) * 1.4
Saturated fat (g) 30.2 (12.6) * 21.7 (13.0) 1.4 30.8 (14.4) * 21.1 (14.1) 1.5 23.4 (11.4) 15.5 (9.5) * 1.5
Cholesterol (mg) 218.9 (118.6) * 178.3 (129.0) 1.2 278.4 (139.4) * 214.3 (146.3) 1.3 218.7 (153.5) 181.8 (157.0) * 1.2
Fiber (g) 19.7 (7.6) * 14.1 (8.4) 1.4 21.9 (8.7) * 9.8 (5.1) 2.2 20.3 (10.8) 10.3 (6.7) * 2.0
Calcium (mg) 880.7 (387.3) * 634.7 (386.6) 1.4 852.1 (497.4) * 634.2 (451.5) 1.3 844.5 (393.0) 622.4 (355.2) * 1.4
Iron (mg) 15.7 (6.0) *
13.0 (5.9) 1.2 17.0 (7.6) *
12.9 (5.7)
1.3 13.5 (7.9) 10.5 (5.5) *
1.3
Zinc (mg) 8.6 (3.4) *
7.0 (4.4) 1.2 12.5 (6.0) *
9.6 (6.6)
1.3 9.3 (3.8) 7.2 (3.9) *
1.3
Vitamin A (equivalent to retinol) 867.9 (593.5) * 649.7 (1179.0) 1.3 1,289.9 (816.8) 678.8 (1372.2) 1.9 1,189.9 (739.0) 669.5 (851.4) * 1.8
Vitamin E (equivalent to alpha-tocopherol)
15.2 (6.0) *
9.2 (7.0) 1.7 17.0 (7.1) **
9.6 (6.2)
1.8 13.7 (6.1) 7.4 (3.4) *
1.8
Vitamin C (mg) 116.8 (68.0) * 133.6 (558.0) 0.9 151.30 (98.0) *** 74.1 (62.2) 2.0 165.8 (119.0) 86.0 (77.5) * 1.9
Folate (mcg) 235.7 (99.7) * 151.7 (105.1) 1.6 288.9 (119.3) * 192.5 (111.9) 1.5 257.0 (123.3) 172.3 (127.3) * 1.5
tion elsewhere. Thereafter we present the valida-tion of this quesvalida-tionnaire by comparing it with the average of two 24hR. There was a satisfactory global agreement for energy, macronutrients, and micronutrients. However, the energy and nu-trient consumption was higher in the FFQ than in the 24hR. This disparity was previously described for a validity study conducted in a population of French adults and adolescents 18. A similar result was also detected among Greek adolescents, even though the FFQ was compared with the average of three 24hR 19. In South Asian immigrants living in the United Kingdom, the absolute energy and nutrient intake estimated by a FFQ was higher than in 24hR, yet an extreme variation for some nutrients was identified, such as 71% for vitamin C and 10% for vitamin B12 20.
The FFQ may be biased by the list of food items used. The number of items necessary to es-tablish a dietary pattern is a matter of judgment, since a low number may underestimate and a
high number may overestimate consumption. The higher consumption of fiber and vitamins by the adult and elderly population, detected in our study, could be explained by the number of fruits and vegetables investigated in the FFQ 4. An alternative explanation for the differences in favor of the FFQ is the predetermined size of the portions used to quantify the food intake, which may differ from those reported using an album of photographs in 24hR 21. On the other hand, there are reports showing higher estimates in the ref-erence method 6, other presenting equivalence between the methods 7, or variable directions de-pending on the type of nutrient 8. In addition, the period to which subjects report the consump-tion, two days in the 24-hour recall and one year in the FFQ, is a potential source of bias for food items not consumed on a daily basis.
The 24hR is widely used as a reference meth-od in fometh-od frequency questionnaire validation studies, but their sources of error may not be Table 3
Correlation coeffi cients between the food frequency questionnaire (FFQ) and the average of both 24-hour recall (24hR) surveys for adults and adolescents in the Syndrome of Obesity and Risk Factors for Cardiovascular Diseases (SOFT Study) (n = 238) *.
Nutrients Adolescents (n = 125) Adults (n = 66) Elderly (n = 47)
Not adjusted
Adjusted for energy **
Adjusted and de-attenuated ***
Not adjusted
Adjusted for energy **
Adjusted and de-attenuated
***
Not adjusted
Adjusted for energy **
Adjusted and de-attenuated ***
Energy (kcal) 0.49 - 0.64 # 0.60 - 0.73 # 0.76 - 0.84 #
Carbohydrate (g) 0.53 0.26 0.32 0.56 0.45 0.53 0.67 0.39 0.43
Protein (g) 0.54 0.31 0.41 0.58 0.42 0.55 0.73 0.46 0.51
Fat (g) 0.43 0.26 0.34 0.59 0.42 0.54 0.68 0.47 0.55
Saturated fat (g) 0.39 0.32 0.34 0.64 0.36 0.47 0.67 0.50 0.58
Cholesterol (mg) 0.46 0.30 0.30 0.58 0.51 0.64 0.60 0.55 0.67
Fiber (g) 0.46 0.40 0.57 0.44 0.33 0.40 0.46 0.48 0.51
Calcium (mg) 0.57 0.62 0.73 0.66 0.56 0.63 0.62 0.58 0.64
Iron (mg) 0.48 0.33 0.45 0.49 0.13 0.16 0.51 0.28 0.31
Zinc (mg) 0.35 0.10 0.18 0.44 0.17 0.25 0.60 0.38 0.45
Vitamin A (equivalent to retinol)
0.40 0.36 0.41 0.21 0.16 0.26 0.44 0.46 0.61
Vitamin E (equivalent to alpha-tocopherol)
0.31 0.16 0.21 0.29 0.06 0.07 0.34 0.22 0.25
Vitamin C (mg) 0.50 0.49 0.55 0.37 0.35 0.47 0.69 0.70 0.77
Folate (mcg) 0.45 0.43 0.69 0.41 0.19 0.24 0.46 0.32 0.36
Average 0.45 0.32 0.44 0.49 0.32 0.42 0.59 0.45 0.52
* Analysis performed with logarithmically transformed nutrients (natural log); ** Adjusted for energy according to the residual method;
*** Corrected for the intra-individual variation in both 24-hour recall (24hR);
independent, since both methods are based on memory 4. The specific weekday investigated by the 24hR may have influenced the estimation of nutrient intake, since, in Southern Brazil, people usually have a barbecue on Sundays, which prob-ably accounts for a higher consumption of meat compared to other days of the week.
Another potential limitation is derived from the application of both 24hR in the same day of the FFQ, which could result in higher correlation coefficients between methods. Sichieri & Ever-hart 7, using a similar methodology, but with ap-plication of the FFQ followed by the recall of two 24hR within a space of two weeks, found simi-lar averages of energy consumption fairly cor-related (r = 0.44). The 24hR of two consecutive days reduces the within-person variation, and, as many as seven days of data collection should be required for some nutrients and food groups to be correctly assessed 21. However, it is unre-alistic in most large population-based samples and research and statistical modeling may
di-minish the limitation of having only a few days of intake 4.
The values reported herefor the energy-ad-justed correlation coefficients were higher than the values reported from previous studies 7. The energy adjustment resulted nevertheless in a reduction in correlation coefficients for most nutrients, confirming previous findings 8,22. The total energy adjustment was performed on the assumption that each participant reported simi-lar nutrient intakes in both questionnaires 4. The daily intra-individual food consumption varia-tion, quantified by two 24hR, was corrected with the de-attenuation of the FFQ correlations with the reference method 4. The increasing of coef-ficients de-attenuated and corrected for energy indicates the daily intake variability, especially regarding fiber, calcium, folate, vitamins A and C for the adolescents; cholesterol for adults; and fiber, calcium, vitamin A and C for the elderly population. The correlation coefficients adjusted for energy and de-attenuated were higher than Table 4
Quartile food consumption classifi cation. comparing the food frequency questionnaire (FFQ) and the 24-hour recall (24hR) survey in adults and adolescents in the Syndrome of Obesity and Risk Factors for Cardiovascular Diseases (SOFT Study) (n = 238) *.
Nutrients Adolescents (n = 125) Adults (n = 66) Elderly (n = 47)
Same quartile
Same quartile or
adjacent quartile
Opposed quartiles
Same quartile
Same quartile or
adjacent quartile
Opposed quartiles
Same quartile
Same quartile or
adjacent quartile
Opposed quartiles
Energy (kcal) ** 34.4 83.2 2.4 37.9 89.4 3.0 48.9 95.7 0.0
Carbohydrates (g) 28.8 73.6 5.6 42.4 84.8 3.0 36.2 68.1 2.1
Protein (g) 34.4 69.6 9.6 40.9 74.2 3.0 38.3 74.5 2.1
Fat (g) 29.6 66.4 6.4 42.4 81.8 3.0 36.2 78.7 4.3
Saturated fat (g) 37.6 76.8 7.2 34.8 75.8 4.5 42.6 85.1 4.3
Cholesterol (mg) 31.2 72.8 5.6 30.3 71.2 4.5 48.9 89.4 2.1
Fiber (g) 33.6 77.6 7.2 33.3 77.3 7.6 42.6 87.2 2.1
Calcium (mg) 50.4 83.2 0.8 30.3 81.8 3.0 44.7 72.3 6.4
Iron (mg) 33.6 68.8 4.0 33.3 63.6 9.1 40.4 83.0 4.3
Zinc (mg) 27.2 63.2 10.4 24.2 69.7 9.1 27.7 76.6 2.1
Vitamin A (equivalent to retinol)
33.6 77.6 8.0 34.8 71.2 9.1 23.4 80.9 2.1
Vitamin E (equivalent to alpha-tocopherol)
33.6 68.8 8.8 27.3 65.2 10.6 27.7 72.3 6.4
Vitamin C (mg) 36.0 84.0 4.8 36.4 75.8 6.1 42.6 91.5 2.1
Folate (mcg) 39.2 79.2 5.6 27.3 66.7 9.1 40.4 80.9 2.1
Average 34.5 74.6 6.2 34.0 74.9 6.1 38.6 81.2 3.0
0.40 for eight of the 14 items assessed, among ad-olescents and adults, and 11 among the elderly. The correlations observed were within the limits of variation considered acceptable (0.4-0.7) for calibrations studies of diet 4,10.
Although direct comparisons with other stud-ies are difficult due to differences in the FFQ, ref-erence methods and population characteristics, the magnitude of the correlations was similar to those corrected for energy and de-attenuated, described in other validation studies, both for elderly 23, adults 10 and adolescents 24,25. The correct classification of individuals by the rela-tive amount of nutrient intake is indispensable to explore the association between dietary pat-terns and risk of disease. In this study, the aver-age proportions of adults and adolescents rightly classified were similar to the findings reported in other studies 6,8,24,25. Considering that 75% of adults and adolescents and 81% of elderly partic-ipants were classified in the same or in adjacent
quartiles by both methods, it is possible to infer the validity of the FFQ 25,26. Food consumption of participants up to 90 years of age has a poten-tial for bias due to attention and memory decline with age, and might be the reason for the paucity of studies in the elderly. However, the interviews were conducted face-to-face, lasted longer than those answered by adults, and discrepancies in responses were clarified with an adult living at the same house, as a strategy for collecting di-etary data from elderly people 27. Even though the sample was relatively small, it was represen-tative of the target population.
In conclusion, we demonstrated that the FFQ-Porto Alegre has a fair relative validity in adolescents and adults, including large spectrum of participant’s age, from 12 to 90 years old. The FFQ-Porto Alegre may be used to study the di-etary determinants of obesity and non-transmis-sible diseases in epidemiological surveys.
Resumo
Esse estudo avaliou a validade relativa de questioná-rio de freqüência alimentar (QFA-Porto Alegre), com 135 itens, comparando-o à média de dois recordatórios de 24 horas, entre adolescentes, adultos e indivídu-os idindivídu-osindivídu-os selecionadindivídu-os aleatoriamente da população. Utilizou-se classificação em quartis de ingestão pelos dois métodos e coeficiente de correlação de Pearson para analisar nutrientes transformados em logarit-mo natural e ajustados pela energia. O coeficiente de correlação ajustado de-atenuado médio entre adoles-centes foi 0,44 e variou de 0,18 (zinco) a 0,69 (folato), em adultos e idosos, respectivamente, foi 0,42 varian-do de 0,16 (ferro) a 0,73 (energia) e 0,52 varianvarian-do de 0,25 (vitamina E) a 0,84 (energia). O percentual médio de classificação no mesmo quartil ou adjacente pelos dois métodos foi 74,6% para adolescentes, 74,9% para adultos, e 81,2% para idosos, com classificação média geral de 75%. O QFA mostrou validade relativa satisfa-tória para adolescentes e adultos e pode ser usado para analisar a associação entre padrão de dieta e doenças não transmissíveis.
Consumo de Alimentos; Questionários; Estudos de Va-lidação; Idoso; Adolescente
Contributors
R. L. Henn, S. C. Fuchs, L. B. Moreira and F. D. Fuchs designed the study, supervised the data collection, analyzed and interpreted the data, and wrote the ma-nuscript.
Acknowledgments
References
1. Hu F, editor. Obesity epidemiology. New York: Ox-ford University Press; 2008.
2. Paeratakul S, Lovejoy J, Ryan D, Brain G. The rela-tion of gender, race and socioeconomic status to obesity and obesity comorbidities in sample of US adults. Int J Obes 2002; 26:1205-10.
3. World Health Organization. Reducing risks, pro-moting healthy life. Geneva: World Health Organi-zation; 2002.
4. Willett WC. Nutritional epidemiology. Oxford: Ox-ford University Press; 1998.
5. Lima FEL, Latorre MRDO, Costa MJC, Fisberg RM. Diet and cancer in Northeast Brazil: evaluation of eating habits and food group consumption in re-lation to breast cancer. Cad Saúde Pública 2008; 24:820-8.
6. Cardoso MA, Kida AA, Tomita LY, Stocco PR. Re-producibility and validity of a food frequency questionnaire among women of Japanese ancestry living in Brazil. Nutr Res 2001; 21:725-33.
7. Sichieri R, Everhart JE. Validity of a Brazilian food frequency questionnaire against dietary re-calls and estimated energy intake. Nutr Res 1998; 18:1649-59.
8. Slater B, Philippi ST, Fisberg RM, Latorre MRDO. Validation of a semi-quantitative adolescent food frequency questionnaire applied at a public school in São Paulo, Brazil. Eur J Clin Nutr 2003; 57:629-35.
9. Zanolla AF, Olinto MTA, Henn RL, Wahrlich V, An-jos LA. Avaliação de reprodutibilidade e validade de um questionário de freqüência alimentar em adultos residentes em Porto Alegre, Rio Grande do Sul, Brasil. Cad Saúde Pública 2009; 25:840-8. 10. Cade J, Thompson R, Burley V, Warm D.
Develop-ment, validation and utilisation of food-frequency questionnaires: a review. Public Health Nutr 2002; 5:567-87.
11. Sichieri R. Epidemiologia da obesidade. Rio de Ja-neiro: EdUERJ; 1998.
12. Fuchs SC, Moreira LB, Camey AS, Moreira MB, Fuchs FD. Clustering of risk factors for cardiovas-cular disease among women in Southern Brazil: a population-based study. Cad Saúde Pública 2008; 24 Suppl 2:S285-93.
13. Vitolo MR. Nutrição da gestação ao envelhecimen-to. Rio de Janeiro: Editora Rubio; 2008.
14. Pinheiro ABV, Lacerda EMA, Benzecry EH, Gomes MCS, Costa VM. Tabela para avaliação de consu-mo alimentar em medidas caseiras. Rio de Janeiro: Editora Atheneu; 2005.
15. World Health Organization. Report of WHO Con-sultation in Obesity. Obesity: preventing and man-aging the global epidemic. Geneva: World Health Organization; 1998.
16. Cole TJ, Bellizzi MC, Flegal KM, Dietz WH. Estab-lishing a standard definition for child overweight and obesity worldwide: international survey. BMJ 2000; 320:1240-3.
17. Chen Y, Ahsan H, Parvez F, Howe GR. Validity of a food-frequency questionnaire for a large prospec-tive cohort study in Bangladesh. Br J Nutr 2004; 92:851-9.
18. Deschamps V, de Lauzon-Guillain B, Lafay L, Borys JM, Charles MA, Romon M. Reproducibility and relative validity of a food-frequency questionnaire among French adults and adolescents. Eur J Clin Nutr 2009; 63:282-91.
19. Papadopoulou SK, Barboukis V, Dalkiranis A, Has-sapidou M, Petridou A, Mougios V. Validation of a questionnaire assessing food frequency and nu-tritional intake in Greek adolescents. Int J Food Sci Nutr 2008; 59:148-54.
20. Sevak L, Mangtani P, McCormack V, Bhakta D, Kassam-Khamis T, Silva IS. Validation of a food fre-quency questionnaire to assess macro- and micro-nutrient intake among South Asians in the United Kingdom. Eur J Nutr 2004; 43:160-8.
21. Hartwell DL, Henry CJK. Comparison of a self-administered quantitative food amount frequency questionnaire with 4-day estimated food records. Int J Food Sci Nutr 2001; 52:151-9.
22. Fornés NS, Stringhini MLF, Elias BM. Reproduc-ibility and validity of a food-frequency question-naire among low-income Brazilian workers. Public Health Nutr 2003; 6:821-7.
23. Shahar D, Fraser D, Shai I, Vardi H. Development of a Food Frequency Questionnaire (FFQ) for an elderly population based on a population survey. J Nutr 2003; 133:3625-9.
24. Johansson I, Hallmans G, Wikman A, Biessy C, Riboli E, Kaaks R. Validation and calibration of food-frequency questionnaire measurements in the Northern Sweden Health and Disease cohort. Public Health Nutr 2002; 5:487-96.
25. Rockett HR, Breitenbach M, Frazier AL, Witschi J, Wolf AM, Field AE, et al. Validation of a youth/ado-lescent food frequency questionnaire. Prev Med 1997; 26:808-16.
26. Masson LF, McNeill G, Tomany JO, Simpson JA, Peace HS, Wei L, et al. Statistical approaches for assessing the relative validity of a food-frequency questionnaire: use of correlation coefficients and the kappa statistic. Public Health Nutr 2003; 6: 313-21.
27. Ervin RB, Smiciklas-Wright H. Using encoding and retrieval strategies to improve 24-hour dietary re-calls among older adults. J Am Diet Assoc 1998; 98:989-94.
Submitted on 19/Aug/2009