Cognitive potential of children with attention deficit and
hyperactivity disorder
Abstract
Ana Carla Leite Romero1, Simone Aparecida Capellini2, Ana Claúdia Figueiredo Frizzo3
1 Speech and Hearing Therapist; MSc student in the Speech and Hearing Graduate Program - Philosophy and Sciences School - Paulista State University - FFC/UNESP - Marília - SP/Brazil. 2 Senior Associate Professor of Writen Language; Professor - Department of Speech and Hearing Therapy and Professor at the Graduate Program in Speech and Hearing Therapy -
Philosophy and Sciences School - FFC/UNESP Marília - SP.
3 PhD in Neurology; Professor - Department of Speech and Hearing Therapy and Graduate Program in Speech and Hearing Therapy - School of Philosophy and Sciences - Paulista State University - FFC - UNESP - Marília (SP), Brazil.
Philosophy and Sciences School - Paulista State University - FFC/UNESP-Marília - SP/Brazil.
Send correspondence to: Ana Claúdia Figueiredo Frizzo. Av. Hygino Muzzy Filho, nº 737. Campus Universitário. Marília - SP. Brazil. CEP: 17525-900.
Paper submited to the BJORL-SGP (Publishing Management System - Brazilian Journal of Otorhinolaryngology) on April 9, 2013; and accepted on June 29, 2013. cod. 10856.
T
he literature has described comorbidities among the symptoms of children with Attention Deficit and Hyperactivity Disorder (ADHD) and the auditory processing changes, and these symptoms have been overlooked in the assessment, and consequently, on the rehabilitation of these individuals.Objective: To compare the findings of the long latency auditory evoked potentials in children with and without ADHD.
Method: This is a historical cohort cross-sectional case-control study, in which we enrolled 30 children with and without ADHD, aged 8-12 years. We performed the long-latency auditory evoked potential test in two scanning procedures through passive and active tasks differing in frequency and duration (MMNf and MMNd) (P300f and P300D).
Results: When comparing the performance of children with and without ADHD in the electrophysiological test assessment of hearing, we found significant differences concerning the P2 amplitude in the LE - which was higher for the ADHD group; and concerning the N2 amplitude and latency - which were abnormal in the ADHD group.
Conclusion: This study provided a greater understanding of the central auditory pathways of children with and without ADHD when evaluated from electrophysiological tests.
ORIGINAL ARTICLE Braz J Otorhinolaryngol.
2013;79(5):609-15.
BJORL
Keywords:
attention deficit and hyperactivity disorder; auditory evoked potentials; electrophysiology.
INTRODUCTION
Neuropsychological studies have reported that individuals with attention deficit and hyperactivity disorder (ADHD) have alterations in their prefrontal cortex and in subcortical structures, associated to frequent levels of inattention, impulsivity, hyperactivity, disorganization and social awkwardness, involving an inhibitory system deficit or in the working memory executive functions1,2.
The literature has described comorbidities between symptoms of children with ADHD and auditory processing (AP) disorders, and such symptoms have been overlooked in the assessment and consequently the rehabilitation of these individuals3,4.
Auditory processing disorder is common in children with ADHD and may be due to a deficit in the functioning of the auditory pathway, caused by changes in some of the central auditory nervous system (CANS) structures, or in the cerebral hemispheres, which can be observed by Long Latency Auditory Evoked Potentials (LLAEP), which assesses the auditory pathway integrity from the periphery all the way to the auditory cortex4.
According to the DSM-IV5, tests that require focused
mental processing are abnormal in individuals with Atten-tion Deficit and Hyperactivity Disorder when compared with control subjects, but it is not entirely clear which fundamental cognitive deficit is responsible for this.
Many studies have suggested that attention dysfunction is not the main cause of behavioral changes in individuals with ADHD6,7 and the findings of evoked
potentials showed that various sensory and cognitive stages are processed differently in individuals with ADHD, and this apparent discrepancy may be represented from studies of cognitive processes, by means of evoked potentials that examine the various brain regions8,9.
Given the above, this study aimed to compare the findings of the auditory evoked potential latencies in children with and without Attention Deficit and Hyperactivity Disorder (ADHD).
METHOD
This study project was submitted to the analysis and appreciation of the Ethics in Research Committee of this University and carried out after approval according to protocol number: 0094/2011. This historical cohort study was cross-sectional and of the case-control type.
The study included 30 children of both genders aged 8-12 years, divided into:
• Control Group (CG) - comprising 15 children with good academic performance, selected by the teachers following the criterion of satisfac-tory performance on two consecutive marking periods in a reading and writing assessment;
• Study Group (SG) - composed of 15 chil-dren properly diagnosed with ADHD by a multidisciplinary team, which included speech and hearing, neurological, educational, neuropsychological and educational assessments, considering the presence of at least six (or more) symptoms of inattention and six (or more) symptoms of hyperactivity-impulsivity persisting for at least six months, according to the Diagnostic Criteria for Attention Deficit/Hyperac-tivity Disorder from the DSM-IV. We employed Instruments from the neuropsychological battery of tests: WISC-III10 and the neuropsychological
battery11. The children from the SG were assessed
after a period of 24 hours without the use of medication (methylphenidate), since testing under the medication could mask the child’s behavioral performance.
The children from both groups were evaluated after their guardians signed the Consent Form. All the children had chronological age between 8 and 12 years and were previously submitted to audiological, ophthalmological and psychological evaluations. Thus, we excluded from the study those individuals who did not have audiometric thresholds within the normal range (20 dB HL)12 and who
had cognitive and visual acuity impairment.
Basic audiological evaluation was performed in a soundproof booth. For pure tone audiometry we used the GSI 61 (ANSI 3.6-1989 and S3.43-1992 standards) audiometer with TDH-50 phones. Hearing thresholds were obtained by air conduction, in the sound frequencies of 250-8,000 Hz. The normality criterion used was the classification proposed by Lloyd & Kaplan12, in which the
average of the 500, 1,000 and 2,000 Hz frequencies should be equal to or less than 20 dB HL.
Evaluation of the Long Latency Auditory Evoked Potential was performed using the Biologic Navigator Pro and recorded with five disposable electrodes positioned at Fz and Cz in reference to the right (A2) and left (A1) lobes, using the two recording channels of the equipment, the ground electrode was placed on Fpz. Impedance was maintained at a level below 5 KW.
The components were surveyed in two sweeps, i.e., it was first elicited for tonal stimuli (tone burst) differing in frequency - MMNf and P300f (frequent stimulus: frequency of 750 Hz and rare stimulus: frequency of 1,000 Hz), and later, for stimuli differing in duration - MMNd and P300D (frequent stimulus: 100 ms and rare stimulus: 50 ms, both in the 1,000 Hz frequency).
time of the waves was 500 ms with a filter from 0.5 to 30 Hz and 50,000 mV sensitivity and alternating polarity.
For the MMN recording, the patient performed a passive task and was instructed to remain seated and relaxed but awake and watching a video (without sound) to get distracted and not pay attention to the sound stimulus presented to him. As for the P300 recording, the patient should undertake an active task, paying attention and discriminating the stimuli naming them as “thin” during P300f and “short” in P300d.
The stimulus presentation was randomized concerning the stimulated ear, alternating them to avoid result biases. Moreover, due to the difficulties inherent to the behavior of children with ADHD, we decided to replicate the test only when necessary, in routine use the Cz and Fz records, in order to verify and ensure data accuracy.
For final result analysis, we chose to use the records obtained at Cz, since in this study this was the region where the records were better; in addition, the literature has consistently described it as the region with the best visualization of these potentials.
In order to identify the P300 wave, we used the criterion proposed by Junqueira & Colafêmina13, which is
presented below:
• Identification of the N1-P2-N2 complex - the first three waves that appear in the sequence and have negative - positive - negative polarity, respectively, occurring in the replication of the traces, frequent and rare, between 60 and 300 ms;
• P3 identification - the largest positive wave - im-mediately after the N1-P2-N2 complex, occurring in tracing replication for rare stimulus, between 240 and 700 ms;
• Latencies were marked on the highest peak, i.e. the point of maximum wave amplitude;
• The amplitudes were marked from the peak of the wave to the base line, and in the case of the N2-P3 inter-amplitude;
To identify the MMN waves, we considered the biggest wave of negative polarity, between latency values from 100-300 ms, viewed by the subtraction of the rare stimulus tracing from that of the frequent stimulus tracing14,15. For the descriptive analysis of test results from
the construction of tables with mean and standard deviation values per group and ear, we used the Shapiro-Wilk test to check for data normality. A comparison of the tests’ mean values between the groups studied was made using the variance analysis - F test (ANOVA) and, when significance was found, it was confirmed by the Tukey test (ANOVA) - a parametric test that compares mean values using data va-riance, which necessarily constitute a normal distribution.
The result was described as p-value, and the level of significance adopted was always 5% or 0.05 (p≤ .05).
RESULTS
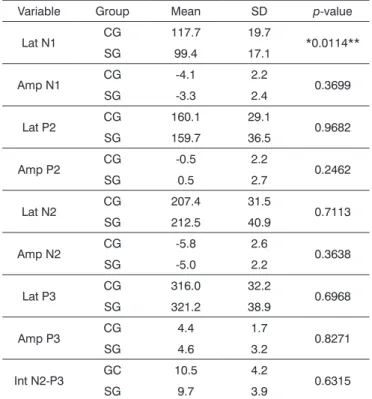
Upon assessing the electrophysiological evaluation of hearing during the active task with stimuli that varied on frequency, P300f, the right ear (RE) had statistically significant difference only in the N1 latency, while in the left ear (LE) there was no difference as to the level of significance in any of the variables.
Tables 1 and 2 show the mean values, standard deviation and p-value of the N1, P2, N2, P3 amplitude and latency values; and N2-P3 inter-amplitude in the P300f assessment in both groups of RE and LE, respectively.
Table 1. Descriptive statistics of the mean, standard deviation
(SD) and p-value of the N1, P2, N2, P3 amplitude and latency variables and RE P300f N2-P3 inter-amplitude value.
Variable Group Mean SD p-value
Lat N1 CG 117.7 19.7 *0.0114** SG 99.4 17.1
Amp N1 CG -4.1 2.2 0.3699 SG -3.3 2.4
Lat P2 CG 160.1 29.1 0.9682 SG 159.7 36.5
Amp P2 CG -0.5 2.2 0.2462
SG 0.5 2.7
Lat N2 CG 207.4 31.5 0.7113 SG 212.5 40.9
Amp N2 CG -5.8 2.6 0.3638 SG -5.0 2.2
Lat P3 CG 316.0 32.2 0.6968 SG 321.2 38.9
Amp P3 CG 4.4 1.7 0.8271
SG 4.6 3.2
Int N2-P3 GC 10.5 4.2 0.6315
SG 9.7 3.9
Lat: Latency; Amp: Amplitude; Int: Inter-amplitude; SD: Standard Deviation, RE: Right Ear; Tukey Test ** Minimum Significant Difference = 13.84
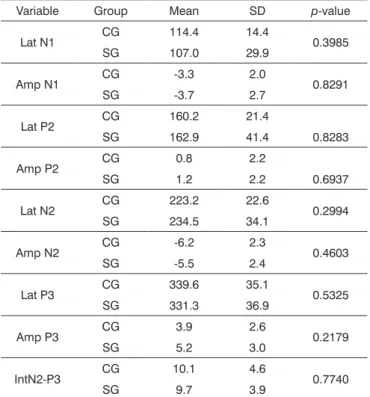
In the P300 evaluation, when we stimulated with a stimulus that varied in duration, P300d, the RE had no statistically significant difference when the two groups were compared with and without ADHD; while for the LE it was significant when comparing the P2 and N2 am-plitude and N2 latency.
Table 3. Descriptive statistics of the mean, standard deviation (SD) and p-value of the N1, P2, N2 and P3 amplitude and latency variables and P300d N2-P3 inter-amplitude for the RE.
Variable Group Mean SD p-value
Lat N1 CG 114.4 14.4 0.3985 SG 107.0 29.9
Amp N1 CG -3.3 2.0 0.8291 SG -3.7 2.7
Lat P2 CG 160.2 21.4
0.8283 SG 162.9 41.4
Amp P2 CG 0.8 2.2
0.6937
SG 1.2 2.2
Lat N2 CG 223.2 22.6 0.2994 SG 234.5 34.1
Amp N2 CG -6.2 2.3 0.4603 SG -5.5 2.4
Lat P3 CG 339.6 35.1 0.5325 SG 331.3 36.9
Amp P3 CG 3.9 2.6 0.2179
SG 5.2 3.0
IntN2-P3 CG 10.1 4.6 0.7740
SG 9.7 3.9
Lat: Latency; Amp: Amplitude; Int: Inter-amplitude; SD: Standard Deviation; RE: Right Ear.
Table 4. Descriptive statistics of the mean, standard deviation
(SD) and p-value of the N1, P2, N2 and P3 latency and am-plitude variables and P300d N2-P3 inter-amam-plitude for the LE.
Variable Group Mean SD p-value
Lat N1 CG 124.6 24.4 0.1926 SG 111.3 30.2
Amp N1 CG -4.0 2.0 0.2610 SG -3.0 2.5
Lat P2 CG 162.5 24.1 0.9701 SG 163.0 35.0
Amp P2 CG -0.9 3.2 *0.0349**
SG 1.3 2.4
Lat N2 CG 208.7 21.7 *0.0213** SG 237.2 39.6
Amp N2 CG -6.6 2.7 *0.0203** SG -4.4 2.2
Lat P3 CG 331.7 28.8 0.5667 SG 340.5 50.8
Amp P3 CG 4.9 2.5 0.7665
SG 4.6 2.9
Int N2-P3 CG 11.5 3.6 0.0523
SG 8.4 4.5
Lat: Latency; Amp: Amplitude, Int: Inter-amplitude; SD: Standard
Deviation; LE: Left Ear; Tukey Test ** Minimum Signiicant Difference:
P2 Amp: 2.16; N2 Lat: 23.94 and N2 Amp: 1.88.
Table 5. Descriptive statistics of the mean, standard deviation
(SD) and p-value of the MMNf latency and amplitude variables for the RE.
Variable Group Mean SD p-value
Lat RE CG 224.1 29.9 0.8019 SG 220.2 52.6
Amp RE CG -2.6 1.9 0.9948 SG -2.6 2.4
Lat: Latency, Amp: Amplitude; RE: Right Ear; SD: Standard Deviation.
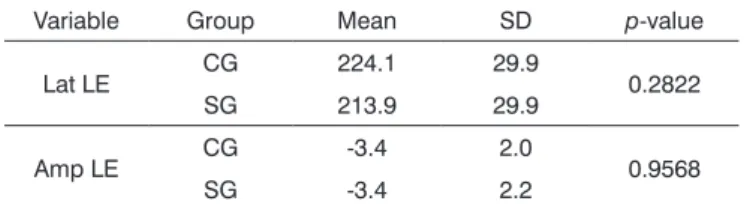
Comparing the electrophysiological evaluation of passive listening with stimulation with varied frequency, MMNf, both ears showed no difference as to the level of significance when the two groups - with and without ADHD were compared.
Tables 5 and 6depict the mean, standard deviation and p-value of the N1, P2, N2 and P3 amplitude and la-tency variables; and MMNf N2-P3 inter-amplitude for the RE and LE, respectively.
Variable Group Mean SD p-value
Lat N1 CG 112.8 25.1 0.5622 SG 118.3 26.0
Amp N1 CG -4.5 3.6 0.2710 SG -3.1 2.9
Lat P2 CG 155.6 35.9 0.4742 SG 165.2 36.3
Amp P2 CG -1.4 3.2 0.0986
SG 1.2 2.2
Lat N2 CG 198.7 27.4 0.1284 SG 219.5 43.5
Amp N2 CG -6.1 3.3 0.2435 SG -4.6 3.1
Lat P3 CG 329.4 32.6 0.9329 SG 328.5 29.8
Amp P3 CG 5.2 4.4 0.7083
SG 5.8 3.6
Int N2-P3 CG 12.6 5.1 0.3919 SG 11.0 4.8
Table 2. Descriptive statistics of the mean, standard deviation
(SD) and p-value of the N1, P2, N2, P3 latency and amplitude variables and P300f N2-P3 inter-amplitude for the LE.
Lat: Latency; Amp: Amplitude; Int: Inter-amplitude; SD: Standard Deviation; LE: Left Ear.
with the attention the subject pays to the sound stimulus and the inhibition of processing competitive stimuli; thus, children with ADHD in this study would require greater activation of these regions to ensure that they would remain vigilant and consequently discriminate rare stimuli from frequent ones.
In evaluating the P300d for the LE, we found a significant difference for the N2 amplitude, in which the CG had higher negativity when compared to the SG, and in N2 latency - where the SG values were more elongated. These results corroborate other studies22 and may be explained
by possible pre-attentional and discriminatory difficulties in children with ADHD; since according to McPherson23 and
Näätänen24 the N2 wave would happen from the attention
and discrimination of a passive automatic pre-attentional response, elicited by discriminating the rare event.
With regard to N2 latency, the LE also showed a statistically significant difference when the SG was compared to the CG, and we found longer latency values for the SG, corroborating other studies25,26 which analyzed,
the N2 amplitude and latency values of children with ADHD, and compared with normal controls, finding an increase in N2 latency for the SG.
In this study, we observed that the N2 was the only component to show significant differences in terms of both latency and amplitude when children with ADHD were compared to those without it, which makes us consider that the ADHD children of our study had a decline in the efficiency of responses involving pre-attentional and discriminatory processes19,22, since according to Näätänen24
N2 is generated from the attention and discrimination of a passive and pre-attentional automatic response elicited by the rare event discrimination.
Concerning the P3 component findings, it is consistent with studies26-28 which reported normal P300
latency and amplitude values in the ADHD group when compared to controls; however, these are discordant from other literatures, which have consistently described an increase in P30016,17 latency time, as well as an amplitude
decrease8,18,19 for individuals with ADHD.
A first explanation for not having significant differences between the P300 in children with and without ADHD in this study is that our sample was small, and this is a limiting factor vis-à-vis the specific discussion of these findings. Such a limitation in this study was described by Brayner26 and Satterfield & Braley28, who suggest a larger
sample to better investigate the auditory pathway.
Another possible explanation is that children with ADHD have alterations in their pre-attentional and discriminatory processes - which was evident in the results found in the N2 wave; however, these children began to process this information in some way, which could be aided by other structures of the central nervous system and/or by interference of neural plasticity, in which sensory
Table 7. Descriptive statistics of the mean, standard deviation
(SD), minimum value, maximum value and p-value of the MMNd latency and amplitude variables of the RE.
Variable Group Mean SD p-value
Lat RE CG 209.5 50.1 0.8407 SG 206.1 41.3
Amp LE GC -2.4 1.9 0.0881 SG -4.7 2.5
Lat: Latency; Amp: Amplitude; RE: Right Ear, SD: Standard Deviation.
Table 8. Descriptive statistics of the mean, standard deviation
(SD) and p-value of the MMNd latency and amplitude for the LE.
Variable Group Mean SD p-value
Lat LE CG 245.4 57.7 0.4961 SG 232.9 40.4
Amp LE CG -3.7 2.6 0.9253 SG -3.6 2.6
Lat: Latency; Amp: Amplitude; LE: Left Ear; SD: Standard Deviation.
Tables 7 and 8depict the mean, standard deviation and p-value of the N1, P2, N2 and P3 amplitude and latency variables; and N2-P3 inter-amplitude ranging in MMNd duration for the RE and LE, respectively.
Table 6. Descriptive statistics of the mean, standard deviation
(SD) and p-value of the MMNf amplitude and latency for the LE. Variable Group Mean SD p-value
Lat LE CG 224.1 29.9 0.2822 SG 213.9 29.9
Amp LE CG -3.4 2.0 0.9568 SG -3.4 2.2
Lat: Latency; Amp: Amplitude; LE: Left Ear; SD: Standard Deviation; LE: Left Ear.
DISCUSSION
There are many studies that have evaluated the P300 in children with ADHD, but few have focused on the other LLAEP components: N1, P2 and N216,17. In this
study, we found a statistically significant difference in the P300 latency and amplitude values between the CG and the SG; both in the P300f assessment as in the P300d, when concentrated on the N2, P2 and N2 components.
Concerning the P300d assessment, the LE had better P2 amplitude for the SG when compared to the CG, which corroborates studies18,19 that reported that the
P2 component is higher in children with ADHD when compared to normal controls.
The higher P2 amplitude in the SG children can be justified by studies20,21 which claim that this wave has
experiences bring about a better neural synchrony or a reorganization of the nerve cells29, since, according to the
literature30 a series of cognitive processes may be involved
in the P300 generation.
With regard to the MMN, both the MMNf and the MMNd did not show statistical difference for any of the variables, either in amplitude or latency when comparing the two groups. This suggests that children with ADHD in our study have deficits when they need to performa a discrimination task, while keeping sustained attention, or maintain attention for an extended period of time. To obtain the MMN, we need pre-attentional processes that are independent of the subject’s response; thus, these children did not need to perform any task, which contributed to the normal MMN results found in the present study31,32.
According to the specialized literature24, the MMN
is elicited in the same way as the N2, or from attention and discriminatory activities of a passive and automatic pre-attentional response, elicited by the discrimination of a rare event. Moreover, N2 is recorded in the same region as the MMN30 latency and it has been commonly described
as a functional representation of that component33,34. Thus,
in this study, we initially expected that children with ADHD would also have MMN alterations. One possible explanation for this result is that the ADHD subjects in this study still have deficits in sustained attention, since the most obvious LLAEP changes were seen as some kind of response was required, in which children would need to sustain attention for a long time while performing a task32.
In this study, we also found that the larger number of altered results came from the LE stimulation, leading us to suggest that, just like the processing of nonverbal stimuli, and the stimuli varying according to duration, are first processed by the right hemisphere35,36 and transferred
via the corpus callosum to the left hemisphere, changes in attention and discrimination of the children in this study may come from processing deficits in the right hemisphere.
CONCLUSION
In comparing the performance of children with and without ADHD in the electrophysiological assessment of hearing, there were significant differences vis-à-vis the P2 amplitude in the LE, which was higher for the group with ADHD and for N2 amplitude and latency of the LE, which were abnormal in the ADHD group.
Regarding P300 and MMN, there were no significant differences when comparing both groups.
This study provided a greater understanding of the central auditory pathways of children with and without ADHD when evaluated with electrophysiological tests; however, further studies are needed, especially in the national literature, to better understand the functioning of the auditory pathway of these populations.
REFERENCES
1. Aquino AMCM, Bardão R, Barbosa MM, Colafemina JF, Gonçales AS, Casagrande-Souza VMR. O potencial endógeno nos distúrbios de aten-ção e memória auditiva. Rev Bras Otorrinolaringol. 2000;66(3):225-30. 2. Knapp P, Johannpeter J, Lyszkowski LC, Rohde LA. Terapia
cognitivo-comportamental no transtorno de déficit de atenção/ hiperatividade: manual do terapeuta. Porto Alegre: Artmed; 2002. 3. Chermak GD, Somers EK, Seikel JA. Behavioral signs of central
audi-tory processing disorder and attention deficit hyperactivity disorder. J Am Acad Audiol. 1998;9(1):78-84.
4. Cavadas M, Pereira LD, Mattos P. Efeito do metilfenidato no processa-mento auditivo em crianças e adolescentes com transtorno do déficit de atenção/hiperatividade. Arq Neuropsiquiatr. 2007;65(1):138-43. DOI: http://dx.doi.org/10.1590/S0004-282X2007000100028
5. American Psychiatric Association. Diagnostic and Statistical Manual of Mental Disorders: DSM-IV. 4th ed. Washington: American Psychiatric
Association; 2000.
6. Halperin JM, Newcorn JH, Sharma V, Healey JM, Wolf LE, Pascualvaca DM, et al. Inattentive and noninattentive ADHD children: do they constitute a unitary group? J Abnorm Child Psychol. 1990;18(4):437-49 7. Schachar RJ, Tannock R, Logan G. Inhibitory control, impulsi-veness, and attention deficit hyperactivity disorder. Clin Psychol Rev. 1993;13(8):721-39. DOI: http://dx.doi.org/10.1016/S0272-7358(05)80003-0
8. Johnstone SJ, Barry RJ. Auditory event-related potentials to a two-tone discrimination paradigm in attention deficit hyperactivity disorder. Psychiatry Res. 1996;64(3):179-92. PMID: 8944396 DOI: http://dx.doi. org/10.1016/S0165-1781(96)02893-4
9. Karayanidis F, Robaey P, Bourassa M, De Koning D, Geoffroy G, Pelletier G. ERP differences in visual attention processing between attention-deficit hyperactivity disorder and control boys in the absence of performance differences. Psychophysiology. 2000;37(3):319-33. PMID: 10860410 DOI: http://dx.doi.org/10.1111/1469-8986.3730319 10. Wechsler D. WISC-III: escala de inteligência para crianças - manual.
Adaptação e padronização brasileira de Vera Lúcia Marques de Fi-gueiredo. 3a ed. São Paulo: Casa do Psicólogo; 2002.
11. Tabaquim MLM. Validação do exame neuropsicológico e análise das funções corticais superiores em crianças do ensino fundamental. [Tese de pós-doutorado]. Campinas: Universidade Estadual de Campinas, Faculdade de Ciências Médicas; 2008.
12. Lloyd LL, Kaplan H. Audiometric interpretation: a manual of basic audiometry. Baltimore: University Park Press; 1978.
13. Junqueira CAO, Colafêmina JF. Investigação da estabilidade inter e intra-examinador na identificação do P300 auditivo: análise de erros. Rev Bras Otorrinolaringol. 2002;68(4):468-78. DOI: http://dx.doi. org/10.1590/S0034-72992002000400004
14. Licht R, Horsley TM. Mismatch Negativity as a tool in studying auditoty phonological processing in reading disability. In: Licht R, Bouma A, Slot W, Koops W (eds). Child Neuropsychology, reading Disability and more. Delft: Eburon, 1998. p.85-105.
15. Näätänen R, Pakarinen S, Rinne T, Takegata R. The mismatch ne-gativity (MMN): towards the optimal paradigm. Clin Neurophysiol. 2004;115(1):140-4. PMID: 14706481 DOI: http://dx.doi.org/10.1016/j. clinph.2003.04.001
16. Tsai ML, Hung KL, Lu HH. Auditory event-related potentials in children with attention deficit hyperactivity disorder. Pediatr Ne-onatol. 2012;53(2):118-24. DOI: http://dx.doi.org/10.1016/j.ped-neo.2012.01.009
17. Borja A, Ponde M. P300: avaliação do potencial evocado cognitivo em crianças com e sem TDAH. Rev Ciênc Med Biol. 2009;8(2):198-215. 18. Holcomb PJ, Ackerman PT, Dykman RA. Auditory event-related
19. Satterfield JH, Schell AM, Nicholas T. Preferential neural processing of attended stimuli in attention-deficit hyperactivity disorder and normal boys. Psychophysiology. 1994;3(1):1-10. DOI: http://dx.doi. org/10.1111/j.1469-8986.1994.tb01018.x
20. Hansen JC, Hillyard SA. Temporal dynamics of human auditory selec-tive attention. Psychophysiology. 1988;25(3):316-29. PMID: 3406331 DOI: http://dx.doi.org/10.1111/j.1469-8986.1988.tb01249.x
21. Oades RD. Frontal, temporal and lateralized brain function in chil-dren with attention-deficit hyperactivity disorder: a psychophysio-logical and neuropsychopsychophysio-logical viewpoint on development. Behav Brain Res. 1998;94(1):83-95. DOI: http://dx.doi.org/10.1016/S0166-4328(97)00172-1
22. Lazzaro I, Gordon E, Whitmont S, Meares R, Clarke S. The modulation of late component event related potentials by pre-stimulus EEG theta activity in ADHD. Int J Neurosci. 2001;107(3-4):247-64.
23. Mcpherson DL. Late potentials of the auditory sistem. San Diego: Singular Publishing Group; 1996. p.147.
24. Näätänen R. Attention and Brain Function. Hillsdale: Erlbaum; 1992. 25. Barry RJ, Johnstone SJ, Clarke AR. A review of electrophysiology in
attention-deficit/hyperactivity disorder: II. Event-related potentials. Clin Neurophysiol. 2003;114(2):184-98. PMID: 12559225 DOI: http:// dx.doi.org/10.1016/S1388-2457(02)00363-2
26. Brayner ICS. Aplicação do paradigma auditivo “Oddball” no estudo do P300: normatização para faixa etária de 7-14 anos e avaliação de crianças com dificuldade de aprendizagem com e sem transtorno de déficit de atenção/hiperatividade. [Dissertação de mestrado]. Campi-nas: Universidade Estadual de Campinas; 2003.
27. Callaway E, Halliday R, Naylor H. Hyperactive children’s event-related potentials fail to support underarousal and maturational-lag theories. Arch Gen Psychiatry. 1983;40(11):1243-8. PMID: 6639294 DOI: http:// dx.doi.org/10.1001/archpsyc.1983.01790100089012
28. Satterfield JH, Braley BW. Evoked potentials and brain maturation in hyperactive and normal children. Electroencephalogr Clin Neu-rophysiol. 1977;43(1):43-51. DOI: http://dx.doi.org/10.1016/0013-4694(77)90193-6
29. Tremblay KL, Burkard R. Aging and auditory evoked potentials. In: Burkard R, Don M, Eggermont J (Eds). Auditory Evoked Potentials: Scientific Bases to Clinical Application. Baltimore: Lippincott Williams and Wilkins; 2007.
30. Hall JW. Handbook of auditory evoked responses. Boston: Allyn & Bacon; 1992. p.871.
31. Barkley RA. Behavioral inhibition, sustained attention, and execu-tive functions: constructing a unifying theory of ADHD. Psychol Bull. 1997;121(1):65-94. PMID: 9000892 DOI: http://dx.doi. org/10.1037/0033-2909.121.1.65
32. van der Meere J, Gunning WB, Stemerdink N. Changing a response set in normal development and in ADHD children with and without tics. J Abnorm Child Psychol. 1996;24(6):767-86. PMID: 8970909 DOI: http://dx.doi.org/10.1007/BF01664739
33. Snyder E, Hillyard SA. Long-latency evoked potentials to irrelevant, deviant stimuli. Behav Biol. 1976;16(3):319-31. PMID: 1275853 DOI: http://dx.doi.org/10.1016/S0091-6773(76)91447-4
34. Näätänen R, Picton TW. N2 and automatic versus controlled processes. In: Mccallum WC, Zappoli R, Denoth F. Cerebral psychophysiology: Studies in event-related potentials. Amsterdam: Elsevier; 1986. p.169-86. 35. Brandão ML. Psicofisiologia. Rio de Janeiro: Atheneu; 1995. p.195. 36. Pinheiro ML, Musiek FE. Sequencing and temporal ordering in the