Domestication
Zachary H. Lemmon1, Robert Bukowski2, Qi Sun2, John F. Doebley1*
1Laboratory of Genetics, University of Wisconsin – Madison, Madison, Wisconsin, United States of America,2Bioinformatics Facility, Institute of Biotechnology, Cornell University, Ithaca, New York, United States of America
Abstract
Gene expression differences between divergent lineages caused by modification ofcisregulatory elements are thought to be important in evolution. We assayed genome-wide cisand transregulatory differences between maize and its wild progenitor, teosinte, using deep RNA sequencing in F1hybrid and parent inbred lines for three tissue types (ear, leaf and stem). Pervasive regulatory variation was observed with approximately 70% of ,17,000 genes showing evidence of regulatory divergence between maize and teosinte. However, many fewer genes (1,079 genes) show consistent cis differences with all sampled maize and teosinte lines. For,70% of these 1,079 genes, thecisdifferences are specific to a single tissue. The number of genes withcis regulatory differences is greatest for ear tissue, which underwent a drastic transformation in form during domestication. As expected from the domestication bottleneck, maize possesses lesscis regulatory variation than teosinte with this deficit greatest for genes showing maize-teosintecisregulatory divergence, suggesting selection on cis regulatory differences during domestication. Consistent with selection on cis regulatory elements, genes withciseffects correlated strongly with genes under positive selection during maize domestication and improvement, while genes withtransregulatory effects did not. We observed a directional bias such that genes withcis differences showed higher expression of the maize allele more often than the teosinte allele, suggesting domestication favored up-regulation of gene expression. Finally, this work documents thecisandtransregulatory changes between maize and teosinte in over 17,000 genes for three tissues.
Citation:Lemmon ZH, Bukowski R, Sun Q, Doebley JF (2014) The Role ofcisRegulatory Evolution in Maize Domestication. PLoS Genet 10(11): e1004745. doi:10. 1371/journal.pgen.1004745
Editor:Hunter Fraser, Stanford University, United States of America
ReceivedJune 5, 2014;AcceptedSeptember 9, 2014;PublishedNovember 6, 2014
Copyright:ß2014 Lemmon et al. This is an open-access article distributed under the terms of the Creative Commons Attribution License, which permits unrestricted use, distribution, and reproduction in any medium, provided the original author and source are credited.
Data Availability:The authors confirm that all data underlying the findings are fully available without restriction. The raw sequence data has been deposited in NCBI Sequence Read Archive with accessions SRX710894-711341 and the Gene Expression Omnibus (GEO) Series with accession number GSE61810 (http://www. ncbi.nlm.nih.gov/geo/query/acc.cgi?acc = GSE61810). Supplemental datasets have been made available from the Dryad Digital Repository: http://dx.doi.org/10. 5061/dryad.4kh67.
Funding:This work was supported by the National Science Foundation grants IOS1025869, IOS0820619, and IOS1238014. The funders had no role in study design, data collection and analysis, decision to publish, or preparation of the manuscript.
Competing Interests:The authors have declared that no competing interests exist. * Email: [email protected]
Introduction
Changes in thecis regulatory elements (CREs) of genes with functionally conserved proteins have been considered a key mechanism, if not the primary mechanism, by which the diverse forms of multicellular eukaryotic organisms evolved [1–3]. Variation in CREs allows for the deployment of tissue specific patterning of gene expression, differences in developmental timing of expression, and variation in the quantitative levels of gene expression. Furthermore, modification of CREs, as opposed to coding sequence changes, are assumed to have less pleiotropy and consequently have a lower risk of unintended deleterious effects in secondary tissues. The importance of CREs for the development of novel morphologies is supported by the growing catalog of examples for which differences in gene specific CREs between closely related species contributed to the evolution of diversity in form [4].
While compelling evidence for the importance of CREs in evolution has come from mapping causative variants to CREs, additional evidence has emerged from genomic analyses that show abundantcisregulatory variation both within [5–8] and between
species [9–11]. Some studies have reported a bias such that genes withcisdifferences between species or ecotypes show preferential up-regulation of the alleles of one parent, possibly as a result of natural selection [7,11,12]. Consistent with the hypothesis thatcis differences are a key element of adaptive evolution, divergence for cisregulation between yeast species is more often associated with positive selection thantransdivergence [10,13].
Several transcriptional profiles contrasting crops and their ancestors have been performed, although the experimental designs used did not allow separation ofcisandtranseffects. These studies have shown that hundreds or even thousands of genes have altered expression in crops as compared to their progenitors and that genes with altered expression often show evidence for selection [23–25]. The data suggest massive alterations in gene expression profiles accompanied domestication. Work in cotton and maize shows a more frequent up-regulation of genes in the crop as compared to the wild ancestor, however whether this was due to cisortranseffects was not discernible [23,24].
In this study, we used RNAseq to parse genome-wide expression differences between maize and its progenitor, teosinte (Zea mays ssp.parviglumis), intocisandtranseffects. Three tissue types were assayed: immature ear, seedling leaf, and seedling stem. Approx-imately 70% of the 17,000 genes assayed show evidence of regulatory divergence between maize and teosinte. Over 1,000 genes show cis divergence that is highly consistent across our sampled maize and teosinte lines. For ,70% of genes with consistentcis effects, thecis effects are specific to a single tissue type. The number of genes withcisdifferences is greatest for the ear, which underwent a profound transformation in form during domestication. Genes with cis regulatory differences between maize and teosinte are correlated with genes that show evidence for positive selection during domestication whiletrans genes are not. Maize also possesses lesscisregulatory variation than teosinte over all genes and this deficit in maize is greatest for genes withcis regulatory divergence from teosinte. We observed a directional bias in genes withcisdifferences such that maize alleles were more frequently up-regulated than teosinte. Finally, our data provide a catalog ofcisandtransregulatory variation for over 17,000 genes in three tissue types for 15 maize and teosinte inbred lines.
Results
RNAseq provides expression data for more than 17,000 genes in three tissues
RNAseq data for seedling leaf, seedling stem (including the shoot apical meristem), and immature ear from six maize inbreds, nine teosinte inbreds, and 29 of their F1 hybrids were used to
examine variation in gene expression on a genome-wide scale. In
total, 259 RNAseq libraries were constructed from an average of 1.96 biological replicates for each parent inbred and F1.
Overall, 996 million, 1.13 billion, and 1.21 billion F1hybrid and
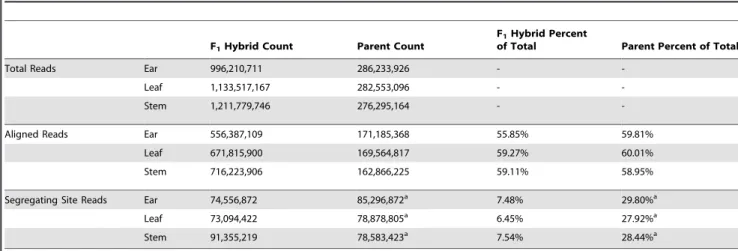
286 million, 283 million, and 276 million parent RNAseq reads were collected for ear, leaf, and stem tissue types, respectively (Table 1). These reads were aligned to custom-made parent specific pseudo-transcriptomes containing an average of 54,000 segregating sites (SNPs or small indels) in each of the 29 maize-teosinte contrasts. For F1hybrid reads, 556 million, 672 million,
and 716 million reads mapped to pseudo-transcriptomes in ear, leaf, and stem tissue, respectively. In parent inbred lines, 171 million, 170 million, and 163 million reads mapped to the pseudo-transcriptomes (Table 1). Thus, approximately the same percent-age of reads (58.2% and 59.6%) mapped to pseudo-transcriptomes in both the F1hybrids and parent datasets with about 7.15% of the
total reads mapping to segregating sites in the individual F1
hybrids and their parents.
RNAseq reads for all 29 F1hybrids and 15 parents that aligned
to segregating sites in the transcriptomes represent 23,816, 24,055, and 24,643 genes for ear, leaf and stem tissues, respectively (Table 2). The union of these three groups is 25,619 genes, which is 65% of the 39,423 genes from the maize filtered gene set (version 5b). We applied a filter to this list, requiring a read depth of 100 in both the parent inbreds and F1 hybrids. This filter
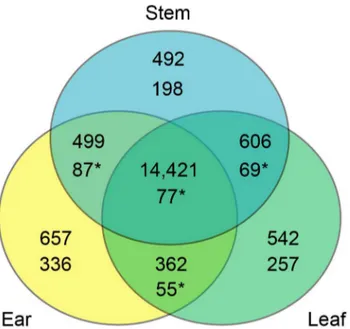
reduced the lists to 15,939, 15,931, and 16,018 genes in ear, leaf, and stem tissues, respectively. The union of these three groups is 17,579 genes or,45% of the filtered gene set. There is a large degree of overlap among the genes expressed in the three tissues with 14,421 of 17,579 genes (82%) seen in all three tissues. Of the remaining genes, 1,467 are in two tissues and 1,691 are in only a single tissue (Figure 1).
Prolific regulatory variation but few consistentcis differences
We measuredcisregulatory effects as log2of the ratio of maize
to teosinte read counts in F1hybrids, and thetranseffects as the
difference between the F1 and parent log2 ratios. Binomial and
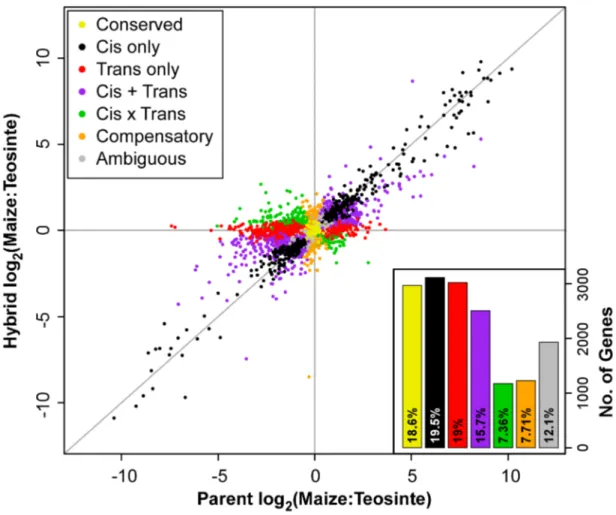
Fisher’s exact tests were used to determine whether these ratios deviated from 1:1 and to assign genes to one of seven regulatory categories (Table 3; see Materials and Methods). In overall maize versus teosinte comparisons, about 70% of genes (69.27% ear, 74.21% leaf, and 63.82% stem genes) from the three tissues were classified as having significantcisand/ortrans regulatory effects (Figure 2, Figure S1). The remaining genes were classified as having conserved (18.6%, 15.5%, and 20.7%) or ambiguous (12.1%, 10.2%, and 15.5%) expression patterns. All three tissues had similar proportions of genes falling into the different regulatory categories in the overall maize-teosinte comparison (Figure 2, Figure S1).
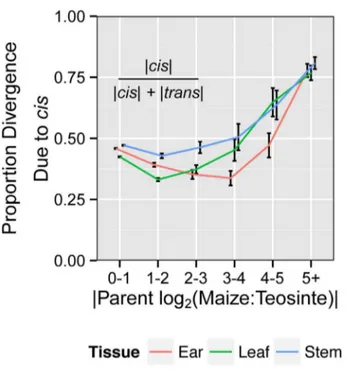
We asked what proportion of regulatory divergence between maize and teosinte was due tociseffects by calculating the ratio: |cis|/(|cis|+|trans|) [11]. Overall,cis effects account for 45%, 42% and 47% of regulatory divergence for ear, leaf and stem tissue, respectively (Table S1). We further asked the relative contribution of cis and trans in generating large expression differences by binning genes based on the magnitude of overall expression difference (|log2parent ratio|). This analysis shows that
the proportion of divergence due tocisis greater with greater total divergence in expression (Figure 3). At high degrees of expression divergence between maize and teosinte (log2change of 5 or more),
over 75% of divergence is due to cis. Thus, large expression differences appear to be caused primarily through difference incis regulation as opposed totrans.
Author Summary
A primary goal in this study was to identify genes with cis regulatory differences between maize and teosinte. Such genes in thecisonly orcisplustransregulatory categories (CCT genes) are candidates for direct targets of selection during maize domestica-tion or improvement for altered gene expression. We identified 5,618 ear, 5,398 leaf and 5,435 stem CCT genes in the overall analysis (Table 2). To exclude CCT genes with little data, the list was filtered to include only genes assayed in at least 15 maize-teosinte F1s involving at least three maize and five teosinte inbred
lines. This filtering resulted in 4,770 ear, 4,494 leaf, and 4,601 stem CCT genes (union of 8,396 genes). Next, we asked if genes on the filtered CCT list consistently favor expression of maize or teosinte alleles in the individual F1 hybrids. The goal was to
exclude CCT genes for which the significant overallciseffect was caused by a large expression bias in one or a few F1crosses. We
defined three levels of consistency: groups A, B and C for which 100%, 90% and 80% of F1s showed the same directionality,
respectively. Groups A, B, and C genes combined across tissues contained 69, 1,042, and 2,326 genes respectively (Table 2). Thus, relatively few of the 8,396 filtered CCT genes show a significant overall cis effect that is highly consistent among 15 or more F1
hybrids.
Possible directional bias incisevolution
Visual examination of Figure 1 shows a greater density of cis genes (black points) with positive log2hybrid expression ratios than Table 1.Assignable RNAseq read counts from F1hybrids and parents.
F1Hybrid Count Parent Count
F1Hybrid Percent
of Total Parent Percent of Total
Total Reads Ear 996,210,711 286,233,926 -
-Leaf 1,133,517,167 282,553,096 -
-Stem 1,211,779,746 276,295,164 -
-Aligned Reads Ear 556,387,109 171,185,368 55.85% 59.81%
Leaf 671,815,900 169,564,817 59.27% 60.01%
Stem 716,223,906 162,866,225 59.11% 58.95%
Segregating Site Reads Ear 74,556,872 85,296,872a 7.48% 29.80%a
Leaf 73,094,422 78,878,805a 6.45% 27.92%a
Stem 91,355,219 78,583,423a 7.54% 28.44%a
aA higher number and percentage of reads map to segregating sites in parents due to each set of parent reads being used in multiple comparisons. In contrast each of
the F1comparisons can only map to segregating sites between two pseudo-transcriptomes.
doi:10.1371/journal.pgen.1004745.t001
Table 2.Number of total, CCT (cisonly orcis+trans),transonly, andcisonly genes for which RNAseq data was collected and expression was assayed.1
Ear Leaf Stem Union
Genes with mapped RNAseq reads 32,858 32,645 33,316 34,636
Genes with reads and segregating sites 23,816 24,055 24,643 25,619
Genes with 100 or more total depth 15,939 15,931 16,018 17,579
Total CCT genes 5,618 5,398 5,435 10,095
Filtered CCT genes2 4,770 4,494 4,601 8,396
ABC-List CCT 1,545 1,327 1,371 3,027
C-List CCT 990 869 940 2,326
B-List CCT 512 436 404 1,042
A-List CCT 43 22 27 69
ABC-Listtransonly 1143 1273 534 2665
C-Listtrans only 666 790 385 1721
B-Listtrans only 419 455 144 984
A-Listtrans only 58 28 5 90
ABC-Listcisonly 859 594 832 1866
C-Listcisonly 561 412 582 1380
B-Listcisonly 272 172 234 590
A-Listcisonly 26 10 16 41
1Only genes from the maize filtered gene set (version 5b) were considered. 2Filtered to include genes assayed in 15 F
1hybrids including three unique maize and five unique teosinte inbred lines.
with negative ratios, suggestingcisevolution during domestication more often favored alleles with increased expression in maize relative to teosinte. Consistent with this visual observation, the number of CCT (ABC list) genes with a positive (maize biased) versus negative (teosinte biased) log2hybrid expression ratio are
947:598, 844:483 and 826:545 for ear, leaf and stem, respectively (Table S2). All of these ratios are significantly different from a 50:50 unbiased expectation (binomial test, p,0.001). Additionally, a plot of the distribution of log2hybrid expression ratio for CCT
genes shows a greater density of genes with positive values for all three tissues (Figure 4, Figure S2).
The apparent bias in directionality ofcisevolution could be the result of error in our bioinformatics pipeline. One potential error is preferential alignment of maize RNAseq reads due to greater sequence divergence of teosinte lines from the reference transcriptome (B73) as compared to maize inbred lines. If such systematic error exists, the observed bias in directionality of cis evolution would be expected to be greatest for F1s involving the
reference B73 (zero alignment bias of maize reads and high bias for teosinte) and less extreme for crosses between teosinte and non-reference maize lines (moderate bias for non-non-reference maize and high bias for teosinte).
To test this expectation, we calculated the number of CCT (ABC list) genes with positive versus negative log2 hybrid
expression ratios for F1s involving B73 and non-B73 maize
parents separately. For ear tissue, there are 569 teosinte-biased and 975 maize-biased genes for B73 F1s and 606 teosinte-biased
and 939 maize-biased genes for non-B73 F1s. A Fisher’s exact test
fails to reject the null hypothesis of equivalent ratios (p = 0.18). There was also no evidence for non-equivalent ratios with the other two tissue types (Table S3). Thus, we see no evidence for significantly greater bias for maize alleles in crosses involving B73 versus the non-reference maize parents, suggesting alignment bias does not explain the excess of CCT genes with the maize allele expressed higher than the teosinte allele.
Gene expression variation is greater in teosinte
Both the domestication bottleneck and selection during domestication are expected to reduce variation in maize as compared to teosinte. We asked if these reductions in variation are apparent in our gene expression data. To quantify whether variation in maize or teosinte was the source of the variation in expression ratios among F1hybrids, a linear model was fitted on a
gene-by-gene basis with maize and teosinte inbred parent as explanatory factors for hybrid expression ratio. Among,13,000 genes included in this analysis, the maize parent explains only 85% as much variation as the teosinte parent (Figure 5, Table S4). The reduction is consistent across all seven regulatory categories (Figure S3). This represents the general reduction in diversity of maize as compared to teosinte, presumably a result of the domestication bottleneck.
While the bottleneck predicts reduced expression variation in maize overall, genes that were targets of selection for regulatory differences should have an even greater reduction in expression variation. Consistent with this expectation, we observed a greater reduction in variation in maize as compared to teosinte for CCT genes than the full set of,13,000 genes (Figure 5, Table S4). For the CCT-ABC genes, maize contributes 78% of teosinte variation,
Figure 1. Overlap of genes assessed in the three tissues overall and in the CCT-AB gene list. Each compartment of the Venn diagram contains the tissue combination on top, number of genes overall in the middle, and number of genes from the CCT-AB gene list on bottom. CCT-AB overlap numbers marked by an ‘‘*’’ indicate significantly more overlap than expected by chance (permutation tests, p,1e-5). In the overall analysis the vast majority of genes (82%) were assayed in all three tissues. While this percent is much smaller for the CCT-AB candidate gene list (,7%), this is still more of an overlap than
expected by chance. The much higher degree of overlap of CCT-AB genes than expected suggests some CREs act in multiple tissues. Additionally, there are also many single tissue CCT-AB genes, which points towards the manyciselements that appear to function in tissue specific patterns.
doi:10.1371/journal.pgen.1004745.g001
Table 3.Regulatory category as defined by significant (Sig.) with FDR,0.005 or not significant (Not Sig.) binomial tests (BT) and Fisher’s exact tests (FET).
Category Parent BT Hybrid BT FET Favored allele?
Cis Sig. Sig. Not Sig
-Trans Sig. Not Sig Sig.
-Cis+Trans Sig. Sig. Sig. Same
Cis6Trans Sig. Sig. Sig. Opposite
Compensatory Not Sig Sig. Sig.
-Conserved Not Sig Not Sig -
-Ambiguous All other patterns of significance or non-significance
for the AB group,73%, and for the A group only 54% of teosinte variation. Thus, among our strongest cis regulatory candidate genes (A group), the data indicate that maize explains only about half as much of thecisregulatory variation as teosinte.
The reduction in gene expression variation in maize versus teosinte is also seen in the number of individual genes with significant effects due to the maize and/or teosinte parent on the F1expression ratio (Table S5). In terms of numbers of genes on the
AB list CCT genes, there were 2.0 to 2.5 fold more genes for which only the teosinte parent contributed significant variation to the F1 expression ratios than genes for which only the maize
parent contributed. This difference is 5-fold in favor of teosinte for CCT genes on the A list.
Selection candidate genes are enriched for CCT genes
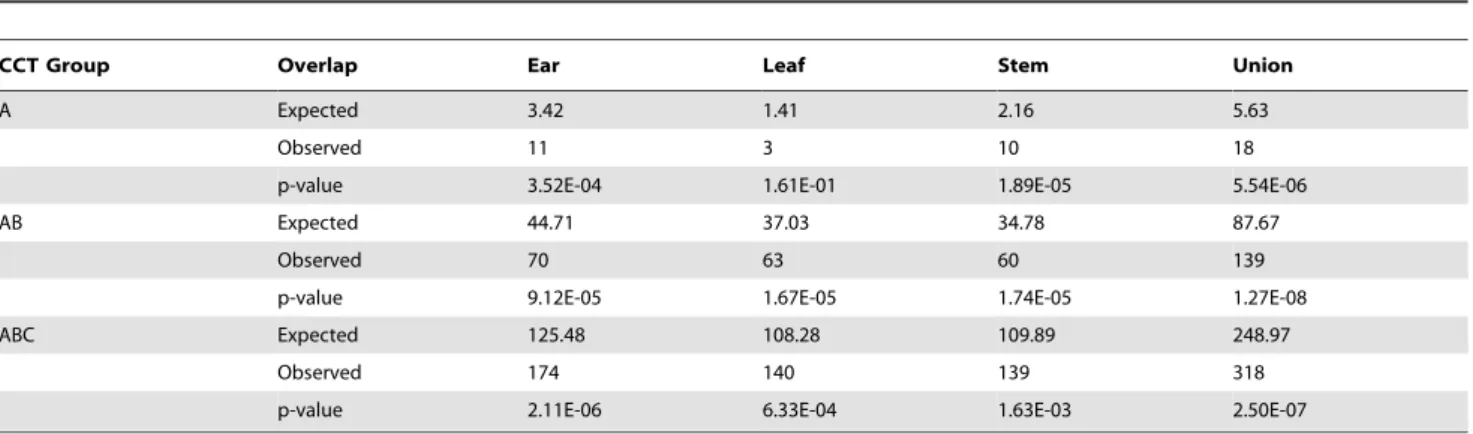
We compared CCT genes to putative targets of selection during maize domestication and improvement from a recent study [26]. There is significant enrichment for CCT genes among selection candidate genes for all three tissues (Table 4). The strength of the association with selected genes is strongest for the union of CCT genes from all three tissues. For example, there are 139 CCT-AB genes among the selected genes, while 87.7 would be expected by chance. Also, there were 10 CCT (A-list) genes from stem tissue
among selected genes when only 2.16 were expected, a nearly 5-fold enrichment.
XPCLR scores (cross population composite likelihood ratios) quantify the degree of support for positive selection on a genomic region. A comparison of the distributions of ln(XPCLR) scores at the transcriptional start site (calculated by Huffordet al.[26]) for the union of CCT genes (A, AB, and ABC) versus genes with conserved expression between maize and teosinte shows that CCT genes having a higher mean XPCLR than conserved genes (Figure 6). The distribution for conserved genes is significantly different than all three CCT gene lists in terms of shape (Kolmogorov-Smirnov test, p,1.59e-5) and overall mean (t-test, p,5.00e-5). This pattern was also observed for tissue specific comparisons (Figure S4).
A goal of this study was to explore the relative importance ofcis versustransregulatory divergence during maize domestication. To address this question, we examined the evidence for selection on genes withcisonly effects in comparison to genes that havetrans only effects. Fisher’s exact tests on 262 contingency tables
tabulating cis and transgenes with selection feature genes from Huffordet al.[26] showcisonly genes are significantly enriched (p-value,0.05) for selection in 6 of 9 comparisons, whiletransonly genes are never enriched and are actually significantly underrep-resented among selected genes in two cases (Table 5).
Figure 2. Log2of parent versus hybrid ear tissue allele-specific expression ratios.The parent (x-axis) versus F1hybrid (y-axis) allele-specific
expression ratios for 15,939 genes are plotted against each other. Regulatory category in terms of the combination of significant statistical tests determined using the method described in methods is shown designated by color. Proportion and count of genes falling into the various regulatory categories are also shown in the lower right hand corner barplot.
Microarray and RNAseq data only partially correspond
We assessed the degree of correspondence between our CCT genes and 612 differentially expressed genes identified by a recent microarray study in maize [24]. We constructed 262 contingency tables for differentially expressed (DE) and non-differentially expressed (NDE) genes from the two studies. A Fisher’s exact test shows a highly significant degree of correspondence between the two studies for all three tissues (Table 6). Using our CCT-AB lists, ,24 genes are identified as DE in both studies per tissue while about 7 are expected by chance. However, the absolute level of correspondence between the two studies is rather low. For example, of the 350 leaf genes identified as DE by RNAseq, only 24 (7%) were also identified by the microarray study (Table S6). Thus, while the overlap between our two studies is statistically significant, the two methodologies resulted in largely different lists of DE genes.
The largely different lists of DE genes identified by microarray and RNAseq analysis could be due in part to the fact that the microarray analysis includes genes with trans and cis6trans
differences. To assess the proportion of the 612 DE genes from the microarray study that havetransversusciseffects, we examined the RNAseq-based regulatory categories of the ,250 DE genes (241, 262, 259; ear, leaf, and stem) for which there is both microarray and RNAseq data (Table S7). About 20% of these genes are classified astransonly orcis6transby RNAseq, while 55% are classified as eithercisonly orcis+trans. The remaining 25% are classified as conserved, ambiguous or compensatory. These results suggests the very different lists of DE genes from the two technologies can only be explain in part by inclusion of genes withtransonly effects in the list of DE genes from the microarray
study. Most of the difference between the lists is likely due to differences in tissue, germplasm, environment, sampling error, or other sources of error.
CCT genes are unrelated to differentially methylated regions
In a recent study, Eichten et al. [27] identified differentially methylated regions (DMRs) in maize and teosinte. We compiled a list of the nearest genes both upstream and downstream of each DMR, which gave a list of 332 genes. Of these genes, we have RNAseq data from 115, 116, and 121 for the ear, leaf, and stem tissues, respectively. Of these genes, 19, 13, and 17 genes were on the CCT-ABC gene lists (Table S8). We asked if CCT-ABC list genes are over-represented among the DMR associated genes as compared to random expectation and found that they are not (Fisher’s exact test, p.0.10). Finally, DMR methylation does not
Figure 3. Proportion of expression divergence due to cis regulatory differences.The amount of total differential expression between the maize and teosinte parents due to the directly measured
ciseffect (F1hybrid expression ratio) is shown with error bars depicting
95% confidence intervals. Total divergence (log2of parent expression
ratio) was binned from 0–1, 1–2, 2–3, 3–4, 4–5, and 5+. Divergence due to cis effects increases with total divergence, suggesting large expression differences tend to be caused by cis rather than trans
regulatory differences.
doi:10.1371/journal.pgen.1004745.g003
Figure 4.Cisversus estimatedtransregulatory effect for CCT-ABC genes in the ear.CCT genes have a directional bias with more genes overall favoring the maize allele (positive ratio) than teosinte (negative ratio). Genes with consistentcisregulatory differences tend to favor the domesticated maize allele.
doi:10.1371/journal.pgen.1004745.g004
Figure 5. Ratio of the average maize to teosinte R2values for individual genes from models explaining hybrid expression by maize and teosinte parent.In all three tissues, the proportion of maize to teosinte R2decreases in candidate CCT gene lists with the
strongest candidates (CCT-A) having the most extreme reduction in variation in maize relative to teosinte. Error bars indicate 6 one standard error.
correspond with the allele specific expression of CCT-ABC list genes with only,50% agreement between methylation status and allele expression (Table S9).
Dominant and additive gene expression inheritance
We compared the proportions of genes showing dominant versus additive gene action in thecisonly andtransonly ABC lists. Dominant gene action oftransonly genes will occur when there are haplo-sufficient loss of function (LOF) alleles at their trans
regulators. In contrast, the effects ofcis regulatory elements are expected to be purely additive in absence of transvection or similar mechanism [28].Cisonly genes classified as having dominant gene action may indicate error in classification due to trans effects below the level of statistical detection. Consistent with the expectation that dominance is more likely fortrans only genes, the proportion of genes classified as dominant is higher fortrans only genes in all three tissue types (Figure 7, Table S10).
It has been proposed that the allelic variants responsible for evolution during domestication are primarily recessive LOF alleles [29]. Under this model, a non-domesticated allele would be dominant to the recessive LOF domesticated allele. Among cis only genes with dominant gene action, dominance of the maize versus teosinte allele does not differ from the 50:50 expectation (Figure 7, Table S10). Among trans only genes with dominant gene action, the maize allele is dominant to the teosinte allele more often than expected by chance. These results are counter to the proposal that domestication favored recessive LOF alleles.
Candidate genes enrichment in various functional categories
We examined CCT-ABC genes for enrichment of several functional classes of genes including transcription factors, genes in known metabolic pathways, genes underlying QTL, and gene ontology (GO) groups. First, a list of maize transcription factors and their corresponding families were compiled from the transcription factor database [30]. Although CCT genes (AB-list) were found to be slightly enriched for several transcription factor families (ARF and MADS-MIKC) by Fisher’s exact tests, these results do not stand up to Bonferroni multiple test correction (Table S11). We conclude that there is no compelling evidence that CCT genes are enriched for transcription factors.
CCT (AB list) genes were also compared with results from a recent QTL mapping experiment for a number of domestication and improvement traits [31]. We compared observed versus expected overlap between CCT genes from the three tissues to the genes located within 1.5 LOD QTL support intervals for 11 traits. Testing was done on a trait by trait basis and restricted to 1.5 LOD QTL intervals containing 20 or fewer genes. After correction for multiple testing (Bonferroni), no significant enrich-ment for CCT-AB genes in domestication QTL was observed (Table S12). The greatest enrichment was seen with the trait ear diameter for which there were four CCT genes assayed in ear tissue within the QTL intervals when only 1.22 were expected by chance (Fisher’s exact test, p = 0.03).
Table 4.Fisher’s exact tests for the overlap between domestication and improvement selection candidate genes and CCT genes from each of the three experimental tissues.
CCT Group Overlap Ear Leaf Stem Union
A Expected 3.42 1.41 2.16 5.63
Observed 11 3 10 18
p-value 3.52E-04 1.61E-01 1.89E-05 5.54E-06
AB Expected 44.71 37.03 34.78 87.67
Observed 70 63 60 139
p-value 9.12E-05 1.67E-05 1.74E-05 1.27E-08
ABC Expected 125.48 108.28 109.89 248.97
Observed 174 140 139 318
p-value 2.11E-06 6.33E-04 1.63E-03 2.50E-07
doi:10.1371/journal.pgen.1004745.t004
Figure 6. Density plots of the ln(XPCLR) score for the union of conserved versus CCT candidate genes across tissues. Union CCT (A, AB, ABC) gene lists consisting of all genes identified as CCT in any of the three tissues have a significantly higher XPCLR score in the 10 kb window holding the transcriptional start site than conserved (Con) genes. The natural log transformed XPCLR scores for CCT genes are progressively statistically higher than the union of genes identified as conserved in the initial analysis. The distributions of conserved and CCT genes are significantly different by both the shape sensitive Kolmogorov-Smirnov test (upper right of heatmap) and simple difference of the means t-test (lower right of heatmap). Heatmap scale is in log10(p-value).
A test for enrichment of CCT genes andtransonly genes in 15 different metabolic pathways defined in the Kyoto Encyclopedia of Genes and Genomes (KEGG) was done using Fisher’s exact test on 262 contingency tables. There was no compelling evidence for
enrichment/depletion of either groups of genes in any of the 15 pathways tested (Table S13). The smallest p-value identified was for the fatty acid degradation pathway in leaf tissue for CCT ABC genes (p = 0.008), however this result does not remain significant after Bonferroni multiple test correction.
We tested for GO term enrichment and depletion in the CCT andtransonly gene lists. These analyses found significant GO term associations in the leaf CCT-ABC gene list for depletion for DNA binding (Table S14). Fortransonly genes, significant enrichment for
a number of GO terms in the ear tissue was detected for transcription factor and photosynthesis related terms with additional enrichment for ribosomal GO terms found in the leaf tissue (Table S14).
Discussion
Regulatory differences between maize and teosinte
Approximately 70% of the,17,000 assayed genes exhibit some form of regulatory difference between maize and teosinte, suggesting considerable regulatory divergence has occurred during maize domestication and improvement (Figure 2, Figure S1). Similar proportions of gene regulatory differences were observed in recent studies ofDrosophila [11] and yeast [13] species. The
Table 5.Fisher’s exact tests (1 tailed) for enrichment ofcisandtransonly genes in domestication/improvement selection features defined by Huffordet al.[26].
Tissue Regulatory Category F1Comparisons Consistent Observed Expected p-value
Ear Cisonly A List 5 1.998 0.043
Leaf 1 0.658 0.499
Stem 3 1.316 0.138
Ear Transonly A List 4 5.327 0.818
Leaf 2 2.538 0.736
Stem 1 0.282 0.256
Ear Cisonly AB List 36 24.449 0.018
Leaf 25 14.381 0.004
Stem 32 19.647 0.006
Ear Transonly AB List 28 41.954 0.020
Leaf 31 41.263 0.968
Stem 16 12.032 0.222
Ear Cisonly ABC List 95 70.113 0.002
Leaf 56 46.902 0.091
Stem 84 65.615 0.016
Ear Transonly ABC List 78 97.036 0.033
Leaf 89 104.896 0.964
Stem 42 43.148 0.935
doi:10.1371/journal.pgen.1004745.t005
Table 6.Fisher’s exact tests for the overlap between differentially expressed genes from the microarray study [24] and CCT genes from each of the three experimental tissues in our work.
CCT Group Overlap Ear Leaf Stem Union
A Expected 0.5563 0.2757 0.3593 1.0388
Observed 4 2 2 7
p-value 2.14E-03 3.00E-02 4.92E-02 7.12E-05
AB Expected 7.5008 6.8916 6.2475 16.0098
Observed 23 24 25 47
p-value 1.56E-06 8.98E-08 2.91E-09 1.03E-11
ABC Expected 21.7735 19.9658 20.5788 45.9927
Observed 52 48 46 90
p-value 9.58E-10 4.78E-09 1.05E-07 5.76E-12
high amount of expression divergence between maize and teosinte is not surprising given the incredible divergence in their morphology and the exceptional expression variation existing within maize itself. For example, a recent study found 27.9% of maize genes are only expressed in a subset of maize inbred lines with over a thousand genes absent from the reference B73 genome [32].
The high fraction of genes exhibiting regulatory divergence between maize and teosinte should be viewed with this perspec-tive. It includes all genes with specific combinations of significant binomial and Fisher’s exact tests as outlined in Table 3. Given the massive amount of data analyzed, statistically significant cisand trans effects were detected for as small as 1.02 fold expression differences, which seem unlikely to have biological significance. Moreover, many genes with significant regulatory differences between maize and teosinte ‘‘on average’’ show diversity in expression within maize and within teosinte such that the favored allele can change depending on the specific pair of maize-teosinte inbred lines.
cisandcis+trans(CCT) candidate genes
Our primary focus was on genes withcisregulatory differences between maize and teosinte as this class of genes should include
many direct targets of selection for domestication traits. The overall analysis classifies 8,396 genes (47.8%) as CCT genes that show cis divergence between maize and teosinte. This is a remarkably high proportion that reflects the considerable statistical power to detect small differences, likely with minimal biological importance, and does not consider whether the expression difference is consistent across maize-teosinte F1 comparisons.
Thus, we focused our analysis on CCT A, B, and C gene lists showing consistent directionality of expression bias in 100%, 90% and 80% (respectively) of maize-teosinte comparisons. This approach narrows the list to 1,079 genes (A and B lists) that we consider our most robust candidates for genes withcisregulatory differences between maize and teosinte.
Ear tissue possesses the most genes withcis regulatory differences
CCT candidate genes from the three tissues were largely different. Among the 1,079 CCT genes on A and B lists,,73% were identified in only a single tissue. This includes 336 ear, 257 leaf, and 198 stem specific genes. In contrast, only 77 of the 1,079 CCT genes were classified as CCT candidates in all three tissues. These results are consistent with previous studies that examinedcis regulatory divergence between taxa in multiple tissues [8,12]. These results highlight the importance of assaying multiple tissues and developmental stages. It also exposes a major weakness of genomic scale expression assays such as ours. Given the complex ways in which gene expression is regulated across different tissue types, genomic-scale assays in one or even multiple tissues are a very blunt instrument for exploring the evolution of gene expression.
While CCT genes are mostly tissue-specific, genes overall are not. Of the 17,579 genes assayed with at least 100 read depth in both the parents and F1hybrids, 14,421 were expressed in all three
tissues. This high proportion of genes (82%) expressed in all tissues creates a false impression that sampling one tissue type at one point in developmental time provides a reasonable assay of all tissues at all developmental times. The discordant observations that CCT genes are mostly tissue specific, while genes overall are expressed in all tissues can be explained by tissue specific enhancers or repressors.
Among the sampled tissues, it is notable that ear has the largest number of overall (555) and tissue specific (336) CCT genes (Figure 1). The greater number of ear CCT genes identified may be related to the profound morphological changes that differen-tiate the maize and teosinte ear. By comparison, the sampled leaf and stem tissues differ only by size between maize and teosinte and not morphological structure. Similar to our results, an imbalance in number of DE genes in different tissues was also observed in a recent study inArabidopsis[12], where tissues differed by up to 80% in number of DE genes.
Is there a bias toward increased expression of the maize allele?
In the F1 hybrid analysis,,55% of genes have higher maize expression than teosinte. Higher expression of the maize allele also occurs in the parent inbred lines, except for leaf, where an equal number of genes favor maize and teosinte alleles. This trend of up-regulated maize expression extends to the CCT gene lists, where ,60% of genes favor the maize allele (Figure 4). Preferential expression for one of the parents (maize) is consistent with several previous studies in multiple organisms including maize [24], cotton [23],Arabidopsis[12],Cirsium[7], and fruit fly [11]. While our study mitigates alignment bias with parent specific
pseudo-Figure 7. Proportion ofcisonly andtransonly genes identified as having dominant or additive inheritance. The proportion of genes showing dominant (red) versus additive (blue) gene action forcis
only andtransonly AB lists. For all tissues,transonly genes have a higher rate of dominance, however this difference is only significant for the ear and leaf tissues (Fisher’s exact test, FET). The proportion of genes in thetransonly lists that are dominant for the teosinte allele (green) and the maize allele (yellow) is shown in the barplot to the right of each pie graph. There is significant deviation from the neutral expectation (1:1) for the ear and leaf tissue (binomial test, BT). Fisher’s exact and binomial test significance level indicated by ‘‘*’’ p,0.05, ‘‘**’’ p,0.005, and ‘‘***’’ p,0.0005.
transcriptomes and perfect alignment to segregating sites, this method is unlikely to fully eliminate this bias. Consequently, we cannot exclude the possibility that bias for maize expression is an artifactual result. The mechanism for a general up-regulation of maize alleles across many genes is unclear. One possibility would be a remodeling of the epigenetic landscape during domestication.
cisversustransregulatory divergence
This study showscisandtransregulatory differences account for ,45% and ,55% of regulatory divergence between maize and teosinte, respectively (Table S1). These values suggest relatively equal contributions of these two mechanisms to regulatory divergence. However, this ignores the contribution of cis effects to large expression differences wherecisaccounts for nearly 80% of the expression divergence (Figure 3). The observation thatcis effects account for the majority of expression divergence of genes with large expression differences was also seen inDrosophila[11]. The prominence of cis effect among genes with the largest divergence in expression may indicate cis regulation is a more effective mechanism than trans for producing large changes in gene expression.
A recent study using microarrays [24] showed greater overlap than expected by chance with CCT candidate genes (Table 6). However, the two studies produced largely different lists of DE genes. One difference between the RNAseq and microarray study is that the latter includes DE of genes with trans only and cis6trans regulatory regimes, which are excluded from RNAseq
based CCT lists. This difference offers only a partial explanation for the differences between the two studies. Of 262 microarray DE genes assayed by RNAseq in leaf tissue, RNAseq classifies 31 as transonly and 16 ascis6trans(Table S7). Another 153 genes on the microarray DE list are classified ascis only or cis+trans by RNAseq, leaving 62 genes (24%) for which the two studies disagree. Although much of this disagreement can likely be attributed to factors such as differences in sampling or other sources of error, it reminds us of the imprecision in these types of data.
Regulatory variation was under selection during domestication
During domestication, maize experienced both a population bottleneck that caused a general reduction in genetic diversity as well as selection that further reduced diversity in targeted regions of the genome [33,34]. A recent genome-wide analysis estimated that the maize genome possess approximately 81% of the nucleotide diversity found in teosinte [26]. Our data allows us to ask whether maize domestication has caused a parallel reduction incisregulatory variation. Overall, maize possesses only,85% of thecisregulatory variation seen in teosinte (Figure 5, Table S4), a value very close to the reduction in nucleotide diversity. Moreover, the observed reduction incis regulatory variation is greatest for genes that show evidence forcis differences between maize and teosinte. The loss ofcis regulatory variation increases over C, B and A lists of CCT genes with CCT A-list genes possessing only ,50% of thecisregulatory variation seen in teosinte. This trend suggests selection during the domestication process for cis regulatory variation. The high level of expression variation still present in teosinte also represents an untapped source of diversity for maize breeders, which could be explored with transcriptome profiling.
Genomic scans for evidence of selection during adaptive transitions have become a powerful tool in evolutionary biology [35]. Such scans provide both a measure of the prevalence of
selection and a list of candidate genes for further study. In comparisons of RNAseq data with a recent genomic selection scan in maize [26], we sought to determine the specific target of selection in terms ofcisandtrans. Ifcisregulatory evolution was an important mechanism during maize domestication, then CCT genes should be enriched for selection candidates. In contrast, genes whose expression divergence between maize and teosinte are governed by trans effects should not be enriched for selection candidates, given that the trans regulators and not the trans responsive genes were the putative targets of selection. Consistent with these expectations, we observed a highly significant enrich-ment for selection candidate genes among CCT andcisonly genes with no enrichment amongtransonly genes (Tables 4, 5).
Although greater than expected overlap was observed between selection candidates and CCT genes, the degree of correspon-dence is far from perfect. For example, 25 of 36 CCT A-list genes assessed in the genome selection scan from ear tissue do not show evidence for selection. The misalignment between the selection candidate and CCT lists is likely due to both biological factors and artifacts. Domestication genes such astga1for which the causative change appears to have been an amino acid change will not appear on CCT gene lists [36]. Similarly, genes withcisdifferences that were the target of soft sweeps or for which the signature of selection is weak for other reasons are expected to be missed in selection scans. The candidate for the major gene (ZmSh5.1) responsible for the loss of seed shattering during maize domesti-cation is not on the list of selection candidates [26,37]. These properties of genomic scans remind us of their limits and the probabilistic arguments on which they are based.
Does domestication favor recessive loss of function alleles?
It has been proposed that the allelic variants responsible for evolution during domestication are often recessive LOF alleles such that the wild progenitor allele would be dominant to the domesticated allele [29]. While there is some support for this hypothesis from rice in the form of increased frequency of deleterious amino acid changes [38], recent reviews of QTL studies found no compelling evidence for dominance of the progenitor alleles and few LOF alleles among positionally cloned domestication genes [39,40]. There is some support that LOFs are relatively common among genes contributing to varietal differ-ences within crops [39,40].
Dominance is expected to be uncommon for gene expression of cis only genes, since dominance at cis only genes requires a mechanism such as transvection [28] and this is unknown in maize. In absence of mechanisms such as transvection, if a CRE in the progenitor allele of acisonly gene produced 5 RNAseq reads and disruption of the CRE reduced expression to 1 read per allele in the crop, then the diploid progenitor would have 10 reads, the crop would have 2 reads, and their F1hybrid would have 6 (5+1)
reads. The gene would be classified as purely additive. However, fortransonly genes, if haplo-sufficient, dominance of the maize or teosinte allele could be observed.
Consistent with the first expectation, we found greater
dominance among trans only genes versus cis only genes
GO terms for transcription activities enriched intrans genes
GO term analysis showed genes involved in sequence-specific DNA binding transcription factor activity were enriched in the transonly class (Table S14). Thesetransonly genes are responding to unknown upstream regulators that differ between maize and teosinte. It is the putative upstream regulators and not thetrans only genes themselves that are the potential targets of selection during domestication/improvement. This result suggests that transcription factors are frequently downstream in regulatory cascades that were targets of selection during maize domestication and improvement. The identity of the upstream regulators of our trans only genes are unknown but they likely include genes involved in signal transduction, hormonal regulation of gene expression, and other transcription factors. The CCT gene lists are candidates for these unknown regulators of thetransonly genes.
A catalog of genes withcis regulatory variants
A product of this study is a resource for researchers looking for preliminary data on the expression patterns of specific genes. To facilitate this use, two supplemental datasets have been made available from the Dryad Digital Repository: http://dx.doi.org/ 10.5061/dryad.4kh67. Supplemental dataset 1 contains overall data for the complete set of 25,619 genes including regulatory classification, summed RNAseq read counts, expression ratios, and other summary information for each gene. Supplemental dataset 2 contains read counts for F1hybrid and parent contrasts on a
cross-by-cross basis.
An example of the value in these supplemental datasets isbarren stalk1(ba1), a known maize single gene mutant that causes a defect in branch initiation for both the whole plant and tassel [41]. In our study, ba1was one of our strongest candidates with all assayed crosses showing higher expression of the maize allele in the ear. The overall shift in expression was substantial (,4-fold) and this shift was caused solely bycisregulatory differences.ba1was also found to be under selection during maize domestication in two independent studies [26,41]. These combined observations suggest that selection for a CRE drove up-regulation of ba1in the ear, perhaps resulting in a greater number of rows (branches) of kernels in the maize ear as compared to teosinte. Compelling evidence for this hypothesis could be obtained by fine-mapping and identifying the hypothesized CRE and demonstrating with expression assays that the maize and teosinte alleles of the CRE have the imagined effects on gene expression during ear development and on phenotype (kernel row number) in the adult ear. ba1 illustrates the power of genomic scans to identify strong candidates for future study that can inform us about the fine details of evolution under domestication.
Materials and Methods
Plant material, RNA preparation, and sequencing
Six maize inbred lines, nine teosinte inbred lines, and 29 of their 54 possible maize-teosinte F1hybrids were used in this experiment
(Table S15). An average of 1.96 biological replicates of each genotype was used. Plants were grown in growth chambers with a 12 hour dark-light cycle for up to 6 weeks, after which they were moved to a greenhouse. Fifty to 100 milligram samples of the immature ear, leaf, and seedling stem were harvested for RNA extraction during this time. Leaf and seedling stem (including the shoot apical meristem) tissue was collected at the v4 leaf stage. Single ears from maize and F1hybrid plants were collected when
the ears weighed 50 to 100 milligrams with silks just beginning to be visible. Teosinte ears were also collected when silks just started
to appear, however, due to the small size of teosinte ears 7 to 16 ears (average of 11.27) from each plant were pooled to obtain ,50 milligrams of tissue. These three tissue types are referred to as the ear, leaf, and stem tissues.
Total RNA was extracted from the plant tissues using a standard TRIzol protocol, quantified by spectrophotometer, and normalized to 1mg/mL in nuclease free water. Starting with 5mg total RNA, we generated polyA selected, strand specific, barcoded RNAseq libraries with a previously published protocol using a five minute fragmentation time and 12 PCR amplification cycles [42]. Library adapters used barcode sequences of four and five base pairs (Table S16) designed to balance percent nucleotide composition within the first five base pairs of sequence reads and to have at least two base pair differences from any other barcode. RNAseq libraries were then pooled in groups of 14 (F1s)
or 15 (parents), and the pooled libraries sequenced on one lane (parents) or two lanes (F1s) of an Illumina HiSeq2000 sequencer.
The raw sequence data has been deposited in NCBI Sequence Read Archive with accessions SRX710894-711341 and the Gene Expression Omnibus (GEO) Series with accession number
GSE61810 (http://www.ncbi.nlm.nih.gov/geo/query/acc.
cgi?acc=GSE61810).
Bioinformatics
Mitigating mapping bias through use of multiple references or enhancing the reference with segregating sites is critical for allele specific studies [43,44]. We investigated parent specific de novo transcriptome assemblies using Trinity [45], but ultimately pursued an enhanced reference approach due to poor Trinity assembly qualities (Text S1). The pipeline developed in this study, based on the work by Wanget al.[46], accounts for mapping bias through parent specific pseudo-transcriptomes generated by incorporating polymorphisms derived from non-B73 genomic paired-end reads into the B73 reference followed by alignment and evaluation of RNAseq read depth at segregating sites.
Pseudo-transcriptomes were constructed using the B73 refer-ence genome (version AGPv2) and transcriptome (version ZmB73_5a_WGS) plus,403.1 million (17.56coverage)
paired-end genomic sequencing reads from each of the other 14 inbred lines (Table S17). For each of the 14 non-B73 inbreds, paired-end genomic sequencing reads were aligned to the reference genome with the BWA aligner (version 0.5.9) [47]. Only uniquely mapping reads with up to two mismatches were used to limit false polymorphism detection due to paralogous read alignment. Single nucleotide polymorphisms (SNPs) and small insertions and deletions (indels) with respect to B73 were called using the GATK package (version 1.0.5588) [48,49] and filtered (Text S1) to include only polymorphisms that were homozygous in the inbred with read depth of at least 46. A strand bias filter was also applied to ensure that the polymorphism was detected on both the plus and minus strand. Polymorphisms surviving these filters were then inserted into the reference B73 transcriptome to make a pseudo-transcriptome for each parent.
For each of the 29 maize-teosinte pairs, a robust set of segregating sites was determined by comparing the pseudo-transcriptomes of the two parents and taking the sites where: the two parental alleles differed, coverage in genomic read alignment was at least four for both parents within the read length (88 bp) of the site, and no heterozygous polymorphisms were detected in genomic read alignments of the two parents within the read length of the site.
RNAseq reads from each F1 hybrid and each corresponding
used for the B73 parent) using the Bowtie aligner (version 0.12.7) [50]. We assessed allele specific expression by counting read depth from each parent at segregating sites (Table S18). Since only perfect alignments were allowed, assignment of reads to parents was straightforward (a read from a given parent could only align to this parent’s allele at a segregating site).
Maize:teosinte gene expression ratios
We calculated F1hybrid and parent maize:teosinte expression
ratios for each gene of the 29 individual F1hybrid comparisons.
Total depth at segregating sites summed over genes was highly correlated between biological replicates (average of 95%, Table S19) and consequently read depth was pooled for the various genotypes. Gene expression ratios for F1s (e.g. B736TIL01) were
then calculated by dividing total maize read depth by total teosinte read depth summed over all segregating sites in the gene. The parent expression ratios for individual maize-teosinte comparisons were calculated the same way from parental RNAseq reads, except total parental read depths at segregating sites were corrected for differences in total number of reads between the two parent lines (Text S1). The result of these calculations was a set of 29 matched F1and parent expression ratios consisting of maize:teosinte read
counts for each gene.
We produced overall maize-teosinte expression ratios for each gene by summing read depth over all maize-teosinte hybrid comparisons. To calculate the overall F1 expression ratio, the
maize and teosinte read depths from the F1hybrids were simply
summed over all segregating sites in a gene and across all hybrids. The calculation of the overall parent expression ratio required weighting to avoid counting the parent reads multiple times for each of the F1 comparisons in which it was a parent and to
compensate for the fact that different parents had variable total numbers of reads (Text S1). Only genes with a read depth of at least 100 in both the F1and its parent comparison were included.
The result of these calculations was an overall F1and parent ratio
of read counts for each gene. To check whether single F1s caused
aberrant estimates of the cis effect with these overall ratios, we performed adrop1analysis and found that inclusion/excluding of single F1s had on negligible effects (Text S1 and Figure S5).
Finally, as a exercise in proof of concept, we compared allele specific expression results for several specific genes of known importance in domestication with expectations from the literature and found a good fit between our data and published results (Text S1 and Table S20).
Testing for cisandtranseffects
The combination of F1 hybrid and parent inbred expression
data allows estimation of both the cis and transeffects on gene expression. For the F1 hybrids, the maize and teosinte alleles at
each gene are in a commontranscellular environment, and thus any deviation of the maize:teosinte F1expression ratio from 1:1
represents purelyciseffects. By contrast, the maize:teosinte parent expression ratio is a combination of thecisandtranseffects and any deviation of this ratio from 1:1 reflects the combinedcisplus trans effects. Therefore, the trans effects can be estimated by subtracting the F1hybrid ratio (cis) from the parent ratio (cisplus
trans).
Maize and teosinte gene expression as measured by the read depth counts at genes was used for statistical testing ofcisandtrans effects. Significant cis and trans effects were determined using binomial and Fisher’s exact tests as described in McManuset al. [11]. In brief, two binomial tests were used to identify genes with maize:teosinte expression ratios significantly different from 1:1 in the F1hybrid and parent comparisons. Genes with an expression
ratio significantly different from 1:1 for the F1 hybrid and/or
parent comparison were then subjected to a Fisher’s exact test to determine if the parent and F1 hybrid maize:teosinte expression
ratios were different from one another. An FDR rate of 0.5% using Storey’s q-value [51] was used to compensate for the large number of statistical tests being performed. We investigated a higher FDR cutoff of 5% to include additional genes in downstream analyses, but only observed a minor increase in the number of candidate genes (Text S1, Table S21). The combination of the two binomial tests and Fisher’s exact test allowed us to classify each gene into one of seven different regulatory categories (Table 3) as described in McManuset al.[11].
Candidate genes
Genes under selection for expression during maize domestica-tion are expected to show a maize:teosintecisexpression ratio that is significantly different from 1:1. These genes can fall into thecis only (C) orcis plus trans (CT) groups on Table 3. We call this combined group CCT genes and these differential expression candidates are the focus of many of our analyses.
The list of CCT genes from the overall test was large (5,618 ear; 5,398 leaf; 5,435 stem) and reflects the considerable statistical power to detect slight overall expression biases for genes with thousands of reads aligning to segregating sites. We observed significant maize:teosinte expression biases as small as 1.02-fold in the overall tests. Such small differences seem unlikely to have biological importance and genes showing these small differences are weak candidates for genes withcisexpression variation that is causal in maize domestication and improvement. Therefore, we applied filters to identify candidates with the strongest and most consistent regulatory differences.
To narrow down the CCT gene list to candidate genes that show the strongest evidence for differentialcisregulation between maize and teosinte, we applied two filters. (1) Genes with the strongest evidence forcis differences will fall in the CCT group and have data from a majority of sampled maize and teosinte parents. Thus, we filtered the initial list of CCT genes for those with data from at least fifteen F1hybrids that include at least three
different maize inbreds and five different teosinte inbreds. (2) For genes withcisdifferences that contributed to maize domestication/ improvement, the direction of the expression bias should be highly consistent among the individual F1hybrids. Consequently, CCT
genes were classified for consistency of directionality of expression bias among the F1s with several levels of candidate genes
partitioned at 100%, 90% and 80% of F1s showing the same
directionality. In calculating these percentages, we used read depth for each F1at the gene to weight the contribution of the F1s to the
overall percentage. We refer to the CCT genes with 100%, 90% and 80% consistent directionality among the F1s as the A-list,
B-list and C-B-list, respectively. For comparative purposes, we made similar A, B and C lists of genes for thecis only ortrans only classes. These CCT andcisonly gene lists (A, AB, and ABC) were used in downstream analyses in comparison with conserved or transonly genes to explore the role ofcisregulatory variation in maize domestication.
Proportion ofcisvariation in maize and teosinte
CRE diversity within maize and teosinte is expected to display as variation in the F1hybrid expression ratios. We asked whether
cisexpression variation among F1hybrid ratios was more heavily
influenced by maize or teosinte inbred parent. Since three teosinte inbreds (TIL05, TIL10, and TIL15) were involved in only a single F1 each, the three F1s involving these inbreds were removed in
for this analysis. Genes were tested for variation among the F1
expression ratios (cisvariation) using a linear model on a gene-by-gene basis that fitted the log2(maize:teosinte) F1expression ratio to
the maize and teosinte parents as independent variables. Significant maize and teosinte parent terms were identified with an F-test (p,0.05) using the Rdrop1function. The data for each F1was weighted by total depth at the gene to account for variable
read depth in the F1hybrids.
Additive and dominant gene expression
Our gene expression dataset consisting of parent inbred and hybrid expression ratios gives the opportunity to address dominant and additive gene expression on a genome-wide scale. We calculated the additive effect, dominant effect, and dominant/ additive (D/A) ratio for each gene and maize-teosinte F1hybrid
comparison. The overall maize-teosinte average D/A ratio was then calculated after exclusion of outlier D/A ratios (Figure S6) by iteratively applying the Dixon method [52]. Genes were classified as additive if |D/A|,0.25 and as having dominant gene action if 0.75,|D/A|,1.25. Following calculation of D/A ratios, we examined ratios for cis only and trans only genes for altered degrees of dominance.
CCT gene enrichment in various functional categories
We assessed whether genes in different expression classes (CCT, cisonly and transonly) are over or under represented in several functional categories as compared to all genes or genes with conserved expression levels between maize and teosinte. Gener-ally, we tested all CCT gene lists (A, AB, and ABC) with the most weight given to the CCT-AB gene lists, which we consider our best candidates genes. The categories we tested include transcription factors, several metabolic pathways, gene ontology (GO) catego-ries, selection candidates, and domestication QTL. A list of maize transcription factors and their associated families was obtained from the plant transcription factor database [30]. Metabolic enzyme cDNA sequences for starch and lipid metabolism pathways in maize were downloaded from the Kyoto Encyclope-dia of Genes and Genomes (KEGG) [53,54] and matched with genes from the maize filtered gene set (version 5b) by BLAST. Matches (single gene hit with percent identity greater than 95%) were found for 370 out of 379 genes and used to test for enrichment of genes in the various metabolic pathways. Genes under positive selection during maize domestication and improve-ment were taken from a recent genomic scan for selection [26]. We obtained a list of QTL associated with maize domestication and improvement traits from Table A.1 of a recent QTL analysis [31].
In general, enrichment or depletion of genes in expression classes among various functional categories was tested with Fisher’s exact tests on 262 contingency tables. For QTL,
enrichment of CCT genes among the genes within QTL 1.5 LOD support intervals were tested separately for each trait and only included QTL whose 1.5 LOD support intervals included 20 or fewer genes. For genes under positive selection during domestication and improvement [26], we also tested for a significant difference in the cross population composite likelihood ratio (XPCLR) at the transcription start site between CCT genes (A, AB, and ABC) versus genes with conserved expression using the Kolmogorov-Smirnov and simple t-tests. Finally, GO term enrichment and depletion was tested using the goseq package [55] in R [56] using median gene length to adjust the GO term reference. The base background GO term reference consisted of genes assessed in 15 crosses, three unique maize, and five unique teosinte inbred lines with a cumulative depth of 100 at segregating
sites in F1and parent comparisons. GO terms occurring at least
five times in the background reference were tested with p-values corrected for multiple testing using the Benjamini-Hochberg method [57].
Supporting Information
Figure S1 Log2 of parent versus hybrid leaf and stem tissue
allele-specific expression ratios. The parent (x-axis) versus F1
hybrid (y-axis) allele-specific expression ratios are plotted against each other. Regulatory category in terms of the combination of significant statistical tests determined using the method described in methods is shown designated by color. Proportion and count of genes falling into the various regulatory categories are also shown in the lower right hand corner barplot. (A) The leaf tissue analysis included 15,931 genes and displayed a similar pattern to that seen in the ear tissue in Figure 2. (B) The stem tissue analysis of 16,018 genes also showed a similar overall pattern to that seen in leaf and ear.
(TIF)
Figure S2 Cisversus estimatedtransregulatory effect for CCT-ABC genes in the leaf and stem. CCT genes have a directional bias with more genes overall favoring the maize allele than teosinte. Genes with consistentcis regulatory differences tend to favor the domesticated maize allele. The (A) leaf tissue and (B) stem tissue display similar bias to that seen in the ear tissue in Figure 4.
(TIF)
Figure S3 Ratio of the average maize to teosinte R2 values grouped by regulatory category. In all three tissues, the proportion of maize to teosinte R2varies between 80% and 90%, consistent with the average loss of nucleotide diversity seen during maize domestication. This suggests no single regulatory category captures more genes under selection than others.
(TIF)
Figure S4 Tissue specific density plots of the ln(XPCLR) score for conserved versus CCT candidate genes. CCT (A, AB, and ABC) gene lists have a significantly higher XPCLR score in the 10 kb window holding the transcriptional start site than conserved (Con) genes. The natural log transformed XPCLR scores for CCT genes are progressively statistically higher than genes identified as conserved in the initial analysis. The distributions of conserved and CCT genes are significantly different by both the shape sensitive Kolmogorov-Smirnov test (upper right of heatmap) and simple difference of the means t-test (lower right of heatmap). Heatmap scale is in log10(p-value).
(TIF)
Figure S5 Density plots of the average difference (by gene) incis effect caused by dropping read depth from a single F1. The
average difference incis effect for each assessed gene caused by dropping read depth from each F1 one by one was calculated.
Density plots show a strong peak at zero with minimal variance, suggesting individual F1 read depths have minor effect on the
overall expression ratio. (TIF)
Figure S6 Histogram of the number of outlier D/A ratios removed by the Dixon method. Cross specific D/A ratios were calculated for all genes and outlier D/A ratios were excluded by iteratively applying the Dixon method. The majority of cases removed two or fewer outliers.
Table S1 Proportion of divergence due to cisregulatory effect grouped by overall parental divergence calculated as described in McManuset al.[11].
(DOCX)
Table S2 The number of genes for which the maize or teosinte allele is expressed at a higher level.
(DOCX)
Table S3 Bias for the maize allele grouped by inbred line for the three tissues in the CCT-ABC gene list.
(DOCX)
Table S4 Proportion of the variation among the maize:teosinte expression ratios for the F1hybrids that is explained by maize and
teosinte parents. (DOCX)
Table S5 Number of genes for which the maize and/or teosinte parent contributed to the variance among the F1 hybrid gene expression ratios (heterogeneous) and genes for which there was no variance in expression attributable to the maize or teosinte parent (homogeneous). CCT genes in groups A, B, and C in the three tissue types are shown.
(DOCX)
Table S6 Comparison of observed and expected numbers of genes classified as differentially expressed (DE) or not differentially expressed (NDE) by RNAseq [this study] and microarray assays [24] in groups A, B, and C in the three tissue types.
(DOCX)
Table S7 RNAseq-based regulatory categories for genes iden-tified as differentially expressed in the microarray study [24]. (DOCX)
Table S8 Fisher’s exact tests for the overlap between genes associated with regions that are differentially methylated in maize and teosinte (DMRs) [27] and CCT-ABC genes from each of the three experimental tissues in our work.
(DOCX)
Table S9 Number of candidate genes neighboring regions that are differentially methylated (DMRs) between maize and teosinte [27] and proportion in which the RNAseq expression data agrees with methylated status.
(DOCX)
Table S10 Additive and dominant gene counts for the A, AB, and ABC cis and trans only candidate lists. Dominance cells contain the number of genes for which the maize:teosinte allele was dominant. Fisher’s exact tests (FET) interrogate whether the degree of dominance/additivity differs between thecisandtrans classes. A binomial test (*) indicates significantly different maize:teosinte count (p,0.005).
(DOCX)
Table S11 Degree of overlap between our CCT (AB list) genes and genes in different transcription factor families.
(DOCX)
Table S12 Degree of overlap between CCT (AB list) differen-tially expressed genes and genes in the 1.5 support intervals for QTL from a previous study.
(DOCX)
Table S13 Degree overlap between our CCT and trans only differentially expressed genes and genes in metabolic pathways defined in KEGG.
(DOCX)
Table S14 Significantly enriched and depleted GO terms from CCT andtransonly gene lists including tissue, group, accession, description, counts, rate of occurrence, and FDR corrected p-values.
(DOCX)
Table S15 Numbers of biological replicates of F1 hybrid and
parent inbred lines for RNAseq expression study with hybrid replicates internal and parent around the perimeter (shaded gray). (DOCX)
Table S16 Adapter name, barcode sequence, and barcode length for Illumina adapters used in RNAseq libraries.
(DOCX)
Table S17 Number of genomic paired end reads and coverage obtained for constructing pseudo-transcriptomes.
(DOCX)
Table S18 F1and parent maize:teosinte read depth ratios for the
29 maize-teosinte comparisons. (DOCX)
Table S19 Spearman correlation between all biological replicate pairs of the same genotype.
(DOCX)
Table S20 Comparison of RNAseq expression data with expectations identified in the literature.
(DOCX)
Table S21 Increase in size and percent of CCT A, B, and C gene lists when using 5% Storey’s FDR for significant binomial and Fisher’s exact tests.
(DOCX)
Text S1 Supplemental methods and results. (DOCX)
Acknowledgments
The authors would like to thank Xu Wang for helpful discussion on RNAseq read processing, Lisa Kursel for collecting tissue and extracting RNA, Bill Engels and Brian Yandell for statistical advice, and Bret Payseur for advice on selection tests.
Author Contributions
Conceived and designed the experiments: ZHL JFD. Performed the experiments: ZHL. Analyzed the data: ZHL RB QS. Wrote the paper: ZHL JFD RB.
References
1. Carroll SB (2005) Evolution at two levels: on genes and form. PLoS Biol 3: e245. doi:10.1371/journal.pbio.0030245.
2. Carroll SB (2008) Evo-devo and an expanding evolutionary synthesis: a genetic theory of morphological evolution. Cell 134: 25–36. doi:10.1016/ j.cell.2008.06.030.
3. Wittkopp PJ, Kalay G (2012) Cis-regulatory elements: molecular mechanisms and evolutionary processes underlying divergence. Nat Rev Genet 13: 59–69. doi:10.1038/nrg3095.
4. Stern DL, Orgogozo V (2008) The loci of evolution: how predictable is genetic evolution? Evolution (N Y) 62: 2155–2177. doi:10.1111/j.1558-5646.2008.00450.x.
5. Springer NM, Stupar RM (2007) Allele-specific expression patterns reveal biases and embryo-specific parent-of-origin effects in hybrid maize. Plant Cell 19: 2391–2402. doi:10.1105/tpc.107.052258.
![Table 6. Fisher’s exact tests for the overlap between differentially expressed genes from the microarray study [24] and CCT genes from each of the three experimental tissues in our work.](https://thumb-eu.123doks.com/thumbv2/123dok_br/18194070.332665/8.918.98.835.136.536/table-fisher-overlap-differentially-expressed-microarray-experimental-tissues.webp)
