Ethylene response factors gene regulation and
expression profiles under different stresses in rice
Camila Pegoraro
1, Daniel da Rosa Farias
1, Liliane Marcia Mertz
2,
Railson Schreinert dos Santos
1, Luciano Carlos da Maia
1,
Cesar Valmor Rombaldi
2, Antonio Costa de Oliveira
1*1Plant Genomics and Breeding Center, Eliseu Maciel School of Agronomy, Federal University of Pelotas, Pelotas, RS, Brazil. 2Department of Agro-industry Science and Technology, Eliseu Maciel School of Agronomy, Federal University of Pelotas,
Pelotas, RS, Brazil.
*Corresponding author: acostol@cgfufpel.org
Received: 24 August 2013; Accepted: 11 December 2013
ABSTRACT: Stresses can cause large yield reductions in cultivated plants. The response to these stresses occurs via a plethora of signalling pathways, where a large number of genes is induced or repressed. Among the environmental stress responsive genes, there are the members of the ethylene response factors (ERF) gene family. The mRNA levels of different ERFare regulated by many hormones and molecules produced under different stress conditions. In this study, with the goal of identifying the response of rice ERFgenes to environmental
stress, it was analysed the transcriptional expression profile of 114 of these genes under stress by anoxia, salt and Magnaporthe grisea. Also, aiming to characterize how the regulation of ERF genes occurs, the amount of known cis regulatory elements in the promoter region
of these genes and their association with the expression profiles under the tested conditions were also assessed. The results indicate that some ERF members present the same specific expression profiles under different environmental stresses, while others do not. Within the
ERF family, the regulation of gene expression is complex for some genes which have many cis elements in their promoters, but simple for
others, demonstrating high levels of divergence among them. The findings demonstrate the importance of the study of each ERF separately,
since it is not possible to establish general rules for regulation and probably for the function of these genes.
KeywoRDS:Oryza sativa, transcription, cis elements, environmental stresses.
INTRoDUCTIoN
Many biotic and abiotic agents can stress cultivated plants, negatively affecting their yield. However, during evolution, plants developped mechanisms capable of perceiving environmental changes regulating the induction or repression of many genes. The majority of these genes take part in metabolic response pathways, enabling the adaptation to adverse environmental conditions (Yamaguchi-Shinozaki and Shinozaki 2006).
A complex regulatory network is involved in the induction of stress responsive genes (Yamaguchi-Shinozaki and Shinozaki 2006), and a large number of these genes was identified using differential expression analysis in many different species. In the majority of cases, these processes are coordinated by phytohormones, such as ethylene and abscisic acid (Fujimoto et al. 2000).
One of the most important gene families that are related to environmental responses and tolerance is the ethylene response factors (ERF) gene family. Despite its name, these genes are not only regulated by ethylene, but also by other molecules such as abscisic, salicylic, jasmonic, giberellic acids and their
interactions (Sakuma et al. 2002, Grennan 2008). ERFgenes
are defined by the domain AP2/ERF, which consists of aproximately 60 aminoacids involved in DNA binding. The cis
element GCC-Box (AGCCGCC) is recognized by the majority
Transcription factors belonging to the ERF family have been reported to be involved in many developmental processes (Elliott et al. 1996, Boutilier et al. 2002, Vahala et al. 2013), biotic (Yamamoto et al. 1999) and abiotic (Stockinger et al. 1997, Liu et al. 1999, Xu et al. 2006, Cheng et al. 2013) stress
responses (Li et al. 2013). Recently, 122 and 139 ERFgenes
were identified in arabidopsis and rice, respectively, revealing a strong tendency for redundancy and conservation in this family (Nakano et al. 2006). This tendency for redundancy is still being questioned by studies in which the transcriptional expression of these genes is assessed (Santos et al. 2013).
The ERF family presents well characterized members, with biological and economical importance, such as Dehydration-Responsive Element-Binding proteins (DREBs) (Yamaguchi-Shinozaki and Shinozaki 1994), related to cold, drought and salinity stress. The constitutive expression of
DREB1a and DREB1b in Arabidopsis plants induced the
expression of cold-regulated (COR) genes and increased the freezing tolerance (Gilmour et al. 2000, 2004). Similar results were observed for the constitutive action of the protein
DREB2, under conditions of dehydration and high salinity
stress (Liu et al. 1998, Sakuma et al. 2006).
Strong physiological effects are detected not only for DREB genes, but also for other ERF. For example, the superexpression
of different ERF genes results in the increased tolerance to
hypoxia/anoxia stresses (Xu et al. 2006, Licausi et al. 2010) and drought (Dubouzet et al. 2003). In some rice varieties, the
SUB1A-1 allele induces the negative regulation of ethylene,
making plants able to survive complete submergence for prolonged periods (Xu et al. 2006). Besides providing anoxia tolerance, this allele also provides drought and desubmergence (recovering the period after anoxia stress) tolerance. This ability is due to a reduction in water loss by leaves, decrease in lipid peroxidation, gene induction associated with acclimation to dehydration and reduction of reactive oxygen species (ROS) in leaf tissues during drought and desubmergence (Fukao et al. 2011). Similarly, Arabidopsis plants overexpressing the gene
HRE1 (gene belonging to the same group as SUB1A) showed
increase in anoxia tolerance (Licausi et al. 2010). Although the function of some ERF genes is known, for many of them not even the transcriptional expression is well characterized.
Gene expression is widely controlled in the transcription phase, where the interactions between transcription factors and cis regulatory elements in the promoter region of a given gene perform a crucial role (Brivanlouand Darnell 2002). Therefore, the presence of these elements can determine much of plant stress response, since they act as regulators. The identification of cis elements in the promoter region of ERF genes can auxiliate in the understanding of transcription regulation of
these genes under different stress conditions. In this sense, this work aimed to identify cis elements in the promoter regions of ERF genes in rice and to associate the presence of some of these elements to a given expression profile.
MATeRIAL AND MeTHoDS
In Silico expression Profiles of ethylene Response Factors Genes: ERF members in rice (Oryza sativa L.) were identifyied through a previously reported list (Nakano et al.
2006). The in silico expression profile of the ERF genes was
obtained from public microarray databses using Genevestigator
(http://www.genevestigator.ethz.ch) (Zimmermann et al. 2008). The evaluated abiotic stresses were: (1) anoxia – Nipponbare plantlet coleoptiles germinated at 28°C, in
the dark, with less than 10 µg mL-1 of O
2 compared with
Nipponbare coleoptiles germinated at 28°C, in the dark (Lasanthi-Kudahettige et al. 2007); and (2) salt – IR29 and
FL478 plantlet bases subjected to NaCl and CaCl2 (5:1) for
3 days compared with untreated 30-day-old plants (Walia et al. 2005). Also, the accumulation of ERF gene transcripts under
stress caused by rice blast fungus (Magnaporthe grisea) was
evaluated in Nipponbare at 3 and 4 days after the infection (3 and 4 dpi) (Ribot et al. 2008).
In this study, genes with log2 expression above 0.5 and bellow -0.5 were considered as induced and repressed, respectively. The specificity and overlapping of expression were identified through the use of Venn diagrams (Oliveros 2007).
Identification of Cis elements in the Promoter Region of ethylene Response Factors Genes: The sequence corresponding to the promoter region (-1,000 bp before 5’UTR) of each member of the ERF family was obtained from RAP-DB – The Rice Annotation Project Database (http://rapdb.dna.affrc.go.jp/) and was analysed for identification of cis elements.
The identification of cis elements was performed using PLANTCIS software (Maia et al., unpublished data, actually available at http://microsatellite.org/cis_input.html), which
searches known cis elements from PLACE - Plant Cis-acting
ERF promoters, genes were considered as of complex (number of different cis elements above the overall average plus one SD), simple (number of different cis elements bellow the overall average minus one SD) and normal (within the limits established) regulation. Cis elements with higher occurrence among these genes were also reported.
Association Between Gene expression and Presence of a Given Cis element: Aiming to verify the association between the presence of a given cis element and a given expression profile, the significant elements were compared with the expression profile obtained for each stress condition. For this comparison, the genes were clustered by their expression profiles using Tocher’s method through the generation of a matrix based on Euclydian distances. This analysis was performed using the software GENES (http:// www.ufv.br/dbg/genes/gdown1.htm). Later, the presence of common cis elements in the promoter region of genes belonging to the same group was scored.
Analysis of ethylene Response Factors Gene expression by Quantitative Polymerase Chain Reaction: For quantitative polymerase chain reaction (qPCR) analysis, three experiments were conducted. Nipponbare rice seedlings (15 day-old) were subjected to different stresses: (1) anoxia for 0, 24, 48 and 72 h; (2) salt
(150 mM NaCl) for 0, 8, 16 and 24 h; and (3) M. grisea
(1.6x10⁵ spores mL-1) for 0, 3 and 4 dpi.
Tissues from rice seedlings (0.1 g) were collected from the
experiments with M. grisea (leaves), salt and anoxia (roots).
Total RNA was extracted using Trizol® Reagent (InvitrogenTM,
Carlsbad, CA, USA), according to the protocol described by the manufacturer. To avoid DNA contamination, samples were
treated with DNAse I (EC number 3.1.21.1 - InvitrogenTM,
Carlsbad, CA, USA). The amount and quality of the total RNA were evaluated through spectofotometer and agarose gel electrophoresis. Each sample was reverse transcribed to
produce cDNAs using the kit SuperScript
®
III First-StrandSystem forRT-PCR (InvitrogenTM, Carlsbad, CA, USA), and
the quality of cDNA was confirmed by PCR using primers for the Actin gene.
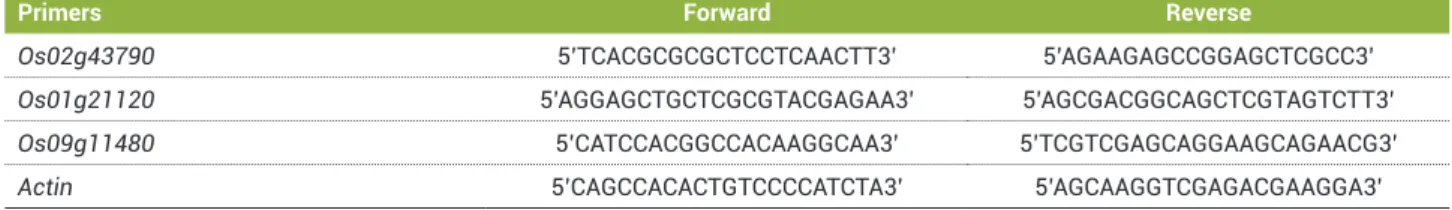
Three ERFgenes were randomly selected for the evaluation
in qPCR. The primers corresponding to the studied genes (Table 1) were designed from sequences deposited in RAP-DB
using the software Vector NTI® Advance 11 (InvitrogenTM,
Carlsbad, CA, USA). The criteria used for the selection of primers consisted in amplicon size between 50 and 150 bp, GC content between 40 and 60%, and annealing temperature between 60 and 65°C, according to the manufacturer’s recommendations
(Applied Biosystems®, Carlsbad, CA, USA).
Only primers presenting a dissociation curve with a single peak and amplification efficiency close to 100% were used in this study. Quantitative PCR analysis was performed in a
7500 Real-Time PCR System (Applied Biosystems®, Carlsbad,
CA, USA) using SYBR® Green RT-PCR Reagents Kit
(InvitrogenTM, Carlsbad, CA, USA). The amplification reaction
was performed in a total volume of 20 μL. The amplification
conditions were: denaturation at 95°C for 10 min, followed by 40 cycles of the routine (95°C for 30 s, 60°C for 1 min and 72°C for 1 min), then by a final extension at 72°C for 5 min. The relative expression of each gene was obtained according to the previously described method (Pfaffl 2001). For each analysed gene, a normalizing procedure was used having the
Actin gene and the zero time as controls.
ReSULTS
Identification of ethylene Response Factors Genes:
The ERFgenes analysed in this work were initially described
by Nakano et al. (2006), who identified 139 genes in rice from TIGR (MSU Rice Genome Annotation Project Team) database. From the 139 identified genes, 114 presented expression profile in Genevestigator (Figure 1, Table 2). Genes were divided into two groups (54 and 60 genes each) to facilitate the presentation of the results.
expression Profile of ethylene Response Factors Genes under Stress Conditions: The expression profiles of rice ERF genes (Figure 1) indicated that a portion of these genes
respond to M. grisea stress three days after infection (3 dpi).
In this condition, 28 genes were induced, 2 genes were repressed, and no change was detected for the other 84 genes (Table 3).
Table 1. Primers used for quantitative polymerase chain reaction analyses
Primers Forward Reverse
Os02g43790 5’TCACGCGCGCTCCTCAACTT3’ 5’AGAAGAGCCGGAGCTCGCC3’
Os01g21120 5’AGGAGCTGCTCGCGTACGAGAA3’ 5’AGCGACGGCAGCTCGTAGTCTT3’
Os09g11480 5’CATCCACGGCCACAAGGCAA3’ 5’TCGTCGAGCAGGAAGCAGAACG3’
Regarding the second infection time (4 dpi), 42 genes were induced and 6 were repressed while the other 66 genes did not change its expression levels. Anoxia stress caused the induction of 22 genes and the repression of 31 genes while in the remaining genes no changes were observed. Salt stress showed the smallest eff ect on the regulation of the analysed genes. No induced gene was detected, only eight were repressed.
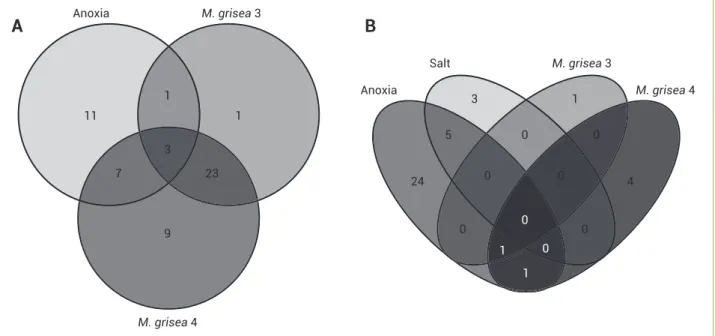
Venn diagrams (Figure 2) demonstrate overlapping regulation of ERF genes responsive to the studied stresses.
Comparing genes induced by M. grisea at diff erent infection
times, an overlap in expression of 26 genes was found (Table 4). Th is result was expected, since the stress is the same, only altering
the exposition time. Anoxia, M. grisea 3 dpi and M. grisea 4 dpi
caused common induction of three genes, which are related with patogenicity, revealing an overlapping expression between biotic
and abiotic stresses. Th e anoxia and M. grisea 3 dpi caused the
induction of four common genes while anoxia and M. grisea
4 dpi caused the common induction of ten genes (Figure 2A). Unique expression profi les were also observed in each stress (Table 5). A high number of uniquely induced genes was found
under anoxia (11). Genes induced only by M. grisea at 3 dpi (1)
and genes induced only by M. grisea at 4 dpi (9) were also found.
For the repressed genes, it was observed that under salt and anoxia stresses, there was a common repression for fi ve genes
(Table 4). When the anoxia and M. grisea 3 dpi stresses were
applied, the repression of one common gene was observed and
when the stresses by anoxia and M. grisea 4 dpi were compared,
two genes were commonly repressed. When the stresses by
anoxia, M. grisea 3 dpi and M. grisea 4 dpi were compared, one
gene was commonly regulated (Figure 2B). Only one gene was
commonly repressed under the stresses of M. grisea 3 dpi and
M. grisea 4 dpi. It is proposed that genes commonly repressed
under diff erent stresses conditions are more likely to play a general role in adaptation to stresses.
A specifi c repression profi le is observed for ERF,according to
the studied stress. Th e major group of uniquely repressed genes (24)
was found under anoxia conditions. On the other hand, just three
genes were repressed only under salt stress. For M. grisea infection,
one gene was uniquely repressed at 3 dpi and four at4 dpi.
From the expression data, the ERFgenes were clustered
according to their similarity in response to each stress
condition. Under anoxia, salt and M. grisea, the genes were
divided into eigth, three and six groups, respectively (Table 6).
Identifi cation of Cis elements in Promoter Regions of ethylene Response Factors Genes: From 139 ERF genes predicted by Nakano et al. (2006), 115 were used for obtaining promoters and identifying cis elements. Th e remaining genes (24) presented annotation problems or
were not identifi ed in RA P-DB (Table 2).
In the 115 analysed promoters, a total of 250 diff erent
signifi cant cis elements (p≤5%) were found, with an
occurrence of at least one per gene. An average of 14 and a SD of 5 diff erent cis elements were found. In order to establish
Figure 1. Expression profi le of the ethylene response factors gene family members in rice seedlings subjected to different stresses. The expression profi le is presented as a heat map, generated by Genevestigator. (A) group 1; (B) group 2.
-2.5 Down-regulated
Anoxia
Log(2)-ratio
-2.0 -1.5 -1.0 -0.5 0.0 0.5 1.0 1.5 2.0 2.5 Up-regulated
M. grisea 3 dpi
M. grisea 4 dpi Salt
L
OC_Os07g10410 LOC_Os05g27930 LOC_Os06g09790 LOC_Os02g43940 LOC_Os02g45450 LOC_Os02g13710 OC_Os04g48350L LOC_Os05g39590 LOC_Os09g35030 LOC_Os08g31580 LOC_Os02g54050 LOC_Os02g45420 LOC_Os06g09810 OC_Os05g25260L LOC_Os01g12440 LOC_Os10g22600 LOC_Os04g55520 LOC_Os04g46440 LOC_Os04g46400 LOC_Os01g46870 LOC_Os06g03670 LOC_Os08g45110 LOC_Os06g40150 LOC_Os06g07030 LOC_Os04g44670 LOC_Os05g28350 LOC_Os10g38000 LOC_Os06g06540 LOC_Os10g41130 LOC_Os01g10370 LOC_Os01g73770 LOC_Os12g39330 LOC_Os09g20350 OC_Os06g10780L LOC_Os03g15660 LOC_Os02g52880 LOC_Os06g11860 LOC_Os09g35010 LOC_Os02g51670 LOC_Os07g38750 OC_Os02g43970L LOC_Os02g42580 LOC_Os06g36000 LOC_Os06g08340 LOC_Os03g09170 LOC_Os03g02650 LOC_Os08g43200 LOC_Os03g07830 LOC_Os08g35240 LOC_Os05g34730 LOC_Os08g43210 LOC_Os04g46410 LOC_Os01g07120 LOC_Os06g11940
L
OC_Os10g41330 LOC_Os02g43820 LOC_Os01g54890 LOC_Os09g28440 LOC_Os04g46240 LOC_Os02g43790 LOC_Os04g32790 OC_Os04g18650L LOC_Os03g05590 LOC_Os03g60120 LOC_Os07g12510 LOC_Os09g26420 LOC_Os06g42910 LOC_Os05g41760 LOC_Os10g25170 LOC_Os07g22770 LOC_Os09g39850 LOC_Os02g38090 LOC_Os05g41780 LOC_Os05g29810 LOC_Os03g08470 LOC_Os08g36920 OC_Os06g47590L LOC_Os04g46220 LOC_Os06g09390 LOC_Os05g49010 LOC_Os04g46250 LOC_Os02g06330 LOC_Os04g32620 LOC_Os09g39810 LOC_Os01g58420 LOC_Os01g04020 LOC_Os06g42990 LOC_Os09g11480 LOC_Os08g07700 LOC_Os02g54160 LOC_Os08g41030 OC_Os03g08490L LOC_Os11g06770 LOC_Os08g44960 LOC_Os08g27220 LOC_Os07g22730 LOC_Os03g08460 LOC_Os07g47790 LOC_Os02g52670 LOC_Os01g21120 LOC_Os03g08500 LOC_Os04g34970 LOC_Os08g42550 LOC_Os12g07030 LOC_Os05g36100 LOC_Os07g42510 OC_Os07g47330L LOC_Os03g64260 LOC_Os05g37640 LOC_Os03g22170 LOC_Os09g11460 LOC_Os12g41060 LOC_Os12g41040 LOC_Os04g52090 -2.5
Down-regulated
Log(2)-ratio
-2.0 -1.5 -1.0 -0.5 0.0 0.5 1.0 1.5 2.0 2.5 Up-regulated
Anoxia
M. grisea 3 dpi
M. grisea 4 dpi Salt
A
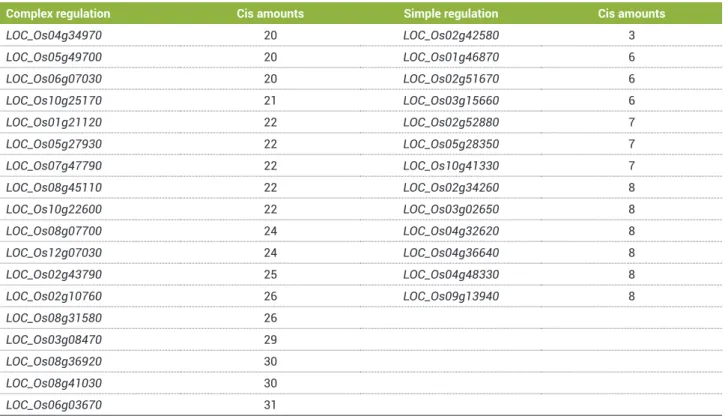
a pattern of regulation, genes with a number of different cis elements higher than 19, bellow 9 and between 9 and 19 were considered of complex, simple and normal regulation, respectively. According to Table 7, 18 and 13 genes were found to be of complex and simple regulation, respectively. It is suggested that for genes of simple regulation, a small interaction of transcription factors is needed, while for the activation of genes with complex regulation, a higher interaction between these factors is probably required.
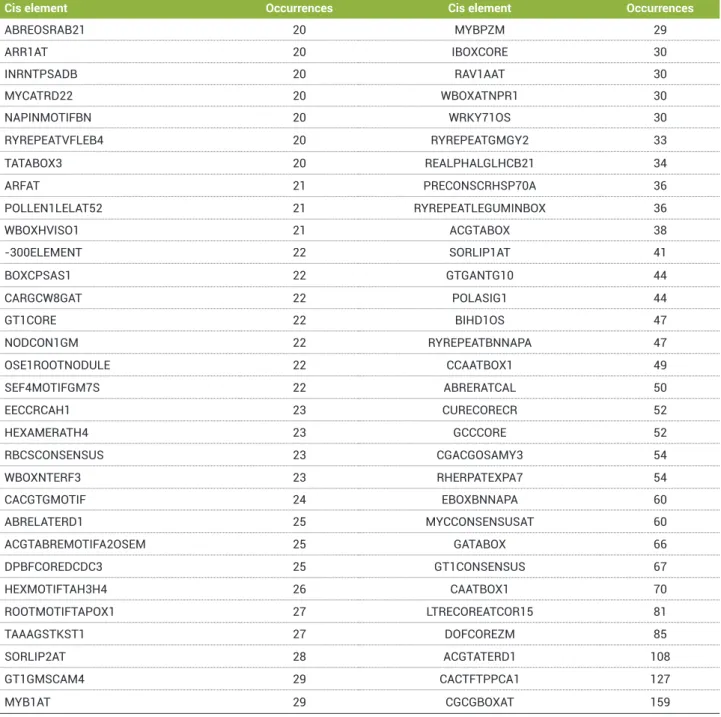
In this work, cis elements with frequencies ranging from 1 to 159 were found in the ERF family. The elements that occurred 20 times or more within the whole ERF family (sum of all occurrences from all analysed genes) are shown in Table 8.
Association of Cis Elements with the Expression Profile of ethylene Response Factors Genes under Different Stress Conditions: No common cis elements were found in the promoter regions when compared: (1) the four
genes commonly induced by anoxia and M. grisea 3 dpi; (2) the
10 genes commonly induced by anoxia and M. grisea 4 dpi;
(3) the 26 genes commonly induced by M. grisea 3 and 4 dpi
(Figure 2A); (4) the one commonly repressed gene under
anoxia and M. grisea 3 dpi; (5) the one commonly repressed
gene under anoxia and M. grisea 4 dpi; (6) the five genes
repressed under salt and anoxia stresses (Figure 2B).
The analysis of clusters formed by expression similarity within each stress (Table 6) indicated that, under anoxia stress,
Table 2. Ethylene response factors genes identified in rice
Genes MSU TIGR
Os04g44670 Os04g48330a Os06g08340 Os05g41780 Os02g43820
Os02g42580 Os03g02650 Os02g10760a Os01g58420 Os10g41330f
Os03g09170 Os10g38000 Os02g55380a Os04g57340a Os04g46240e
Os08g31580 Os09g35030 Os04g56150a Os04g52090 Os02g34260a
Os02g51670 Os02g45450 Os12g39330 Os06g47590 Os01g64790a
Os09g20350c Os06g03670 Os07g10410 Os05g41760 Os04g34970
Os06g11860 Os01g73770 Os07g38750 Os02g06330d Os04g32620
Os10g22600 Os08g43200b Os01g12440 Os02g09650af Os11g06770
Os05g49700a Os08g43210b Os01g46870 Os07g47330 Os12g07030
Os06g07030 Os04g48350 Os06g06540e Os02g38090 Os02g34270ad
Os04g55520 Os09g35010f Os05g25260 Os08g07700 Os09g28440
Os03g15660 Os09g35020a Os07g12510 Os02g32040a Os02g52670
Os06g09690ad Os02g43940 Os03g60120 Os04g32790 Os08g36920
Os02g54050 Os04g46400 Os10g25170 Os03g64260 Os05g36100c
Os08g35240a Os04g46440 Os03g08460 Os05g49010 Os08g42550
Os06g11940e Os02g43970 Os05g29810 Os05g37640c Os02g32140a
Os06g09810d Os10g41130 Os03g08470 Os07g22770 Os01g04020
Os06g09790d Os04g46410 Os09g11480 Os09g39850 Os09g13940a
Os06g09760ad Os06g36000 Os03g08500 Os03g05590 Os08g27220b
Os06g10780d Os02g13710 Os07g42510 Os10g30840ad Os12g41030ad
Os02g52880 Os01g10370 Os03g22170 Os08g44960d Os12g41040d
Os06g09730ad Os01g07120 Os07g47790 Os09g39810 Os12g41060
Os01g66270a Os03g07830 Os01g21120 Os04g18650 Os06g42910
Os05g34730 Os05g27930 Os03g08490 Os07g22730 Os06g42990e
Os11g13840a Os05g39590 Os02g54160 Os02g43790 Os08g41030
Os02g35240 Os08g45110 Os06g09390 Os01g54890 -ad
Os04g36640a Os05g28350 Os09g26420 Os04g46220 -ad
Os02g45420 Os06g40150 Os09g11460 Os04g46250
aDo not present information in Genevestigator; bDifferent genes in MSU TIGR correspond to the same gene in RAP-DB; cDifferent genes in RAP-DB correspond to the
Table 3. Description of the results obtained from the digital expression profile of rice ethylene response factors genes* Induced in
M. grisea
infection (3 dpi)
Repressed in
M. grisea
infection (3 dpi)
Induced in M. grisea
infection (4 dpi)
Repressed in
M. grisea
infection (4 dpi)
Induced in anoxia stress
Repressed in
anoxia stress
Repressed in
salt
LOC_Os02g43790 LOC_Os08g44960 LOC_Os02g43790 LOC_Os03g60120 LOC_Os03g08460 LOC_Os03g08490 LOC_Os02g13710
LOC_Os01g73770 LOC_Os02g06330 LOC_Os03g09170 LOC_Os05g37640 LOC_Os08g43210 LOC_Os08g36920 LOC_Os09g11460
LOC_Os08g36920 LOC_Os09g35010 LOC_Os06g36000 LOC_Os07g47790 LOC_Os01g73770 LOC_Os01g73770
LOC_Os09g35010 LOC_Os09g28440 LOC_Os05g41760 LOC_Os03g22170 LOC_Os03g08470 LOC_Os04g48350
LOC_Os03g09170 LOC_Os08g36920 LOC_Os02g06330 LOC_Os01g21120 LOC_Os09g35030 LOC_Os04g52090
LOC_Os04g52090 LOC_Os04g52090 LOC_Os09g11480 LOC_Os08g42550 LOC_Os06g03670 LOC_Os04g46220
LOC_Os06g03670 LOC_Os06g03670 LOC_Os07g12510 LOC_Os03g08500 LOC_Os08g36920
LOC_Os09g35030 LOC_Os01g73770 LOC_Os04g46250 LOC_Os09g11460 LOC_Os02g43790
LOC_Os02g45450 LOC_Os04g32620 LOC_Os05g29810 LOC_Os04g46400
LOC_Os01g21120 LOC_Os05g34730 LOC_Os04g46240 LOC_Os02g52670
LOC_Os04g46400 LOC_Os01g21120 LOC_Os05g36100 LOC_Os03g64260,
LOC_Os04g44670 LOC_Os12g07030 LOC_Os01g04020 LOC_Os07g22730
LOC_Os09g11480 LOC_Os01g07120 LOC_Os05g37640 LOC_Os02g43970
LOC_Os03g64260 LOC_Os11g06770 LOC_Os01g12440 LOC_Os09g28440
LOC_Os03g08460 LOC_Os05g49010 LOC_Os06g07030 LOC_Os02g45450
LOC_Os10g22600 LOC_Os04g44670 LOC_Os03g15660 LOC_Os06g09390
LOC_Os01g07120 LOC_Os04g46400 LOC_Os02g42580 LOC_Os02g45420
LOC_Os02g13710 LOC_Os06g07030 LOC_Os04g44670 LOC_Os04g46410
LOC_Os05g41780 LOC_Os02g13710 LOC_Os04g46220 LOC_Os09g26420
LOC_Os02g43940 LOC_Os02g43820 LOC_Os03g60120 LOC_Os02g54160
LOC_Os09g26420 LOC_Os01g12440 LOC_Os12g07030 LOC_Os02g54050
LOC_Os03g08490 LOC_Os02g43940 LOC_Os08g43200 LOC_Os02g13710
LOC_Os04g46440 LOC_Os09g11460 LOC_Os09g39850
LOC_Os09g11460 LOC_Os02g45450 LOC_Os10g41130
LOC_Os06g11860 LOC_Os10g22600 LOC_Os05g41760
LOC_Os09g28440 LOC_Os02g54160 LOC_Os06g08340
LOC_Os03g15660 LOC_Os07g47790 LOC_Os02g06330
LOC_Os04g32620 LOC_Os04g46220 LOC_Os03g09170
LOC_Os02g51670 LOC_Os09g35010
LOC_Os09g35030 LOC_Os04g48350
LOC_Os01g54890 LOC_Os09g20350
LOC_Os06g11860
LOC_Os09g26420
LOC_Os08g43210
LOC_Os03g08490
LOC_Os03g64260
LOC_Os01g04020
LOC_Os05g41780
LOC_Os05g27930
LOC_Os04g34970
LOC_Os04g46440
LOC_Os03g08460
Figure 2. Specifi city for induced (A) and repressed (B) genes in rice. 11
Anoxia
23
M. grisea 3
M. grisea 4 1
1 3
7
9
3 Anoxia
0 M. grisea 3
M. grisea 4 1
0 0
0
0 Salt
5
0
0 0 24
1
1
4
A
B
Table 4. Overlapping regulation under different stresses obtained from the digital expression profi le of rice ethylene response factors genes
Overlapping regulation in
M. grisea
at different infection times
Overlapping induction in anoxia, M. grisea
3 dpi and
M. grisea 4 dpi
Overlapping induction in anoxia and
M. grisea 3 dpi
Overlapping induction in anoxia and
M. grisea 4 dpi
Overlapping repression in salt
and anoxia
Overlapping repression in anoxia and
M. grisea 3 dpi
Overlapping repression in anoxia and
M. grisea 4 dpi
Overlapping repression in anoxia,
M. grisea 3 dpi and M. grisea 4 dpi
Overlapping repression in
M. grisea 3 dpi
and M. grisea
4 dpi
LOC_Os04g32620 LOC_Os01g21120 LOC_Os03g15660 LOC_Os12g07030 LOC_Os08g36920 LOC_Os02g06330 LOC_Os02g06330 LOC_Os02g06330 LOC_Os02g06330 LOC_Os09g28440 LOC_Os04g44670 LOC_Os04g44670 LOC_Os06g07030 LOC_Os01g73770 LOC_Os05g41760
LOC_Os06g11860 LOC_Os03g08460 LOC_Os01g21120 LOC_Os01g12440 LOC_Os09g11460 LOC_Os09g11460 LOC_Os03g08460 LOC_Os07g47790 LOC_Os02g13710 LOC_Os04g46440 LOC_Os04g46220 LOC_Os04g48350 LOC_Os03g08490 LOC_Os08g43210
LOC_Os09g26420 LOC_Os01g04020 LOC_Os02g43940 LOC_Os01g21120 LOC_Os05g41780 LOC_Os04g44670 LOC_Os02g13710 LOC_Os03g08460 LOC_Os01g07120
Table 5. Uniquely regulated under a certain stress. Data obtained from the digital expression profile of rice ethylene response factors genes
Induced under anoxia
Induced under M. grisea at 3 dpi
Induced under M. grisea at 4 dpi
Repressed
under anoxia
Repressed
under salt
Repressed under
M. grisea at 3 dpi
Repressed under
M. grisea at 4 dpi
LOC_Os08g43200 LOC_Os09g11480 LOC_Os04g34970 LOC_Os03g08490 LOC_Os02g43790 LOC_Os08g44960 LOC_Os09g11480
LOC_Os03g60120 LOC_Os05g27930 LOC_Os03g08470 LOC_Os04g46220 LOC_Os06g36000
LOC_Os02g42580 LOC_Os01g54890 LOC_Os09g35030 LOC_Os04g52090 LOC_Os05g37640
LOC_Os05g37640 LOC_Os02g51670 LOC_Os06g03670 LOC_Os03g60120
LOC_Os05g36100 LOC_Os02g54160 LOC_Os03g08500
LOC_Os04g46240 LOC_Os02g43820 LOC_Os04g46400
LOC_Os05g29810 LOC_Os05g49010 LOC_Os02g52670
LOC_Os04g46250 LOC_Os11g06770 LOC_Os03g64260
LOC_Os07g12510 LOC_Os05g34730 LOC_Os07g22730
LOC_Os08g42550 LOC_Os02g43970
LOC_Os03g22170 LOC_Os09g28440
LOC_Os02g45450
LOC_Os06g09390
LOC_Os02g45420
LOC_Os04g46410
LOC_Os09g26420
LOC_Os02g54160
LOC_Os02g54050
LOC_Os09g39850
LOC_Os10g41130
LOC_Os06g08340
LOC_Os03g09170
LOC_Os09g35010
LOC_Os09g20350
the promoters of genes belonging to group three showed four cis elements in common (Table 9):
REALPHALGLHCB21:AACCAA; HEXMOTIFTAH3H4:ACGTCA; TATAPVTRNALEU:TTTATATA ACGTABOX:TACGTA.
These elements also appear in other promoters, but not in the same combination, suggesting that the regulation observed
for genes LOC_Os03g08470 and LOC_Os09g35030 under
anoxia may be performed by these four elements together. Also under anoxia, promoters of genes belonging to group five presented one common cis element, CACGTGMOTIF:CACGTG. This might be an indication
that the expression profile of LOC_Os08g36920 and LOC_
Os01g73770 observed under this condition is dependent on
the combination of other elements present in these promoters.
Under salt stress, three clusters of ERF genes were formed, but no cis elements common to genes within groups were found (Table 9).
Under M. Grisea stress, it was detected two common
cis elements (TATAPVTRNALEU:TTTATATA and RBCSCONSENSUS:AATCCAA) among the genes belonging to group 2 (Table 9). These results suggest that the interaction between transcription factors and these two elements
contributes for the regulation observed in LOC_Os02g45450
and LOC_Os09g35030 under these conditions.
ethylene Response Factors Gene expression in Rice Detected by Quantitative Polymerase Chain Reaction: In this work, the quantitative expression of
three out of 139 ERF genes was evaluated under three
stresses (salt, anoxia and M. grisea) (Figure 3). The gene
LOC_Os09g11480 (EREBP 5) exibited an increase in
Table 6. Gene clusters formed according to the expression profiles of ethylene response factors under several stress conditions
Stress Group Genes
Anoxia
1
LOC_Os06g09390, LOC_Os02g45420, LOC_Os02g45450, LOC_Os09g28440, LOC_Os04g46410, LOC_ Os02g43970, LOC_Os07g22730, LOC_Os09g26420, LOC_Os02g54160, LOC_Os03g64260, LOC_Os02g52670,
LOC_Os04g46400, LOC_Os09g11460, LOC_Os03g08500, LOC_Os06g03670
2 LOC_Os04g46240, LOC_Os05g36100, LOC_Os01g04020, LOC_Os05g29810, LOC_Os04g46250, LOC_
Os05g37640, LOC_Os07g12510, LOC_Os08g42550
3 LOC_Os03g08470, LOC_Os09g35030
4 LOC_Os01g21120, LOC_Os03g22170, LOC_Os07g47790, LOC_Os08g43210
5 LOC_Os08g36920, LOC_Os01g73770
6 LOC_Os03g08490
7 LOC_Os03g08460
8 Remaining genes
Salt
1 LOC_Os02g13710, LOC_Os09g11460, LOC_Os01g73770, LOC_Os04g48350, LOC_Os04g52090, LOC_
Os04g46220
2 LOC_Os02g43790, LOC_Os08g36920
3 Remaining genes
M. grisea
1 LOC_Os04g46400, LOC_Os04g44670, LOC_Os01g21120, LOC_Os01g07120, LOC_Os02g13710, LOC_
Os05g49010, LOC_Os12g07030, LOC_Os04g32620, LOC_Os09g28440, LOC_Os11g06770, LOC_Os05g34730
2 LOC_Os02g45450, LOC_Os09g35030
3 LOC_Os06g03670, LOC_Os04g52090, LOC_Os09g35010, LOC_Os03g09170, LOC_Os08g36920, LOC_
Os01g73770
4 LOC_Os02g43790
5 LOC_Os09g11480
6 Remaining genes
Table 7. Number of different cis elements in promoter regions of genes considered with complex and simple regulation
Complex regulation Cis amounts Simple regulation Cis amounts
LOC_Os04g34970 20 LOC_Os02g42580 3
LOC_Os05g49700 20 LOC_Os01g46870 6
LOC_Os06g07030 20 LOC_Os02g51670 6
LOC_Os10g25170 21 LOC_Os03g15660 6
LOC_Os01g21120 22 LOC_Os02g52880 7
LOC_Os05g27930 22 LOC_Os05g28350 7
LOC_Os07g47790 22 LOC_Os10g41330 7
LOC_Os08g45110 22 LOC_Os02g34260 8
LOC_Os10g22600 22 LOC_Os03g02650 8
LOC_Os08g07700 24 LOC_Os04g32620 8
LOC_Os12g07030 24 LOC_Os04g36640 8
LOC_Os02g43790 25 LOC_Os04g48330 8
LOC_Os02g10760 26 LOC_Os09g13940 8
LOC_Os08g31580 26
LOC_Os03g08470 29
LOC_Os08g36920 30
LOC_Os08g41030 30
Table 8. Sum of occurrences of each cis element in all analysed genes (only genes with 20 or more occurrences are shown)
Cis element Occurrences Cis element Occurrences
ABREOSRAB21 20 MYBPZM 29
ARR1AT 20 IBOXCORE 30
INRNTPSADB 20 RAV1AAT 30
MYCATRD22 20 WBOXATNPR1 30
NAPINMOTIFBN 20 WRKY71OS 30
RYREPEATVFLEB4 20 RYREPEATGMGY2 33
TATABOX3 20 REALPHALGLHCB21 34
ARFAT 21 PRECONSCRHSP70A 36
POLLEN1LELAT52 21 RYREPEATLEGUMINBOX 36
WBOXHVISO1 21 ACGTABOX 38
-300ELEMENT 22 SORLIP1AT 41
BOXCPSAS1 22 GTGANTG10 44
CARGCW8GAT 22 POLASIG1 44
GT1CORE 22 BIHD1OS 47
NODCON1GM 22 RYREPEATBNNAPA 47
OSE1ROOTNODULE 22 CCAATBOX1 49
SEF4MOTIFGM7S 22 ABRERATCAL 50
EECCRCAH1 23 CURECORECR 52
HEXAMERATH4 23 GCCCORE 52
RBCSCONSENSUS 23 CGACGOSAMY3 54
WBOXNTERF3 23 RHERPATEXPA7 54
CACGTGMOTIF 24 EBOXBNNAPA 60
ABRELATERD1 25 MYCCONSENSUSAT 60
ACGTABREMOTIFA2OSEM 25 GATABOX 66
DPBFCOREDCDC3 25 GT1CONSENSUS 67
HEXMOTIFTAH3H4 26 CAATBOX1 70
ROOTMOTIFTAPOX1 27 LTRECOREATCOR15 81
TAAAGSTKST1 27 DOFCOREZM 85
SORLIP2AT 28 ACGTATERD1 108
GT1GMSCAM4 29 CACTFTPPCA1 127
MYB1AT 29 CGCGBOXAT 159
Table 9. Common cis elements among the gene groups formed according to the expression profile
Stress Group Common cis elements
Anoxia 3 REALPHALGLHCB21; HEXMOTIFTAH3H4; TATAPVTRNALEU; ACGTABOX
5 CACGTGMOTIF
Salt -
a decrease was observed. LOC_Os01g21120 (EREBP 3)
and LOC_Os02g43790 (ERF 91) presented a decrease
in the expression along the time of exposure to salt stress conditions, but at 24 h a slight increase was observed.
Under anoxia stress, the gene LOC_Os09g11480
presented a linear increase in transcript levels along the time. It is interesting to note that this gene presented an increase in
transcript levels close to 600-fold. The genes LOC_Os01g21120
and LOC_Os02g43790 presented a similar performance under
lack of O2, exhibiting a decrease in the first hours followed by
an increase after 72 h of stress.
The gene LOC_Os09g11480 was induced late under M.
grisea infection, showing no changes at 3 dpi and an increase near
to 100-fold at 4 dpi. The gene LOC_Os01g21120 presented a
linear increase along the infection period. Differently of LOC_
Os09g11480, LOC_Os02g43790 presented an early induction,
showing an increase of nearly 80-fold at 3 dpi, followed by a decrease of expression at 4 dpi.
When one compares the data obtained by microarray (Figure 1) with the ones obtained through qPCR (Figure 3), some differences can be observed in the expression profiles.
The genes LOC_Os01g21120 and LOC_Os02g43790 showed
Figure 3. Ethylene response factors gene transcript accumulation in rice, cv. Nipponbare under different stress conditions (salt, anoxia, and M. grisea).
6
4
0
8 h 16 h
Relativ e expr ession le vel 0 h 18 14 10 24 h Salt (NaCl 150mM) 16 12 8 2 LOC_Os09g11480 0.6 0.4 0.0
8 h 16 h 0 h
1.4
1.0
24 h Salt (NaCl 150mM) 1.2 0.8 0.2 0.6 0.4 0.0 1.4 1.0 1.2 0.8 0.2 LOC_Os01g21120
8 h 16 h
0 h 24 h
Salt (NaCl 150mM) LOC_Os02g43790
60
40
0
24 h 48 h
Relativ e expr ession le vel 0 h 800 100 72 h Anoxia 600 80 20 LOC_Os09g11480 10 0
3 d 4 d
Relativ e le vel expr ession 0 d 120 30
M. grisea (1.6X10³ spores mL-1)
3 d 4 d 0 d
M. grisea (1.6X10³ spores mL-1)
3 d 4 d 0 d
M. grisea (1.6X10³ spores mL-1)
100 20 LOC_Os09g11480 2 1 0 Relativ e expr ession le vel 8 6 4 7 5 3 1.5 1.0 0.0 Relativ e expr ession le vel 2.5 3.0 2.0 0.5 6 4 0 14 10 12 8 2 LOC_Os01g21120 LOC_Os02g43790
24 h 48 h
0 h 72 h
Anoxia
24 h 48 h
0 h 72 h
similar profile in both techniques, however, LOC_Os09g11480
did show a contrasting profile. This can be observed when microrrays and qPCR results are compared, thus besides high throughput transcriptomics associated to bioinformatics, it is important to validate these results with more precise techniques and other biological essays.
DISCUSSIoN
Previous studies suggested that ethylene acts in a complex signalling pathway, composed by phosphorylation cascades and regulation at the transcriptional and post-transcriptional stages (Solano et al. 1998). Interaction of ethylene with other signalling molecules will determine which ethylene responsive genes will be activated in a given cell at a given time, resulting in a wide range of possible responses (Stepanova and Alonso 2009).
Under conditions of complete lack of O2, there is no
ethylene production (Dat et al. 2004). Therefore, the induction
of ERFgenes under anoxia observed in this work is attributed
to other signalling molecules. Among the potential signals
for ERFinduction, there are reactive oxygen species (ROS)
(Wu et al. 2008) formed under anoxia conditions (Cramer
et al. 2011). The repression of a large number of ERFcan be
associated with the inhibition of ethylene production under these conditions.
Besides ethylene production, under salt stress, there is also abscisic acid (Zhang et al. 2006) and ROS (Abogadallah 2010) production. However, in this case, these molecules do not seem to have effect on the regulation of ERF genes.
Overlapping expression in Venn diagrams demonstrate similar response mechanisms in rice ERFs. The overlap of gene expression in response to different stresses has already been reported (Fujita et al. 2006). In the case of the ERF family, this overlap among members can be explained by the fact that some genes can be regulated by different molecules, as ethylene, methyl jasmonate, salycilic and abscisic acids, which are synthesized under different environmental stress conditions (Divi et al. 2010). The overlapping expression of ERFs takes into account the hypothesis that these genes act as connectors in the signalling pathways that mediate responses to biotic and abiotic responses. This mediation has been proven, for instance, in submergence and drought (Fukao et al. 2011).
The unique profiles of ERF foundon each stress indicate
that these transcription factors are related to the regulation of plant response specifically to that given stress.
The results also suggest sub-functionalization in the ERF gene family, since wherever gene duplicates it can undergo simultaneous reduction of their activity thereby maintaining the total capacity of the ancestral gene (Gallego-Bartolome et al. 2010).
The control of gene expression is critical for determining the stress response mechanism of plants. Many studies have been performed aiming to identify cis acting elements, which play a major role in transcriptional regulation (Walley et al. 2007, Mittal et al. 2009, Zou et al. 2011). However, for the ERF family in rice, very few of such studies have been reported ( Jung et al. 2010, Santos et al. 2013).
The cis element with highest occurrence (159) among the
ERF genes was CGCGBOXAT (A/C/G)CGCG(G/T/C),
which is well known in promoters of genes involved in ethylene, abscisic acid and light perception (Yang and Poovaiah 2002). The second most common cis element (127) was CACTFTPPCA1 (CACT), which is present in the promoter of the C4 isoform of phosphoenolpyruvate carboxylase (Gowik et al. 2004). The third (108) most common element was ACGTATERD1 (ACGT) and is required for induced etiolation (Simpson et al. 2003).
Similarly to what was already mentioned, the increase
in expression of ERFgenes, observed in anoxia conditions
is probably not due to ethylene signalling, but to other molecules, such as ROS. Under other stresses (salt and
M. grisea), the induction of transcript levels can be
associated with the cross-talk of different hormones synthesized under these conditions.
It is possible to conclude that few genes belonging to
the ERF gene family present specific expression profiles,
while many others are commonly expressed under the different stress conditions studied. Within the ERF family, the regulation of genes is composed of normal (84/115=73%), complex (18/115=16%) and simple regulation (13/115=11%) regarding the presence of different cis elements in the promoter regions. However, weak associations between the presence of specific cis elements and the observed expression profile were detected.
ACKNowLeDGeMeNTS
Abogadallah GM (2010) Antioxidative defense under salt stress. Plant Signaling & Behavior 5:369-374.
Brivanlou A, Darnell J (2002) Signal transduction and the control of gene expression. Science 295:813-818.
Boutilier K, Offringa R, Sharma VK, Kieft H, Ouellet T, Zhang
L, Hattori J, Liu CM, Lammeren AAM, Miki BLA, Custers JBM, Campagne MML (2002) Ectopic expression of BABY BOOM triggers a conversion from vegetative to embryonic growth. The Plant Cell 14:1737-1749.
Cheng MC, Liao PM, Kuo WW, Lin TP (2013) The Arabidopsis
ETHYLENE RESPONSE FACTOR1 regulates abiotic stress-responsive gene expression by binding to different cis-acting elements in response to different stress signals. Plant Physiology 162:1566-1582.
Cramer GR, Urano K, Delrot S, Pezzotti M, Shinozaki K (2011)
Effects of abiotic stress on plants: a systems biology perspective. BMC Plant Biology 11:163.
Dat JF, Capelli N, Folzer H, Bourgeade P, Badot PM (2004) Sensing and signalling during plant flooding. Plant Physiology and Biochemistry 42:273-282.
Divi UK, Rahman T, Krishna P (2010) Brassinosteroid-mediated
stress tolerance in Arabidopsis shows interactions with abscisic acid, ethylene and salicylic acid pathways. BMC Plant Biology 10:151.
Dubouzet JG, Sakuma Y, Ito Y, Kasuga M, Dubouzet EG, Miura S, Seki M, Shinozaki K, Yamaguchi-Shinozaki K (2003) OsDREB
genes in rice, Oryza sativa L., encode transcription activators that function in drought-, high-salt- and cold-responsive gene expression. The Plant Journal 33:751-763.
Elliott RC, Betzner AS, Huttner E, Oakes MP, Tucker WQJ, Gerentes D,
Perez P, Smyth DR (1996) AINTEGUMENTA, an APETALA2-like gene of Arabidopsis with pleiotropic roles in ovule development and floral organ growth. The Plant Cell 8:155-168.
Fujimoto SY, Ohta M, Usui A, ShinshI H, Ohme-Takagi M (2000)
Arabidopsis ethylene-responsive element binding factors act as transcriptional activators or repressors of GCC Box–Mediated Gene Expression. The Plant Cell 12:393-404.
Fujita M, Fujita Y, Noutoshi Y, Takahashi F, Narusaka Y, Yamaguchi-Shinozaki K, Shinozaki K (2006) Crosstalk between
abiotic and biotic stress responses: a current view from the points of convergence in the stress signaling networks. Current Opinion in Plant Biology 9:436-442.
Fukao T, Yeung E, Bailey-Serres J (2011) The submergence tolerance regulator SUB1A mediates crosstalk between submergence and drought tolerance in rice. The Plant Cell 23:412-427.
Gallego-Bartolome J, Minguet EG, Marín JA, Prat S, Blázquez MA, Alabad D (2010) Transcriptional diversification and functional conservation between DELLA proteins in Arabidopsis. Molecular Biology and Evolution 27:1247-1256.
Grennan AK (2008) Ethylene response factors in jasmonate
signaling and defense response. Plant Physiology 146:1457-1458.
Gilmour SJ, Sebolt AM, Salazar MP, Everard JD, Thomashow MF (2000) Overexpression of Arabidopsis CBF3 transcriptional activator mimics multiple biochemical changes associated with cold acclimation. Plant Physiology 124:1854-1865.
Gilmour SJ, Fowler SG, Thomashow MF (2004) Arabidopsis transcriptional activators CBF1, CBF2, and CBF3 have matching functional activities. Plant Molecular Biology 54:767-781.
Gowik U, Burscheidt J, Akyildiz M, Schlue U, Koczor M, Streubel RAM, Westhoff P (2004) Cis-Regulatory elements for
mesophyll-specific gene expression in the C4 plant Flaveria trinervia, the promoter of the C4 phosphoenolpyruvate carboxylase gene. The Plant Cell 16:1077-1090.
Higo K,Ugawa Y, Iwamoto M, Korenaga T (1999) Plant cis-acting
regulatory DNA elements (PLACE) database. Nucleic Acids Research 27:297-300.
Jung KI-H, SeoY-S, Walia H, Cao P, Fukao T, Canlas PE, Amonpant
F, Bailey-Serres J, Ronald PC (2010) The submergence tolerance regulator Sub1A mediates stress-responsive expression of AP2/ ERF transcription factors. Plant Physiology 152:1674-1692.
Lasanthi-Kudahettige R,Magneschi L,LOreti E, Gonzali S, Licausi
F, Novi G, Beretta O,Vitulli F, Alpi A, Perata P. (2007) Transcript profiling of the anoxic rice coleoptile. Plant Physiology 144:218-231.
Li X, Zhu X, Mao J, Zou Y, Fu D, Chen W, Lu W (2013) Isolation
and characterization of ethylene response factor family genes during development, ethylene regulation and stress treatments in papaya fruit. Plant Physiology and Biochemistry 70:81-92. Licausi F, Dongen JT, GiuntoliB, Novi G, Santaniello A, Geigenberger P, Perata P (2010) HRE1 and HRE2, two hypoxia-inducible ethylene response factors, affect anaerobic responses in Arabidopsis thaliana. The Plant Journal 62: 302-315.
Liu Q,Kasuga M, Sakuma Y, Abe H, Miura S, Yamaguchi-Shinozaki K, Shinozaki K (1998) Two transcription factors, DREB1 and DREB2,
with an EREBP/AP2 DNA binding domain separate two cellular signal transduction pathways in drought- and low-temperature-responsive gene expression, respectively, in Arabidopsis. The Plant Cell 10:1391-1406.
Liu L, White MJ, Macrae TH (1999) Transcription factors and
their genes in higher plants functional domains, evolution and regulation. European Journal of Biochemistry 262:247-257.
Maeo K, Tokuda T, Ayame A, Mitsui N, Kawai T, Tsukagoshi H, Ishiguro S, Nakamura K (2009) An AP2-type transcription factor, WRINKLED1, of Arabidopsis thaliana binds to AW-box sequence
conserved among proximal upstream regions of genes Involved in fatty acid synthesis. The Plant Journal 60:476-487.
Mittal D, Chakrabarti S, Sarkar A, Singh A, Grover A (2009) Heat shock factor gene family in rice: Genomic organization and transcript expression profiling in response to high temperature, low temperature and oxidative stresses. Plant Physiology and Biochemistry 47:785-795.
Nakano T, Suzuki K, Fujimura T, Shinshi H (2006) Genome-wide
analysis of the ERF gene family in Arabidopsis and rice. Plant Physiology 140:411-432.
Ohme-Takagi M, Shinshi H (1995) Ethylene-inducible DNA binding proteins that interact with an ethylene-responsive element. The Plant Cell 7:173-182.
Oliveros JC (2007) VENNY. An interactive tool for comparing lists with Venn Diagrams. http://bioinfogp.cnb.csic.es/tools/venny/index.html
Pfaffl MW (2001) A new mathematical model for relative quantification
in real-time RT-PCR. Nucleic Acids Research 29:2001-2007. Ribot C, Hirsch J, Balzergue S, Tharreau D, Nottéghem JL, Lebrum MH, Morel JB (2008) Susceptibility of rice to the blast fungus,
Magnaporthe grisea. Journal of Plant Physiology 165:114-124.
Rombauts S, Florquin K,Lescot M, Marchal K,Rouze P, Van de
Peer Y (2003) Computational approaches to identify promoters and cis-regulatory elements in plant genomes. Plant Physiology 132:1162-1176.
Sakuma Y, Liu Q,DubouzeT JG, Abe H, Shinozaki K, Yamaguchi Shinozaki K (2002) DNA-binding specificity of the ERF/AP2
domain of Arabidopsis DREBs,transcription factors involved in dehydrationand cold-inducible gene expression. Biochemical and Biophysical Research Communications 290:998-1009.
Sakuma Y, Maruyama K, Osakabe Y, Qin F, Seki M, Shinozaki K, Yamaguchi-Shinozaki K (2006) Functional analysis of an
Arabidopsis transcription factor, DREB2A, involved in drought-responsive gene expression. The Plant Cell 18:1292-1309.
Santos RS dos, Krüger MM, Pegoraro C, Madabula F, Da Maia LC,
Rombaldi CV, Oliveira AC de (2013) Transcriptional regulation of seven ERFs in rice under oxygen depletion and iron overload stress. Tropical Plant Biology 6:16-25.
Sasaki K, Mitsuhara I, Seo S, Ito H, Matsui H, Ohashi Y (2007) Two novel AP2/ERF domain proteins interact with cis-element VWRE
for wound induced expression of the Tobacco tpoxN1 gene. The Plant Journal 50:1079-1092.
Simpson SD, Nakashima K, Narusaka Y, Seki M, Shinozaki K,
Yamaguchi-Shinozaki k (2003) Two different novel cis-acting elements of erd1, a clpA homologous Arabidopsis gene function in induction by dehydration stress and dark-induced senescence. The Plant Journal 33:259-270.
Solano R, Stepanova A, Chao QM, Ecker JR (1998) Nuclear events
in ethylene signaling: a transcriptional cascade mediated by ETHYLENE-INSENSITIVE3 and ETHYLENE-RESPONSEFACTOR1. Genes & Development 12:3703-3714.
Stepanova AN, Alonso JM (2009) Ethylene signaling and response: where different regulatory modules meet. Current Opinion in Plant Biology 12:548-555.
Stockinger EJ, Gilmour SJ,Thomashow MF (1997) Arabidopsis thaliana CBF1 encodes an AP2 domain-containing transcriptional activator that binds to the C-repeat/DRE, a cis-acting DNA regulatory element that stimulates transcription in response to low temperature and water deficit. Proceedings of the National Academy of Sciences 94:1035-1040.
Vahala J, Felten J, Love J, Gorzsás A, Gerber L, Lamminmäki
A, Kangasjärvi J, Sundberg B (2013) A genome-wide screen
for ethylene-induced ethylene response factors (ERFs) in hybrid aspen stem identifies ERF genes that modify stem growth and wood properties. New Phytologist 200:511-522.
Xu K, Xu X, Fukao T, Canlas P, Maghirang-Rodriguez R, Heuer
S, Ismail AM, Bailey-Serres J, Ronald PC, Mackill DJ (2006) Sub1A is an ethylene-response-factor-like gene that confers submergence tolerance to rice. Nature 442:705-708.
Yamaguchi-Shinozaki K, Shinozaki K (1994) A novel cis-acting
element in an Arabidopsis gene is involved in responsiveness to drought, low-temperature, or high-salt stress. The Plant Cell 6:251-264.
Yamaguchi-Shinozaki K, Shinozaki K (2006) Transcriptional
regulatory networks in cellular responses and tolerance to dehydration and cold stresses. Annual Review of Plant Biology 57:781-803.
Yamamoto S, Suzuki K, Shinshi H (1999) Elicitor-responsive
ethylene independent activation of GCC box-mediated transcription that is regulated by both protein phosphorylation and dephosphorylation in cultured tobacco cells. The Plant Journal 20:571-579.
Yang T, Poovaiah BW (2002) A calmodulin-binding/CGCG box
DNA-binding protein family involved in multiple signaling pathways in plants. The Journal of Biological Chemistry 277:45049-45058.
Yang Z, Tian L, Latoszek-Green M, Brown D, Wu K (2008)
Arabidopsis ERF4 is a transcriptional repressor capable of
modulating ethylene and abscisic acid responses. Plant Molecular Biology 58:585-596.
Walia H, Wilson C, Condamine P, Liu X, Ismail AM, Zeng L, Wanamaker SI, Mandal J, Xu J, Cui X, Close TJ (2005) Comparative
transcriptional profiling of two contrasting rice genotypes under salinity stress during the vegetative growth stage. Plant Physiology 139:822-835.
Walley JW, Coughlan S, Hudson ME, Covington MF, Kaspi R, Banu G, Harmer SL, Dehesh K (2007) Mechanical stress induces biotic and abiotic stress responses via a novel cis-element. PLoS
Genetics 3:e172.
Welsch R, Maass D, Voegel T, Della-Penna D, Beyer P (2007)
Transcription factor RAP2.2 and its interacting partner SINAT2: stable elements in the carotenogenesis of Arabidopsis leaves. Plant Physiology 145:1073-1085.
Wu L, ZhangZ, Zhang H, Wang X-C, Huang R (2008)
Transcriptional modulation of ethylene response factor protein JERF3 in the oxidative stress response enhances tolerance of tobacco seedlings to salt, drought, and freezing. Plant Physiology 148:1953-1963.
Zhang J, Jia W, Yang J, Ismail AM (2006) Role of ABA in
integrating plant responses to drought and salt stresses. Field Crops Research 97:111-119.
Zimmermann P, Laule O, Schmitz J, Hruz T, Bleuler S, Gruissem
W (2008) Genevestigator transcriptome meta-analysis and
biomarker search using rice and barley gene expression databases. Molecular Plant 1:851-857.
Zou C, Sun K, Mackaluso JD, Seddon AE, Jin R, Thomashow