the Much Debated Start of the HPV Vaccination Program
in the Netherlands? A Discrete Choice Experiment
Robine Hofman1*, Esther W. de Bekker-Grob1, Jan Hendrik Richardus1,2, Harry J. de Koning1, Marjolein van Ballegooijen1, Ida J. Korfage1
1Department of Public Health, Erasmus MC - University Medical Centre Rotterdam, Rotterdam, the Netherlands,2Municipal Public Health Service Rotterdam-Rijnmond, Rotterdam, the Netherlands
Abstract
Objectives:To assess how girls’ preferences have changed almost 3 years after the much debated start of the human papillomavirus (HPV) vaccination program.
Methods:A discrete choice experiment (DCE) was conducted among girls aged 11–15 years who were invited, or were not yet invited, to get vaccinated. A panel latent class model was used to determine girls’ preferences for vaccination based on five characteristics: degree of protection against cervical cancer; duration of protection; risk of mild side-effects; age of vaccination; and the number of required doses of the vaccine.
Results:The response rate was 85% (500/592). Most girls preferred vaccination at age 14 years (instead of at age 9 years) and a 2-dose scheme (instead of the current 3-dose scheme). Girls were willing to trade-off 7% (CI: 3.2% to 10.8%) of the degree of protection to have 10% less risk of mild side-effects, and 4% (CI: 1.2% to 5.9%) to receive 2 doses instead of 3 doses. Latent class analyses showed that there was preference heterogeneity among girls, i.e., higher educated girls and HPV vaccinated girls had a higher probability to opt for HPV vaccination at a higher age than lower educated girls or non-vaccinated girls.
Conclusions:Three years after the start of HPV vaccination program the risk of mild side-effects and age at vaccination seem to have become less important. For the Dutch national immunization program, we recommendnot to lower the
current target age of 12 years. A 2-dose scheme may result in a higher uptake and we recommend that if this scheme is introduced, it needs to receive adequate publicity.
Citation:Hofman R, de Bekker-Grob EW, Richardus JH, de Koning HJ, van Ballegooijen M, et al. (2014) Have Preferences of Girls Changed Almost 3 Years after the Much Debated Start of the HPV Vaccination Program in the Netherlands? A Discrete Choice Experiment. PLoS ONE 9(8): e104772. doi:10.1371/journal.pone. 0104772
Editor:Diane Medved Harper, University of Missouri Kansas CIty School of Medicine, United States of America ReceivedFebruary 20, 2014;AcceptedJuly 16, 2014;PublishedAugust 19, 2014
Copyright:ß2014 Hofman et al. This is an open-access article distributed under the terms of the Creative Commons Attribution License, which permits unrestricted use, distribution, and reproduction in any medium, provided the original author and source are credited.
Funding:This study was funded by the Dutch Cancer Society (no. EMCR 2009-4561). The funders had no role in study design, data collection and analysis, decision to publish, or preparation of the manuscript.
Competing Interests:The authors have declared that no competing interests exist. * Email: [email protected]
Introduction
Human Papillomavirus (HPV) infection is a necessary factor in the development of cervical cancer [1,2]. HPV types 16 and 18 are responsible for about 70% of all cervical cancers worldwide [3]. Preferably the HPV vaccine (which protects against those two types) is given prior to the initiation of sexual activity, because the degree of protection is reduced after HPV infection [4–6].
Many Western countries have included HPV vaccination in their immunization program. For example, the United Kingdom, Canada, Australia and the Netherlands offer the HPV vaccine to girls at an age between 11 and 14 years; in these countries, the uptake rates range from 50–80%. The willingness to accept HPV vaccination can largely be influenced by general preferences for healthcare interventions [7]. One way to assess preferences is to conduct a discrete choice experiment (DCE), in which people trade off risks and benefits among competing programs [8]. In the
design of a DCE it is assumed that a healthcare intervention can be described by its characteristics (attributes) and that the levels of those attributes determine preferences for an intervention [9]. By offering a series of choices between two or more intervention alternatives with different combinations of attribute levels, the relative importance of attributes can be assessed [10]. Previous DCE studies about preferences for HPV vaccination showed that attributes such as the duration and degree of protection against cervical cancer were important among mothers of eligible girls [11], adults from the general public [12], and eligible girls [13].
intensive societal debate involving politics, physicians, media, parents and girls, which may have resulted in uptake rates being lower than expected beforehand. During that period we carried out a DCE to assess girls’ preferences for HPV vaccination [13]. We showed how girls made trade-offs between the degree of protection against cervical cancer, the duration of protection, the risk of serious effects (e.g. hospitalization), the risk of mild side-effects (e.g. nausea), and age of vaccination. Currently, almost 3 years later, although no serious side-effects have been linked to the vaccine, this has not resulted in a large increase in the vaccination rates.
Therefore, the present study assesses which attributes of HPV vaccination have influenced preferences for HPV vaccination uptakeafterthe media debates have ended and in the absence of reports of serious side-effects. To our knowledge, this is the first study to compare preferences for HPV vaccination as expressed in DCEs. We will look at the differences in preferences as measured in 2009 versus 2011. This comparison may provide insight into girls’ motivation to be vaccinated or not, how this motivation can change over time, and how to improve dissemination of information about the vaccine.
Methods
Attributes and attribute levels
The selection of HPV vaccination attributes and their levels was based on our previous study [13]. However, for the present study we excluded the attribute ‘risk of serious side-effects’ from the choice sets since no serious side-effects of the vaccine have been reported since its introduction in vaccination campaigns. The Centers for Disease Control and Prevention (CDC) state the following about the bivalent vaccine: the bivalent vaccine is safe, it has been in use around the world for several years and has been very safe. However, any medicine can potentially cause a serious problem, such as a severe allergic reaction. The risk of a vaccine causing a serious injury, or death, is extremely small. Life-threatening allergic reactions from vaccines are very rare [16]. Instead, we mentioned in the questionnaire that the risk of serious side-effects on the long term is unknown. We added the attribute ‘number of doses of the vaccine’, because less than the currently applied number of 3 doses is also likely to be effective [17].
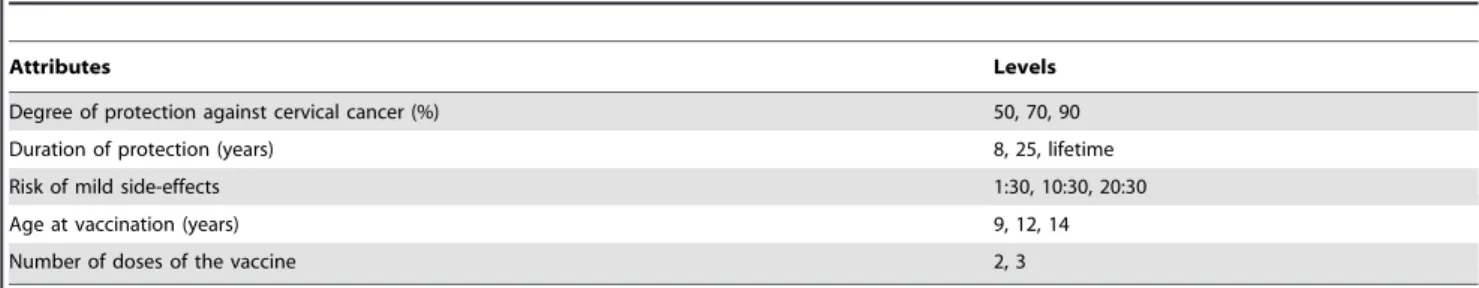
The final set consisted of the following attributes: 1) the degree of protection against cervical cancer; 2) the duration of protection; 3) the risk of mild side-effects; 4) the age of vaccination; and 5) the number of doses of the vaccine (Table 1). The levels we used for degree of protection were 50%, 70% and 90%. It is assumed that the protection against cervical cancer is 70%, but since it takes 10 to 15 years for cervical cancer to develop it is not sure yet whether the protection indeed will be 70%. It might also be possible that the protection is lower or a new HPV vaccine will be available in the future that has an effectiveness of 90% [18]. Since to date, follow-up data on HPV vaccinated young women are available for 8.4 years, it is known that protection lasts at least 8 years, but it is unknown how long the duration of protection will be [19]. We therefore wanted to know girls’ preferences for a duration of 8 years, 25 years and lifelong protection. The levels of the risk of mild side-effects were 1:30, 10:30 and 20:30, which were based on figures from the Centers for Disease Control and Prevention [20]. We choose 30 as the denominator, because many classes consist of 30 students and therefore girls could interpret the risk as 1, 10 or 20 students in their class suffering from mild effects. The side-effects were defined as: pain, itch, redness and swelling on the injection area; fever; headache; dizziness; nausea and fainting within 2 hours after vaccination. The risk of mild side-effects is not
modifiable, but if for example girls put a lot of weight on this risk, information about the risk may highlight the short duration of the side-effects. Levels of the age of vaccination were 9, 12 and 14 years. If most girls will have a preference for 9 or 14 years instead of the current 12 years, it might be a possibility to broaden the age range at which girls are offered the vaccine for free. The levels of the number of doses of the vaccine were 2 and 3 doses. If for example most girls have a preference for 2 doses, then uptake may increase if 2 doses are used instead of 3.
Study design
The combination of four attributes with three levels each, and one attribute with two levels, resulted in 162 (34621) hypothetical HPV vaccination alternatives. We generated a subsample of these alternatives using priors available from De Bekker-Grob et al. [13] and a zero prior for the attribute ‘number of doses’ to generate an efficient design by maximizing D-efficiency (using Ngene software, version 1.1.1, http://www.choice-metrics.com/) [21]. Sixteen choice sets were constructed to be able to estimate all main effects. Choice sets consisted of two HPV vaccination alternatives and a ‘no HPV vaccination’ option to allow respondents to ‘opt out’ (Table 2).
Study sample
Calculation of the optimal sample size for estimating discrete choice models from DCE data is complicated, as it depends on the true values of the unknown parameters estimated in the choice models [22]. Earlier studies have shown that sample sizes of 300– 400 respondents are sufficient for reliable statistical analyses [23,24]. Therefore, first, we strived to collect at least 400 completed questionnaires. In order to do so, taking into account an expected response rate of at least 80% [13], we recruited a representative sample of n = 592 girls aged 11–15 years through four secondary schools in urban and rural areas in the Nether-lands. Second, we checked a posteriori whether our sample size would be sufficient to find significant differences for each attribute (level) at a 5% level using the true values of the estimated parameters and NGene software (http://www.choice-metrics. com/).
Questionnaire
The first page of the questionnaire provided basic information about HPV vaccination. Next, respondents were asked to indicate per choice set which option appealed to them most. Pictographs were used to illustrate the percentages of the degree of protection and the risk of mild side-effects.
To assess respondents’ understanding of the DCE task we included a dominant choice set as a rationality test. In this choice set age of vaccine administration was similar in both alternatives, while one alternative was characterized by logically preferable levels on all other attributes. Also we included four items on a 5-point Likert scale to evaluate whether respondents considered the DCE questions ‘clear-unclear, ‘difficult-easy’, ‘annoying-pleasant’, and the number of questions as ‘too many-not too many’. Convergent validity was checked by asking the respondents to rank the five attributes of HPV vaccination from most important to least important. This ranking is compared with the trade-offs respondents were willing to make between the degree of protection and the other attributes.
in interpretation and therefore did not pilot test the questionnaire of the present study.
Procedure
Respondents completed the questionnaire in the classroom or auditorium during school time. First, general information was given about HPV and vaccination and about the way DCE questions should be completed. Completion of the written questionnaire lasted about 20–30 min. Questionnaires were completed in November and December 2011.
Beforehand, girls’ parents had received an information letter covering the purpose, the voluntary nature and anonymity of the study, and an opt-out form. Parents that did not want their daughter to participate could sign the opt-out form. Girls’ parents who approved participation did not have to sign an informed consent form. The Medical Ethics Committee of Erasmus MC, University Medical Center Rotterdam declared that this research (number MEC 2011-059) did not fell under the Medical Research Involving Human Subjects Act, because Participants were not subject to procedures or are required to follow rules of behavior.
Statistical analyses
The DCE was analyzed by taking each choice among the three options (two HPV vaccination options, and a ‘no vaccination option’) as an observation. The utility for ‘‘no vaccination’’ was normalized to zero: V(no vaccination) = 0. Using NLogit software (http://www.limdep.com/), the observations were analysed by a panel latent class model [25]. This model can be used to identify classes in the population, i.e., identifying different utility (prefer-ence) functions across unobserved subgroups. Class membership is latent in that each respondent belongs to each class up to a modelled probability and is not deterministically assigned by the analyst a priori. The model is flexible in that the probability that sampled respondents belong to a particular class can be linked to covariates (such as age, education, etc.), hence allowing for some
understanding as to the make-up of the various class segments [26].Panellatent class model means that the model accounts for the pseudo panel nature of the DCE data since each respondent completed 16 choice tasks. To determine the number of classes to impose on the model structure, we selected the model with the best fit based on the Akaike information criterion (AIC) [25].
We tested a number of different specifications for the utility (preference) function. After testing for linear continuous effects of the attributes, the following final specification of the utility model was estimated:
VDc~b0Dczb1DcEFFECTIVENESSzb2DcDURATION25Y
zb3DcDURATION LIFETIMEzb4DcSIDE{EFFECTS
zb5DcAGE 12Yzb6DcAGE 14Yzb7DcNUMBER OF
DOSES3
ð1Þ
V|c represents the observable utility (preference score) that
respondents belonging to class segment c have for an HPV vaccination.b1|c27|care class specific coefficients of the attributes
indicating the relative weight individuals place on a certain attribute (level). The unobserved component,E, is assumed to be independently and identically (IID) extreme value type 1 (EV1) distributed. In addition to the utility function, the final model allowed for several significant covariates (‘respondent’s history of HPV vaccination’ and ‘education’) to enter into the class assignment model. Effects coded variables were used for protection of duration, age at vaccination, and doses of the vaccine. Degree of protection and risk of mild side-effects were coded as a linear term. The statistical significance of a coefficient (p-value #0.05) indicates that conditional to belonging to a class, respondents differentiated between one attribute (or attribute level) and another in making stated choices about HPV vaccination Table 1.Attributes and levels for HPV vaccination included in the discrete choice experiment design.
Attributes Levels
Degree of protection against cervical cancer (%) 50, 70, 90
Duration of protection (years) 8, 25, lifetime
Risk of mild side-effects 1:30, 10:30, 20:30
Age at vaccination (years) 9, 12, 14
Number of doses of the vaccine 2, 3
doi:10.1371/journal.pone.0104772.t001
Table 2.Choice set example.
Attributes Program A Program B No vaccination
Degree of protection against cervical cancer 70% 90% 0%
Duration of protection Lifetime 8 years n.a.
Risk of mild side-effects 10:30 20:30 No risk
Age at vaccination 12 years 12 years n.a.
Number of doses of the vaccine 3 3 0
Which vaccination program do you prefer? A B None
n.a. = not applicable.
programs. A priori, we expected all attributes to be significant. The sign of a coefficient reflects whether the attribute has a positive or negative effect on the preference score (utility). We expected that the attributes ‘risk of mild-effects’ and ‘the number of doses of the vaccine’ would have a negative effect. The value of each coefficient represents the relative importance respondents assign to an attribute level. Sensitivity analyses were conducted to explore the impact of excluding respondents who failed the rationality test by excluding their data from the sample and re-running the analysis [27,28].
In terms of the class assignment parameters, statistically significant parameter estimates indicate that the associate covar-iate (i.e. ‘respondent’s history of HPV vaccination’ and ‘educa-tion’) can be used to help in understanding the different segments. For example, if the education parameter associated with a particular class in the assignment model is positive and significant, then this is indicative that people who have a higher educational level are more likely to belong to that particular class and, hence, have preferences associated with the utility function belonging to that class as given in Equation (1).
The trade-offs respondents were willing to make between the attributes were calculated by the ratios of the coefficients of the different attributes with the degree of protection as the denom-inator. These trade-offs were weighted by the probability that a respondent belongs to a given class. Confidence intervals were calculated in Excel using the Krinsky and Robb method [29]. The number of simulations was 65,000 (i.e., 130 Sobol draws6500 respondents).
Since our 2009 study is a point of reference for this study, we compared the similarity of the present sample to the 2009 sample. Mann-Whitney U tests were used for continuous variables and Chi-square tests were used for categorical variables.
Results
Respondents
The response rate was 85% (500/592). The mean age of the respondents was 12.9 years; most had a higher level of secondary education (38%) and no religious affiliation (68%). Of the respondents, 63% had already been invited to get vaccinated against HPV of whom 70% had opted for vaccination (Table 3). Compared to the 2009 sample, respondents in the present sample were younger (difference 0.4 years,p-value,0.01); more respon-dents had a lower or intermediate educational level and less girls had a higher educational level (p-value,0.01); and less respon-dents were vaccinated against HPV (p-value = 0.045).
DCE results
Based on the AIC criterion, three classes were identified (Table 4). The average class probabilities within the sampled population were 31.0%, 45.5% and 23.5% for latent class 1, 2 and 3, respectively. The probability to belong to a specific class depended on the respondent’s level of secondary education and whether she has been vaccinated against HPV. Namely, girls attending higher levels of secondary education and HPV vaccinated girls had a higher chance to belong to latent class 3, than lower educated and non HPV vaccinated girls(Dutch secondary schools have different educational levels). Respondents belonging to latent class 3 preferred vaccination at age 12 years to age 9 years, which was not a significant preference for respondents who belong to latent class 1 and 2. Most of the estimated coefficients for each latent class had the expected sign and were significant in most cases (Table 4). Although all five HPV vaccination attributes significantly influenced girls’ preferences,
the preference heterogeneity was substantial. Respondents in all classes preferred a lower risk of mild side-effects and a higher degree of protection to a higher risk and a lower degree of protection; they also preferred 25 years of protection to 8 years of protection. Respondents belonging to class 1 preferred 25 years of protection to 8 years of protection, rather than lifetime protection to 8 years of protection. Respondents who belong to latent class 2 and 3 preferred 2 doses to 3 doses, and preferred vaccination at 14 years rather than at 9 years, whereas respondents belonging to latent class 1 showed no significant preference for the number of doses or the age of vaccination. Sensitivity analyses showed that excluding the data of ten out of 500 respondents (2%) who ‘failed’ the rationality test had no relevant impact on the size or relative importance of the attributes.
Trade-offs
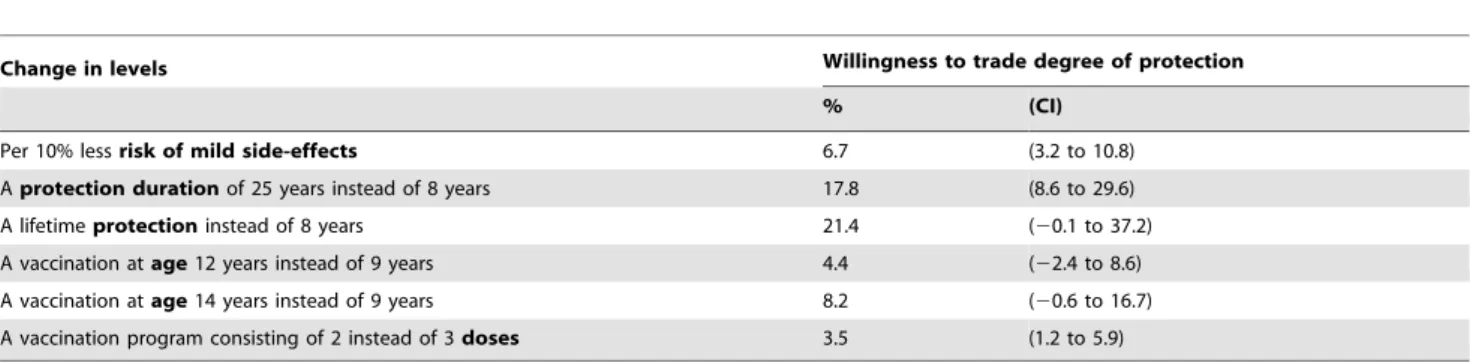
Overall, respondents were willing to trade-off 7% (CI: 3.2% to 10.8%) of the degree of protection to have a 10% less risk of mild side-effects. To obtain protection against HPV for 25 years instead of 8 years, they were willing to trade-off 18% (CI: 8.6% to 29.6%), and to obtain lifetime protection instead of 8 years of protection, they were willing to trade-off 21% (CI: 20.1% to 37.2%). Respondents were willing to trade-off 4% (CI: 1.2% to 5.9%) to receive 2 doses instead of 3 doses. To get a vaccination at age 12 or 14 years, instead of at 9 years, respondents were willing to trade-off 4% (CI: 22.4% to 8.6%) and 8% (CI: 20.6% to 16.7%), respectively (Table 5).
DCE rationality
The dominant choice set was answered correctly by 490/500 (98%) of the respondents; 83 respondents completed the ranking test incorrectly (e.g. giving the same rank to multiple attributes) and were excluded from this ranking analyses. The most important attributes according to the ranking test were: the degree of protection (70%); the duration of protection (17%); the risk of mild side-effects (8%); the number of doses (4%); and the age of vaccination (2%) (n = 407). The trade-offs respondents were willing to make between the degree of protection and the other attributes indicated the following order of importance of attributes: duration of protection, followed by the risk of mild side-effects, the number of doses of the vaccine, and age at vaccination (Table 5). Thus, the ranking test supports the convergent validity of the DCE results.
The mean evaluations of the DCE questions were (range 1–5): ‘unclear-clear’ (M = 3.48, SD = 1.14), ‘difficult-easy’ (M = 3.53, SD = 1.14), ‘annoying-pleasant’ (M = 2.82, SD = 1.01), and ‘too many questions-not too many questions’ (M = 2.56, SD = 0.93).
Discussion
We used a DCE to determine girls’ preferences for HPV vaccination almost 3 years after the much debated start of the HPV vaccination program. Overall, girls were willing to trade-off 18% of the degree of protection to obtain a vaccination with 25 years protection instead of 8 years protection, and trade-off 7% to have a 10% less risk of mild side-effects. To receive 2 doses of the vaccine instead of 3 doses, they were willing to trade-off 4% of the degree of protection. Furthermore, it appeared that higher educated girls and HPV vaccinated girls have a higher probability to opt for HPV vaccination if it is offered at age 12 years instead of at age 9 years, than girls with lower education levels or girls who were not vaccinated.
risk of mild side-effects became less important: in 2011 girls were willing to trade off 7% of the degree of protection (CI: 3.2% to 10.8%) to obtain a 10% less risk of mild side-effects, while in 2009 they were willing to trade-off 18% (CI: 13.8% to 22.4%). Also, it became less important to obtain lifetime protection instead of 8 years (in 2011) or 6 years protection (in 2009), as this trade-off was no longer significant in 2011 (21%, CI:20.1% to 37.2%) whereas it was in 2009 (38%, CI 32.1% to 44.3%). Also, age of vaccination at 12 years instead of at 9 years was no longer significant in 2011 (2011: 4%, CI:22.4% to 8.6%; 2009: 7%, CI: 2.6% to 10.6%).
In summary, almost 3 years after initiation of the HPV vaccination campaign on the Netherlands, the risk of mild side-effects and age at vaccination seem to have become less important. Potentially, the girls had a better idea about which mild side-effects to expect and were less concerned about them. Also, the importance of the degree of protection may have gained value for the girls. The age of vaccination might be less of an issue in 2011 given the longer duration of protection, i.e. 8 years in 2011 compared with 6 years in 2009.
There was preference heterogeneity among the girls, i.e. higher educated girls and HPV vaccinated girls have a higher probability to opt for HPV vaccination if it is offered at age 12 years instead of at age 9 years, than girls with lower education levels or girls who were not vaccinated. Furthermore, the majority of girls (including higher educated girls and HPV vaccinated girls) also preferred
vaccination at age 14 years to vaccination at age 9 years. In other words, most girls did not prefer vaccination at the age of 9 years. Overall, girls were willing to trade-off 3.5% of the degree of protection to receive 2 doses instead of 3 doses, and most girls also preferred a 2-dose scheme to the current 3-dose scheme. Recently, the Netherlands National Institute for Public Health and the Environment decided that a 2-dose scheme will be introduced, because 2 doses are found to provide as much protection as 3 doses as long as the vaccination is given before girls turn 15 years of age [30,31]. Since we showed that girls preferred a 2-dose scheme, this new strategy may result in a higher vaccination uptake. We want to stress that this revised vaccination program needs to receive adequate publicity. Surprisingly, it seems that some girls preferred 25 years of protection to lifetime protection. The concept of ‘lifetime’ might be too vague for these young girls and they may be unable to correctly judge its value; a protection period of 25 years might be interpreted by them as a very long period and it may sound more ‘concrete’.
A strength of the present study is the large number of respondents (n = 500) and the high response rate (85%). A limitation might be that we did not include protection against genital warts as an attribute.
In conclusion, this study shows that, almost 3 years after the much debated start of the HPV vaccination program in the Netherlands, trade-offs that girls are willing to make have not Table 3.Characteristics of the study respondents (n = 500).
Characteristics
Mean (SD)
Age(years) 12.9 (0.96)
range 11–15
N (%)
Educational level
Low 145 (29.1)
Intermediate 164 (32.9)
High 189 (38.0)
Religion
None 338 (68.0)
Christian 124 (24.9)
Muslim 28 (5.6)
Other 7 (1.4)
Country of birth
The Netherlands 472 (99.0)
Country of birth of parents
Both parents in the Netherlands 385 (79.9)
One parent outside the Netherlands 42 (8.7)
Both parents outside the Netherlands 55 (11.4)
HPV vaccination
Invited to get vaccinated against HPV 311 (62.7)
HPV vaccinated 220 (70.7)
Intention if not yet invited:
Low 20 (10.9)
Neutral 31 (16.8)
High 133 (72.3)
changed substantially. The risk of mild side-effects and age at vaccination still influenced the girls’ preferences, but seem to have become less important. This study shows that there was preference heterogeneity among the girls, with higher educated girls and HPV vaccinated girls having a higher probability to opt for HPV vaccination at a higher age, than girls with lower education levels or girls who were not vaccinated. Also, since most of the girls
preferred vaccination at age 14 years to vaccination at age 9 years, we recommend not to lower the current target age of 12 years in national immunization program in countries such as the Nether-lands, Denmark, Sweden, Norway and United Kingdom. We also recommend to introduce a 2-dose scheme (instead of the current 3-dose scheme), because the girls are far from indifferent to the choice between 2 and 3-dose scheme.
Table 4.Respondents’ preferences for HPV vaccination based on a panel latent class model.
Latent Class 1 Latent Class 2 Latent Class 3
Attribute Coeff. Coeff. Coeff.
Risk of mild side-effects (per 10%) 20.49 *** 20.41 *** 20.30 ***
Degree of protection against cervical cancer (per 10%)
1.33 *** 0.40 *** 0.73 ***
Duration of protection:
8 years (reference) 20.50 20.81 20.89
25 years 0.84 *** 0.29 *** 20.19 ***
Lifetime 20.34 ** 0.52 *** 1.07 ***
Age at vaccination:
9 years (reference) 0.05 20.29 20.32
12 years 20.12 20.01 0.16 ***
14 years 0.07 0.30 *** 0.16 ***
Number of doses of the vaccine:
2 doses (reference) 0.14 0.10 0.08
3 doses 20.14 * 20.10 *** 20.08 **
Constant 24.39 *** 1.73 *** 24.98 ***
Class probability model
Constant 20.0851 0.3705 **
-Higher eduction 20.0007 ** 20.0005 *
-Vaccinated 20.0005 * 20.0005 *
-Class probability (%)
Average class probability 31.0 45.5 23.5
Model fits
Log-likelihood 24.545.47
Pseudo R-squared 0.481
Notes: (1) ***, **, * denotes significance at 1%, 5%, and 10%, respectively; (2) Effects coded variables used for protection duration, age at vaccination, and doses of the vaccine; (3) Coeff. = coefficient; (4) number of observations = 7,976.
doi:10.1371/journal.pone.0104772.t004
Table 5.Respondents’ trade-offs between degree of protection versus various aspects of a vaccination program as used in the present study.
Change in levels Willingness to trade degree of protection
% (CI)
Per 10% lessrisk of mild side-effects 6.7 (3.2 to 10.8)
Aprotection durationof 25 years instead of 8 years 17.8 (8.6 to 29.6)
A lifetimeprotectioninstead of 8 years 21.4 (20.1 to 37.2)
A vaccination atage12 years instead of 9 years 4.4 (22.4 to 8.6)
A vaccination atage14 years instead of 9 years 8.2 (20.6 to 16.7)
A vaccination program consisting of 2 instead of 3doses 3.5 (1.2 to 5.9)
Author Contributions
Conceived and designed the experiments: IJK MB EWBG RH JHR. Performed the experiments: RH. Analyzed the data: EWBG. Wrote the paper: RH. Supervised the execution of the study: IJK. Responsible for the
database design and data entry: EWBG RH. Contributed to the interpretation of the data: RH EWBG JHR MB HJK IJK. Revised the article critically and approved the final version to be published: RH EWBG JHR MB HJK IJK.
References
1. Bosch FX, Lorincz A, Munoz N, Meijer CJ, Shah KV (2002) The causal relation between human papillomavirus and cervical cancer. J Clin Pathol 55: 244–265. 2. Walboomers JM, Jacobs MV, Manos MM, Bosch FX, Kummer JA, et al. (1999) Human papillomavirus is a necessary cause of invasive cervical cancer worldwide. J Pathol 189: 12–19.
3. Munoz N, Bosch FX, Castellsague X, Diaz M, de Sanjose S, et al. (2004) Against which human papillomavirus types shall we vaccinate and screen? The international perspective. Int J Cancer 111: 278–285.
4. Koutsky LA, Holmes KK, Critchlow CW, Stevens CE, Paavonen J, et al. (1992) A cohort study of the risk of cervical intraepithelial neoplasia grade 2 or 3 in relation to papillomavirus infection. N Engl J Med 327: 1272–1278. 5. Winer RL, Lee SK, Hughes JP, Adam DE, Kiviat NB, et al. (2003) Genital
human papillomavirus infection: incidence and risk factors in a cohort of female university students. Am J Epidemiol 157: 218–226.
6. Woodman CB, Collins S, Winter H, Bailey A, Ellis J, et al. (2001) Natural history of cervical human papillomavirus infection in young women: a longitudinal cohort study. Lancet 357: 1831–1836.
7. Phillips KA, Van Bebber S, Marshall D, Walsh J, Thabane L (2006) A review of studies examining stated preferences for cancer screening. Prev Chronic Dis 3: A75.
8. de Bekker-Grob EW, Ryan M, Gerard K (2012) Discrete choice experiments in health economics: a review of the literature. Health Econ 21: 145–172. 9. Ryan M (2004) Discrete choice experiments in health care. Bmj 328: 360–361. 10. Hensher DA, Rose JM, Greene WH (2005) Applied choice analysis: a primer.
Cambridge: Cambridge University Press.
11. Brown DS, Johnson FR, Poulos C, Messonnier ML (2010) Mothers’ preferences and willingness to pay for vaccinating daughters against human papillomavirus. Vaccine 28: 1702–1708.
12. Oteng B, Marra F, Lynd LD, Ogilvie G, Patrick D, et al. (2011) Evaluating societal preferences for human papillomavirus vaccine and cervical smear test screening programme. Sex Transm Infect 87: 52–57.
13. de Bekker-Grob EW, Hofman R, Donkers B, van Ballegooijen M, Helmerhorst TJ, et al. (2010) Girls’ preferences for HPV vaccination: A discrete choice experiment. Vaccine 28: 6692–6697.
14. van Lier EA, Oomen PJ, Giesbers H, Drijfhout IH, de Hoogh PAAM, et al. (2011) Immunization coverage National Immunization Programme in the Netherlands: Year of report 2011 [Vaccinatiegraad Rijksvaccinatieprogramma Nederland: Verslagjaar 2011]. Bilthoven: RIVM.
15. Zwakhals S, van Lier E, Giesbers H (2012) HPV (cohort 1998, interim score three vaccinations) by municipality 2012 [HPV (cohort 1998, tussenstand drie vaccinaties) per gemeente 2012]. Bilthoven: RIVM.
16. Centers for Disease Control and Prevention (2013) What are the risks from this vaccine? Atlanta: Centers-for-Disease-Control-and-Prevention.
17. Kreimer AR, Rodriguez AC, Hildesheim A, Herrero R, Porras C, et al. (2011) Proof-of-principle evaluation of the efficacy of fewer than three doses of a bivalent HPV16/18 vaccine. J Natl Cancer Inst 103: 1444–1451.
18. Serrano B, Alemany L, Tous S, Bruni L, Clifford GM, et al. (2012) Potential impact of a nine-valent vaccine in human papillomavirus related cervical disease. Infect Agent Cancer 7: 38.
19. Roteli-Martins CM, Naud P, De Borba P, Teixeira JC, De Carvalho NS, et al. (2012) Sustained immunogenicity and efficacy of the HPV-16/18 AS04-adjuvanted vaccine: up to 8.4 years of follow-up. Hum Vaccin Immunother 8: 390–397.
20. Centers for Disease Control and Prevention (2014) Possible Side-effects from Vaccines. Atlanta.
21. Reed Johnson F, Lancsar E, Marshall D, Kilambi V, Muhlbacher A, et al. (2013) Constructing experimental designs for discrete-choice experiments: report of the ISPOR Conjoint Analysis Experimental Design Good Research Practices Task Force. Value Health 16: 3–13.
22. Lancsar E, Louviere J (2008) Conducting discrete choice experiments to inform healthcare decision making: a user’s guide. Pharmacoeconomics 26: 661–677. 23. Herbild L, Bech M, Gyrd-Hansen D (2009) Estimating the Danish populations’
preferences for pharmacogenetic testing using a discrete choice experiment. The case of treating depression. Value Health 12: 560–567.
24. Bishop AJ, Marteau TM, Armstrong D, Chitty LS, Longworth L, et al. (2004) Women and health care professionals’ preferences for Down’s Syndrome screening tests: a conjoint analysis study. Bjog 111: 775–779.
25. Swait J (1994) A structural equation model of latent segmentation and product choice for cross-sectional revealed preference choice data. Journal of Retailing and Consumer Services 1: 77–89.
26. de Bekker-Grob EW, Rose JM, Donkers B, Essink-Bot ML, Bangma CH, et al. (2013) Men’s preferences for prostate cancer screening: a discrete choice experiment. Br J Cancer 108: 533–541.
27. Lancsar E, Louviere J (2006) Deleting ‘irrational’ responses from discrete choice experiments: a case of investigating or imposing preferences? Health Econ 15: 797–811.
28. Ryan M, Watson V, Entwistle V (2009) Rationalising the ‘irrational’: a think aloud study of discrete choice experiment responses. Health Econ 18: 321–336. 29. Hole AR (2007) A comparison of approaches to estimating confidence intervals
for willingness to pay measures. Health Economics 16: 827–840.
30. RIVM (2014) Voortaan 1 prik minder tegen baarmoederhalskanker. http://www. rivm.nl/Documenten_en_publicaties/Algemeen_Actueel/Nieuwsberichten/ 2014/Voortaan_1_prik_minder_tegen_baarmoederhalskanker. Bilthoven: RIVM.