Diagnóstico e prognóstico dos tumores pulmonares neuroendócrinos mediante microscopia eletrônica e análise multivariavel de agrupamento
Cecília Aparecida Vaiano Farhat1, Edwin Roger Parra2, Andrew V. Rogers3,
Silvia Nagib Elian4, Mary N. Sheppard3, Vera Luiza Capelozzi5
Abstract
Objective: To establish reproducible electron microscopic criteria for identifying the four major types of neuroendocrine tumors of the lung: carcinoid; atypical carcinoid; large cell neuroendocrine carcinoma; and small cell carcinoma. Methods: Measurements were made on electron micrographs using a digital image analyzer. Sixteen morphometric variables related to tumor cell differentiation were assessed in 27 tumors. The examination under electron microscopy revealed that all of the tumors could be classified as belonging to one of the four categories listed above. Cluster analysis of the morphometry variables was used to group the tumors into three clusters, and Kaplan-Meier survival function curves were employed in order to draw correlations between each cluster and survival. Results: All three clusters of neuroendocrine carcinomas were found to be associated with survival curves, demonstrating the prognostic significance of electron microscopic features. The tumors fell into three well-defined clusters, which represent the spectrum of neuroendocrine differentiation: typical carcinoid (cluster 1); atypical carcinoid and large cell neuroendocrine carcinoma (cluster 2); and small cell carcinoma (cluster 3). Cluster 2 represents an interme-diate step in neuroendocrine carcinogenesis, between typical carcinoid tumors and small cell carcinomas. Conclusions: Our findings confirm that electron microscopy is useful in making the diagnosis and prognosis in cases of lung tumor.
Keywords: Neuroendocrine tumors/lung; Microscopy, electron; Cluster analysis; Survival analysis.
Resumo
Objetivo: Estabelecer, com ajuda do microscópio eletrônico, critérios que possibilitem uma diferenciação mais exata entre os quatro tipos maiores de tumores neuroendócrinos pulmonares: tumor carcinóide típico e atípico, carcinoma de grandes células neuroendócrino e carcinoma de pequenas células. Métodos: Todos os tumores foram avaliados morfometricamente e 16 variáveis foram relacionadas com diferenciação das células tumorais; estas variáveis foram analisadas sob microscopia eletrônica com ajuda de um analisador de imagem digital em 27 tumores. A avaliação através da microscopia eletrônica revelou que todos os tumors investigados podiam ser classificados a um dos quarto tipos listados acima. A análise das variáveis morfométricas foi usada para agrupar os tumores em três grandes grupos, os quais foram relacionados à sobrevivência pelas curvas de Kaplan Meier. Resultados: Os três grupos de carcinoma neuroendócrino associaram-se às curvas da sobrevivência, as quais mostraram características ultrastruturais na microscopia eletrônica de significância prognóstica distinta. Os tumores foram contidos em três grupos bem definidos, que representam o espectro da diferenciação neuroendócrina: tumor carcinóide (grupo 1); tumor carcinóide atípico e carcinoma de grandes células neuroendócrino (grupo 2); e carcinoma de pequenas células (grupo 3). O grupo 2 representa um espectro intermediário na carcinogênese neuroendócrina, entre o carcinóide típico e o carcinoma de pequenas células. Conclusões: Nossos achados confirmam que a microscopia eletrônica é uma ferramenta útil no diagnóstico e prognóstico dos casos de tumores pulmonares.
Descritores: Tumores neuroendócrinos/pulmão; Microscopia eletrônica; Análise por aglomerados; Análise de sobrevida.
* Study carried out at the University of São Paulo School of Medicine, São Paulo, Brazil. 1. Professor at the Pontifical Catholic University of São Paulo, São Paulo, Brazil.
2. Postdoctoral student at the University of São Paulo School of Medicine, São Paulo, Brazil. 3. Professor in the Histopathology Department of the Royal Brompton Hospital, London, UK. 4. Professor of Mathematics and Statistics at the University of São Paulo, São Paulo, Brazil.
5. Associate Professor in the Pathology Department of the University of São Paulo School of Medicine, São Paulo, Brazil.
Correspondence to: Vera Luiza Capelozzi or Edwin Roger Parra. Departamento de Patologia Faculdade de Medicina da USP, Av. Dr. Arnaldo 455, Sala 1143, CEP 01246-903, São Paulo, SP, Brasil.
Tel 55 11 3061-7427. Fax 55 11 3064-2744. E-mail: [email protected]/[email protected]
Financial support: This study received financial support from the following Brazilian agencies: the Conselho Nacional de Desenvolvimento Científico e Tecnológico (CNPq, National Council for Scientific and Technological Development; grant no. 300430/95-7); the Fundação de Amparo à Pesquisa do Estado de São Paulo (FAPESP, Foundation for the Support of Research in the State of São Paulo; grant no. 2000/14336-0); Coordenação de Aperfeiçoamento de Pessoal de Nível Superior (CAPES, Coordination of the Advancement of Higher Education); and the Laboratórios de Investigação Médica (LIM, Laboratories for Medical Research) of the University of São Paulo School of Medicine Hospital das Clínicas.
Submitted 14 November 2007. Accepted, after review, 30 January 2008.
8 LCNECs; and 7 small cell lung carcinomas (SCLCs). From each tumor, electron micrographs of complete cell profiles were obtained in a random fashion at either ×2,500 or ×3,400. The photographs were digitized, after which cells, cell nuclei and granules were analyzed using the public domain software NIH Image on an Apple Macintosh computer. For each tumor type, approximately 50 cells were sampled.
The data were submitted to a 16-variable cluster analysis in order to determine, in a reproducible way, whether neuroendocrine tumors are classifiable from a statistical viewpoint, and if they are, how so. In this study, because of the differences in the mean and variance among the variables, we defined the distance between ith and jth elements in a stand-ardized form as follows:
D(i,j) = [(x1i − x1j)2 / s2
1 + (x2i − x2j )2 / s 2
2 + . . .
+ (x16i − x16j )2 / s2 16j ]
1/2
where S2 1, S
2 2 . . . S
2
16 are the estimated
vari-ances for X1, X2 . . . X16, respectively. The distances between pairs of clusters or between an individual and a cluster were determined using the Ward hier-archical linkage method.(20) In the Ward method,
clustering is carried out with the objective of mini-mizing the sum of square deviation (S) within a cluster, as described in the following equation:
S = ∑m j = 1∑
n
i = 1(xji − ×j)2
where × is the mean, m is the number of vari-ables, n is the number of individuals in the cluster, xji is the measurement of the jth variable in the ith individual, ×j is the mean of the jth variable. If we calculate ∆Spq, the increase in S when two clusters (p and q) are fused is as follows:
∆Spq = Sp+q − Sp − Sq = ∑m j = 1{∑
n j = 1(xji(
p+q) − ×
j
-(p+q))2 - ∑np i = 1(xji(
p)- ×
j-(
p))2 − ∑nq i = 1(xji(
q) − ×
j-( q))2}
where ×j-(p+q), ×
j-( p) and ×
j-(
q) are the mean values of
the jth variable in clusters p + q, p and q, respec-tively. The above expression can be simplified as follows:
∆Spq = npnq / (np + nq) ∑m j = 1(xj
-(p) − ×
j
-(q))2 =
npnq / (np + nq) D2(p,q)
Thus, in the Ward method, a cluster is formed so as to group pairs of individuals or clusters having the minimum value of ∆S.
Introduction
Neuroendocrine tumors of the lung can be regarded as a distinct subset of tumors since they share certain morphological, ultrastructural, immunohistochemical and molecular characteris-tics.(1-9) Their classification is very important, not
only because it provides the basis for patient treat-ment, but also because it provides a cornerstone for comparison of epidemiologic and biological studies, which are useful for understanding etiology.(10-13)
According to the World Health Organization (WHO) classification,(14) the major categories of
neuroen-docrine tumors include small cell carcinoma, large cell neuroendocrine carcinoma (LCNEC), typical carcinoid and atypical carcinoid. The WHO(14)
clas-sification is based on light microscopy. However, in practice, the differentiation among these tumors is typically made on the basis of electron microscopy findings, specifically the quantification and qualifi-cation of dense-core granules.(15-19)
We decided to carry out an ultrastructural study of the four types of neuroendocrine lung carci-nomas, using morphometry and multivariate cluster analysis to determine whether light microscopy findings correlate with electron microscopy findings in the classification of these tumors. If estab-lished, this would allow us to gain better insight into the morphological spectrum of neuroendocrine carcinomas.
Methods
Specimens were obtained by retrospective review of the medical and pathological records of 27 primary lung tumors with neuroendocrine features treated surgically between 1984 and 1992 at the Royal Brompton Hospital in London, England. The tissue available for study had been fixed in 10% buffered formalin, embedded in paraffin, sectioned and stained with hematoxylin-eosin. Ultrastructural studies were performed in all tumors. At the time of resection, random samples of tumor were diced, fixed in 2.5% buffered glutaraldehyde, embedded in Araldite and cut into thin sections that were then stained with uranyl acetate and lead citrate. Prior to the morphometric study, light microscopy was used to diagnose the degree of neoplastic differentiation according to the 2004 WHO criteria.(14) A total of
To evaluate the classification obtained through the hierarchical cluster analysis, a survival analysis was performed. For each cluster, we estimated the survival function S (t) = P (an individual survives longer than t). The Kaplan-Meier product-limit method,(21-23) which is appropriate for estimating
survival functions in small samples with censored observations, was employed. This method does not require any assumptions about the form of the function that is being estimated.
All analyses were performed using Statistical Package for the Social Sciences (SPSS Inc., Chicago, IL, USA).(24) The threshold for statistical significance
was set at α = 5%.
Results
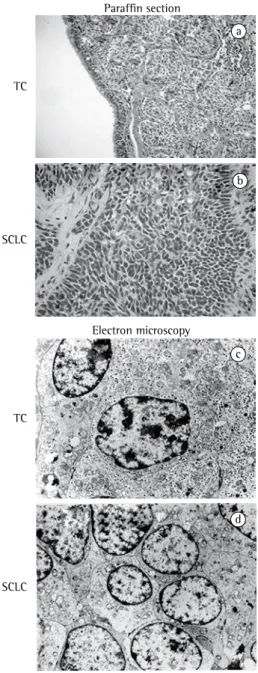
Ultrastructurally, in the typical carcinoid tumors, the nuclei showed chromatin condensation at the periphery, near the nuclear membrane. There were characteristically abundant, dense, membrane-bound granules, with considerable heterogeneity in size and configuration within the cell cyto-plasm (Figures 1a and 1c). In the atypical carcinoid tumors, the nuclei were regularly contoured and showed some peripheral chromatin condensation; prominent nucleoli were rare. The cytoplasm was abundant with cytoplasmic processes. There were moderate numbers of dense-core granules, which were diffusely distributed throughout the cytoplasm, with a tendency to concentrate in the cytoplasmic processes. The granules were heterogeneous in size, shape and electron-density (Figures 2a and 2c). In the LCNECs, the nuclear chromatin tended to be coarsely electron-dense, and the nucleoli were quite prominent. Small numbers of dense-core gran-ules, varying greatly in shape and size, were noted within the cytoplasm or in the cytoplasmic proc-esses (Figures 2b and 2d). In the SCLCs, there was a high nucleus/cytoplasm ratio, with little cytoplasm, the nucleus showed finely granular chromatin, and there were no prominent nucleoli (Figures 1b and 1d). Dense-core granules were few in number and located primarily in cell processes.
After morphometry, the features of the cells were represented by 16 variables, as listed in Table 1.
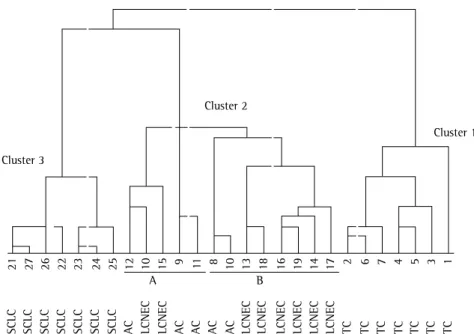
Figure 3 is a dendrogram obtained for the 16 variables using cluster analysis. The 27 tumors were grouped into three clusters: cluster 1, composed exclusively of typical carcinoid tumors
Paraffin section
a
b
Electron microscopy
c
d TC
TC SCLC
SCLC
Figure 2 - Tumors microscopically diagnosed as a atypical carcinoid (AC) tumor and a large cell neuroendocrine carcinoma (LCNEC) prior to morphometry. The AC tumor included in cluster 2 (Panels a and c) showed mild to moderate nuclear atypia. The LCNEC included in cluster 2 (Panels b and d) showed nuclear atypia that was more severe than that observed in the tumor depicted in panels a and c. Note the granules (small arrows) distributed in the cytoplasmic processes (arrows) and more numerous in the AC tumor. (a and b, light microscopy: H&E ×200; c and d, electron microscopy: ×9000).
Paraffin section AC
a
Paraffin section LCNEC
b
Electron microscopy AC
c
Electron microscopy LCNEC
d
(n = 7); cluster 2, composed of atypical carci-noid tumors and LCNECs (n = 13); and cluster 3, composed exclusively of SCLCs (n = 7). Clusters 1 and 3 presented a deep cleavage with cluster 2, and the difference was highly significant. Clusters 1 and 3 were quite coherent, whereas cluster 2 exhibited subclusters. Cluster 2 presented close overlapping of the atypical carcinoid tumors and LCNECs. We therefore have an electron microscopy finding spec-trum ranging from pure typical carcinoid tumor to pure SCLC, whereas the atypical carcinoid tumors and LCNECs diagnosed under light microscopy fall into the overlapping cluster (cluster 2).
In Table 1, the descriptive values (mean and vari-ance [V]) are presented for each cluster. In cluster 3, the cell area (CA) and nuclear area (NA) were smaller (mean CA = 72.18, VCA = 272.91; mean NA= 24.38, V NA = 83.54), the mean nuclear length (NL) was 8.30 (VNL = 0.81), and there were few granules, the mean granule area (GA) being 9805 (VGA = 1.5 E+7). The granules were distributed primarily in the
cytoplasmic processes, which is characteristic of small cell carcinoma. In cluster 2, there was a combination of large cells and pleomorphic cells (mean CA = 243.50, VCA = 2601; mean cell length [CL] = 24.62, VCL = 83.90) with irregularly elongated nuclei and pleomorphic nuclei (mean NA = 49.66, VNA = 340.77), containing large granules and pleo-morphic granules (mean GA=23622, V GA =1.8 E+8), which are characteristic of atypical carcinoid tumors and large cell carcinomas. Cluster 1 showed smaller nuclei than did cluster 2, with more cytoplasm than in cluster 3 but less than in cluster 2. Cluster 1 also had more granules than did either of the other two clusters, which is characteristic of typical carcinoid tumors.
referred to, collectively, as nucleus and granule size factor
• y3 (the third component) coincides with gran-ules/cell (GC), referred to as granule density factor
• y4 (the fourth component) coincides with the variables granule area (GA) + (CL), referred to, together, as granule by cell length size factor
• y5 (the fifth component) coincides with the variables cell width/length ratio (CR) + cyto-plasm/nucleus ratio (CyR) + cell width (CW) + NR + GAx + GD, referred to, collectively, as nucleus by cytoplasm ratio factor
• y6 (the sixth component) coincides with the variables GA + total granules (TG), referred to, together, as cell by granule ratio factor In the 16-dimensional cluster analysis, one cannot visualize how the individual lesions are distributed in 16-dimensional space. Therefore, we introduce the canonical discriminant analysis (the Fisher discriminant analysis)(21) to visualize to what
degree the lesions overlap or form separate groups. This analysis also creates a set of linear discriminant equations from the given set of data so as to maxi-mize the difference between clusters. Thus, linear discriminant formulae d1, d2, and d3, respectively, are each expressed as a linear formula including the principal components y1, y2 . . . y6:
CA = 271.5, VCA = 5227.3) than those observed in subcluster B, which comprised 2 atypical carcinoid tumors and 6 LCNECs (mean CA = 226.01, VCA = 559, 19) and in which the pleomorphic nuclei were larger and more irregular (mean NA = 53.55, VNA = 491.06).
The validity and reproducibility of the results were determined in the following way. Initially, data related to the 16 variables for the 27 lesions were subjected to principal component analysis(21) creating
the 1st, 2nd . . . 6th principal components y1, y2 . . . y6. We found that, even if only the 1st through the 6th components were taken into consideration and the others were omitted, more than 92% of the total variations in the data would be saved.
Since the coefficients of the components y1, y2, y3, y4, y5, and y6 were, respectively, (0.8050; 0.8240; 0.9610; 0.8070), (0.6970; 0.6930; 0.7090),
(0.7630), (−0.6060; 0.7020), (−0.4930; 0.4890; 0.4800) and (−0.5280; 0.4450), they can be viewed
as follows:
• y1 (the first component) coincides with the variables CA + NA + granules/cytoplasm (GCy) + nuclear width (NW), referred to, collectively, as cell size factor
• y2 (the second component) coincides with the variables nuclear width/length ratio (NR) + granule axis (GAx) + granule diameter (GD),
Table 1 - Variable values in the three clusters.
Variable Cluster 1 Cluster 2 Cluster 3 Mean (variance) Mean (variance) Mean (variance) Cell area 108.0 (745.30) 243.50 (2601.0) 72.18 (272.91) Cell width/length ratio 1.63 (0.04) 2.45 (0.50) 1.02 (0.09) Cell length 14.60 (4.28) 24.62 (83.90) 8.18 (1.81) Nuclear area 33.36 (8.41) 49.66 (340.77) 24.38 (83.54) Nuclear length 7.43 (0.29) 14.65 (12.96) 8.30 (0.81) Granule area 12792 (2.4E+7) 23622 (1.8E+8) 9805 (1.5E+7) Granules/cytoplasm 0.90 (0.40) 0.60 (1.40) 0.10 (0.04) Cytoplasm/nucleus ratio 1.37 (0.02) 2.00 (0.56) 1.40 (0.03) Nuclear width 5.46 (0.13) 7.69 (2.29) 6.04 (1.43) Cell width 8.95 (0.65) 10.57 (10.10) 8.41 (4.21) Cytoplasmic area 71.82 (59.91) 103.23 (3083) 36.41 (116.47) Nuclear width/length ratio 0.47 (0.005) 0.58 (0.08) 0.74 (0.15) Granules/cell 0.87 (0.11) 0.52 (0.069) 0.042 (0.0001) Total granules 183.42 (3540) 31.54 (127.57) 5.40 (5.01) Granule axis (smallest diameter) 57.14 (151.53) 64.89 (297.05) 60.99 (106.05) Granule diameter (largest diameter) 115.94 (636.33) 132.56 (1738) 121.99 (424.19)
Discussion
Neuroendocrine tumors of the lung encompass a spectrum from low-grade (typical carcinoid tumors) to intermediate-grade (atypical carcinoid tumors) and high-grade (LCNECs and SCLCs). It was only recently that LCNEC was recognized as the fourth category of neuroendocrine tumors of the lung. In the present study, examination of 27 neuroendo-crine lung tumors under light microscopy resulted in their subclassification into these four major groups, which have been shown to have prognostic significance. The incidence of neuroendocrine tumors throughout the body is on the rise.(25) There
is controversy as to whether examination under light microscopy is the best means of distinguishing among the different types of neuroendocrine lung tumors, especially between LCNECs and SCLCs, as well as between LCNECs and undifferentiated carci-nomas.(26)
We applied techniques of morphometry and multivariate analysis to 16 electron microscopic parameters in the 27 neuroendocrine lung tumors evaluated, which resulted in the formation of three clusters, each with prognostic significance. This expands upon the work we have done previously
• d1 = −10.185 − 5.68 y1 + 5.30 y2 + 8.55 y3
− 1.17 y4 + 2.16 y5 + 0.0055 y6
• d2 = −5.331 + 7.77 y1 − 2.27 y2 − 2.06 y3 + 0.52 y4 + 2.41 y5 − 1.04 y6
• d3 = −10.462 − 8.75 y1 − 1.08 y2 − 4.71 y3 + 0.21 y4 − 6.64 y5 + 1.92 y6
Of the canonical variables obtained, the 1st and 2nd variables, d1 and d2, were calculated for each individual. These allow one to visualize in a two-dimensional d1, d2 scattergram to what degree the individuals are separated within a given cluster. Using these variables, a second discrimination test was performed for each of the 27 lesions.
The estimated survival curves are plotted in Figure 4. The median survival of patients with tumors belonging to cluster 2 was 48 months, which was much worse than that of those with tumors belonging to cluster 1 but better than that of those with tumors belonging to cluster 3. The log rank test provided strong evidence of a difference between the survival curves (p = 0.0001). Multiple compari-sons for the curves revealed significant differences among each pair of groups. Patients with SCLCs presented the shortest estimated survival, and those with typical carcinoid tumors presented the longest.
Figure 3 - Dendrogram obtained from the 27 lesions evaluated, here grouped into three clusters. Note that cluster 2 is composed of two subclusters, A and B. Shown along the lower margin are the diagnoses given to each prior to morphometry. SCLC: small cell lung carcinoma; AC: atypical carcinoid (tumor); LCNEC: large cell neuroendocrine carcinoma; and TC: typical carcinoid (tumor).
Cluster 3
Cluster 2
Cluster 1
A B
microscopy identified an overlap between atypical carcinoid tumors and LCNECs, which mirrors the overlap found under light microscopy.(29) The clinical
characteristics and optimal treatments for patients with LCNECs or atypical carcinoid tumors have yet to be well defined. The prognosis of LCNECs is believed to be poorer than is that of other non-small cell lung cancers.(30)
Further studies are needed in order to look more closely into the overlap between atypical carcinoid tumors and LCNECs, and further collaborative accu-mulation of clinicopathological data is required.
Acknowledgments
The authors are grateful to the staff of the University of São Paulo School of Medicine Scientific Documentation Service, as well as to the staff of the Department of Histopathology, Royal Brompton Hospital, for their assistance in conducting this study.
References
1. Gould VE, Linnoila RI, Memoli VA, Warren WH. Neuroendocrine components of the bronchopulmonary tract: hyperplasias, dysplasias, and neoplasms. Lab Invest. 1983;49(5):519-37.
2. Land H, Parada LF, Weinberg RA. Cellular oncogenes and multistep carcinogenesis. Science. 1983;222(4625):771-8. 3. Warren WH, Gould VE, Faber LP, Kittle CF, Memoli VA.
Neuroendocrine neoplasms of the bronchopulmonary tract. A classification of the spectrum of carcinoid to small cell carcinoma and intervening variants. J Thorac Cardiovasc Surg. 1985;89(6):819-25.
4. Saldiva PH, Capelozzi VL, Battlehner CN. Neuroendocrine tumors of the lung. Corrin B, editors. In: Pathology of lung tumors. New York: Churchill Livingstone, 1997. p. 55-69. 5. Travis WD, Linnoila RI, Tsokos MG, Hitchcock CL, Cutler GB
Jr, Nieman L, et al. Neuroendocrine tumors of the lung with proposed criteria for large-cell neuroendocrine carcinoma. An ultrastructural, immunohistochemical, and flow cytometric study of 35 cases. Am J Surg Pathol. 1991;15(6):529-53. 6. Gould VE, Linnoila RI, Memoli VA, Warren WH.
Neuroendocrine cells and neuroendocrine neoplasms of the lung. Pathol Annu. 1983;18(Pt 1):287-330.
7. Warren WH, Memoli VA, Gould VE. Immunohistochemical and ultrastructural analysis of bronchopulmonary neuroendocrine neoplasms. I. Carcinoids. Ultrastruct Pathol. 1984;6(1):15-27.
8. Warren WH, Memoli VA, Gould VE. Immunohistochemical and ultrastructural analysis of bronchopulmonary neuroendocrine neoplasms. II. Well-differentiated neuroendocrine carcinomas. Ultrastruct Pathol. 1984;7(2-3):185-99.
9. Warren WH, Memoli VA, Gould VE. Well differentiated and small cell neuroendocrine carcinomas of the lung. Two using light microscopy and confirms that electron
microscopic features are of prognostic significance in neuroendocrine lung tumors. We have previously shown the usefulness of electron microscopy in the diagnosis of LCNECs and SCLCs.(4,15-19) In the present
study, the tumors fell into three well-defined clus-ters that represent a spectrum of neuroendocrine differentiation within lung tumors as analyzed using electron microscopy. Cluster 2 presented a mixture of atypical carcinoid tumors and LCNECs, thus representing an intermediate range between typical carcinoid tumors and SCLCs. The electron micros-copy findings indicate that nuclear, cytoplasmic and granule features can clearly differentiate between typical carcinoid tumors and SCLCs but cannot differentiate between atypical carcinoid tumors and LCNECs in which there is overlapping of nuclear, cytoplasmic and granule features at the electron microscopic level. Nuclear features and mitoses seen at the light microscopic level remain the most important criteria in distinguishing among these four tumor types.(27)
Our findings confirm that electron microscopy is useful in the classification of lung tumors, as has been shown previously.(28) Our results also confirm
the morphological spectrum, at the light and elec-tron microscopic levels, within neuroendocrine tumors of the lung. We have demonstrated that using electron microscopy can have major prog-nostic significance. In the present study, electron
Figure 4 - Survival curves of patients stratified by cluster: cluster 1, consisting of typical carcinoid (TC) tumors; cluster 2, consisting of atypical carcinoid (AC) tumors and large cell neuroendocrine carcinomas (LCNECs); and cluster 3, consisting of small cell lung carcinomas (SCLCs).
1,2
1,0 TC - Cluster 1
AC/LC NEC - Cluster 2
SCLC - Cluster 3
0 20 40 60 80 100
0,8
0,6
0,4
0,2
0,0
Cumulativ
e surviv
al (propotion)
19. Carvalho HA, Saldiva PH, Takagaki TY, Capelozzi VL. Stereological estimates of the nuclear/cytoplasmic ratio and star volume on fibreoptic biopsies are of prognostic value for survival in a preliminary study of advanced squamous cell carcinoma of the lung. Histopathology. 1997;31(5):420-9. 20. Ward JH Jr. Hierarchical grouping to optimize an objective
function. J Am Stat Assoc 1963;58:236-44.
21. Johnson RA, Wichern DW, editors. Applied multivariate statistical analysis. Englewood Cliffs: Prentice Hall, 1992. 22. Kaplan EL, Meier P. Non-parametric estimation from
incomplete observations. J Am Stat Assoc 1958;53: 457-465.
23. Lee T, Wang JW. Statistical methods for survival data anaysis. New Jersey: John Wiley & Sons.
24. SPSS Base System. Sintax Reference Guide. Release 6.0. SPSS. In. Chicago, Illinois, 1993.
25. Taal BG, Visser O. Epidemiology of neuroendocrine tumours. Neuroendocrinology. 2004;80(Suppl 1):3-7.
26. Younossian AB, Bründler MA, Tötsch M. Feasibility of the new WHO classification of pulmonary neuroendocrine tumours. Swiss Med Wkly. 2002;132(37-38):535-40. 27. Beasley MB, Thunnissen FB, Brambilla E, Hasleton P, Steele
R, Hammar SP, et at. Pulmonary atypical carcinoid: predictors of survival in 106 cases. Hum Pathol. 2000;31(10):1255-65. 28. Herrera GA, Alexander CB, Jones JM. Ultrastructural
characterization of pulmonary neoplasms. I. The role of electron microscopy in characterization of the most common epithelial neoplasms. Surv Synth Pathol Res. 1984;3(6):520-46.
29. Herrera GA, Alexander CB, Jones JM. Ultrastructural characterization of pulmonary neoplasms. Surv Synth Pathol Res. 1984;3(6):520-46.
30. Takei H, Asamura H. Neuroendocrine tumors of the lung [Article in Japanese]. Nippon Rinsho. 2004;62(5):877-82. related but distinct clinicopathologic entities. Virchows Arch
B Cell Pathol Incl Mol Pathol. 1988;55(5):299-310. 10. Sheppard MN. Neuroendocrine differentiation in lung
tumours. Thorax. 1991;46(11):843-50.
11. Valli M, Fabris GA, Dewar A, Hornall D, Sheppard MN. Atypical carcinoid tumour of the lung: a study of 33 cases with prognostic features. Histopathology. 1994;24(4):363-9. 12. Arrigoni MG, Woolner LB, Bernatz PE. Atypical
carcinoid tumors of the lung. J Thorac Cardiovasc Surg. 1972;64(3):413-21.
13. Paladugu RR, Benfield JR, Pak HY, Ross RK, Teplitz RL. Bronchopulmonary Kulchitzky cell carcinomas. A new classification scheme for typical and atypical carcinoids. Cancer. 1985;55(6):1303-11.
14. Eble JN, Sauter G, Epstein JI, Sesterhenn IA, editors. World Health Organization Classification of Tumours. Pathology and Genetics of Tumours of the Urinary System and Male Genital Organs. IARC Press: Lyon, 2004.
15. Delmonte VC, Alberti O, Saldiva PH. Large cell carcinoma of the lung. Ultrastructural and immunohistochemical features. Chest. 1986;90(4):524-7.
16. Battlehner CN, Saldiva PH, Carvalho CR, Takagaki TY, Montes GS, Younes RN, et al. Nuclear/cytoplasmic ratio correlates strongly with survival in non-disseminated neuroendocrine carcinoma of the lung. Histopathology. 1993;22(1):31-4. 17. Capelozzi VL, Battlehner CN, Montes GS, Saldiva PH.
Volume fraction of dense-core granules correlates strongly with survival in disseminated (stage IV) neuroendocrine cell carcinomas of the lung of the well differentiated and small cell subtypes. Pathol Res Pract. 1993;189(10):1145-8. 18. Bernardi Fdel C, Capelozzi VL, Takagaki TY, Younes RN,