Contribution to the Chemoreception Capacity of Juvenile
Loggerhead Sea Turtles (Caretta caretta, L.)
Cláudia Sofia Pombo da Fonseca Moreira
Master Thesis
Funchal, 2010
This study would not have been possible without the precious help of some persons who in many ways gave me support and strength to continue. To these people I really want to express my sincerest gratitude.
I would like to thank to my supervisor Prof. Thomas Dellinger for the ideas, the support, the long hours of brainstorming (sometimes it was like a real storm in my brain ) and for his sympathy.
To all of the people in the Marine Biology Station who helped me with this work and for their constant sympathy. I would like to emphasize the indispensable help of Mr. Loreto Andrade and Mr. Filipe França in the construction of the experimental tank.
I would also thank the people of Madeira University for their help and support, especially to Renato Barradas for the support, motivation and friendship. To Ramon Vilardell Corral that helped me with the DMS solutions and also for his friendship.
To the voluntary Nico that helped me with cleaning of the tanks and feeding of the turtles.
To the Center of Science and Technology of Madeira (CITMA) for the scholarship that allowed me to do this Master.
I am very grateful to all of my friends for the patience and support, especially to Sandra Ferreira and Ruben Agrela
The last but not least, I would like to thank to my family for all of the support, especially to my brother Nuno, my sister-in-law Susana, to my grandfather Manuel and to my little nephew Joãozinho
i
ABSTRACT
Loggerhead sea turtle juveniles (Caretta caretta), pelagic stage, are found in waters of Madeira archipelago. Pelagic turtles are in the main growth phase of their life cycle and consequently higher energy needs. However, knowledge about the ecology of pelagic loggerhead sea turtles is still quite rudimentary, mainly about the mechanisms that lead them to find food in the vast ocean.
Studies with other pelagic species, such as procellariiform birds, revealed that the olfactory system play an important role for the detection of feeding areas, through the detection of concentration peaks of DMS (dimethylsulfide), a scent compound that naturally exists in the marine environment and it is related to areas of high productivity. Based on the assumption that loggerhead sea turtles use a similar mechanism, behavioural experiments were conducted in order to analyze the chemoreception capacity to DMS (airborne chemoreception - theoretically responsible for the long distance detection of areas with food patches; and aquatic chemoreception - theoretically responsible for the short distance detection of preys). The first step was to observe if pelagic loggerheads demonstrate sensitivity to DMS and the second was to verify if they really use the DMS, in natural conditions, as an airborne cue to find areas where food patches might be available.
Four juveniles of loggerhead sea turtles were tested in captivity and three wild turtles in the open ocean. The results of airborne chemoreception experiments in captivity revealed that one turtle clearly demonstrated sensitivity to DMS and the sea experiments confirmed this result. However, the experiments were not conclusive on the question whether the pelagic turtles actually use the DMS as an airborne cue to detect long distance food patches. In aquatic chemoreception experiments was not observed sensitivity to DMS by the three sea turtles tested. In the classical conditioning experiment, where DMS and food were given nearly at the same time revealed that after a certain period of time, the sea turtle tested did not associated the DMS stimulus with a possible food reward.
ii turtles tested, the results showed that in 90% of the cases the sea turtles were extremely attracted by the underwater smell of this fish.
iii
RESUMO
Os juvenis da tartaruga marinha comum (Caretta caretta), na fase pelágica, são encontrados nas águas do arquipélago da Madeira. As tartarugas pelágicas encontram-se na principal faencontram-se de crescimento do encontram-seu ciclo de vida e conencontram-sequentemente de maiores necessidades energéticas. No entanto, os conhecimentos sobre a ecologia das tartarugas marinhas comuns pelágicas ainda são bastante rudimentares, nomeadamente o modo como elas encontram o alimento numa área tão vasta como o oceano.
Estudos efectuados com outras espécies pelágicas, nomeadamente com aves procelariformes, revelaram que o sistema olfactivo desempenha um importante papel na detecção de áreas alimentares, através da detecção de picos de DMS (dimetilsulfido), um composto aromático que existe naturalmente no ambiente marinho e que está relacionado com áreas de elevada produtividade. Partindo do pressuposto que as tartarugas marinhas comuns possuem e utilizam semelhante mecanismo, foram efectuadas experiências comportamentais de modo a avaliar a capacidade de quimiorecepção do DMS (quimiorecepção aérea - teoricamente responsável pela detecção a longa distância das áreas onde o alimento se encontra agregado; e quimiorecepção aquática – teoricamente responsável pela detecção do alimento a curta distância). O objectivo era por um lado averiguar se as tartarugas marinhas comuns possuíam sensibilidade ao DMS e por outro tentar compreender se realmente utilizam esta substância em condições naturais para a detecção de áreas onde o alimento possa estar disponível.
iv A principal causa de mortalidade das tartarugas marinhas comuns no arquipélago da Madeira é devida essencialmente à captura acidental (bycatch) pela pesca dirigida ao peixe-espada preto (Aphanopus carbo) em que é utilizado o palangre horizontal derivante. Um dos iscos utilizados nesta pesca é a cavala (Scomber japonicus). Foram efectuadas experiências de quimiorecepção aquática de modo a avaliar a atractividade que a cavala poderia ter para as tartarugas marinhas. Os resultados de 3 tartarugas testadas revelaram que em 90% dos casos as tartarugas marinhas eram bastante atraídas pelo odor (dissolvido na água) deste peixe.
v
INDEX
1. INTRODUCTION
1
1.1. Ecology of the Pelagic Stage of Loggerhead Sea Turtles
1
1.2. Orientation and Navigation in Sea Turtles
2
1.2.1. Chemoreception in Sea Turtles
2
1.2.1.1. Aquatic Chemoreception
2
1.2.1.2. Airborne Chemoreception
3
1.3. Dimethylsulfide
–
DMS (C
2H
6S)
–
the “smell of the sea”
4
1.3.1. DMS
–
an airborne olfactory cue used by pelagic species 5
1.3.1.1. Procellariiform Birds
5
1.3.1.2. Harbour seal (Phoca vitulina vitulina)
6
1.3.1.3. African Penguins (Spheniscus demersus)
7
1.4. Revision of the Sea Turtles Biology
8
1.4.1. Sea Turtles
–
Past and Present
8
1.4.2. Sea Turtles in the North Atlantic Ocean
11
1.4.3. Loggerhead Sea Turtle
–
Caretta caretta
11
1.4.3.1. Morphological Features
11
1.4.3.2. Distribution
12
1.4.3.3. Life Cycle
12
1.4.3.4. Diet
13
1.4.3.5. Current Status and Legal Protection
14
1.4.4. Main Threats
14
1.4.4.1. Actual Threats in Madeira waters
15
1.5. Objectives
16
2. MATERIAL AND METHODS
17
2.1. Sea Turtles used in the Captivity Experiments
17
2.2. Acclimation Period Before the Experiments
18
2.3. Diet in Captivity
18
2.4. Preliminary Experiments
19
vi
2.4.2.
Aquatic Chemoreception
19
2.5. Experiments
20
2.5.1. Airborne Chemoreception of DMS
20
2.5.1.1. DMS solutions
21
2.5.1.2. Trial tank
21
2.5.1.3. Experimental Protocol
22
2.5.2. Aquatic Chemoreception of DMS and CMJ
23
2.5.2.1. Substances
23
2.5.2.2. Trial Tank
24
2.5.2.3. Experimental Protocol
24
2.5.3. Classical Conditioning Experiments
24
2.5.3.1. Substances
25
2.5.3.2. Trial Tank
25
2.5.3.3. Experimental Protocol
25
2.5.4. Sea Experiments with DMS
25
2.5.4.1. Modified Sea Buoy
25
2.5.4.2. Protocol
26
2.6. Statistical Analysis
26
3. RESULTS
28
3.1.
Airborne Chemoreception of DMS
28
3.1.1. Testing Environmental Stimuli and Individual Preference
28
3.1.2. Testing if There was Reaction for the DMS stimuli
29
3.1.3. Behavioural responses
vs
. DMS concentration
30
3.2. Aquatic Chemoreception of DMS and CMJ
33
3.3. Classical Conditioning Experiments
34
3.4.
Sea Experiments with DMS
34
3.4.1. Sea Experiment 1 (8 August 2009)
36
3.4.2. Sea Experiment 2 (11 September 2009)
36
3.4.3. Sea Experiment 3 (29 September 2009)
37
4. DISCUSSION
38
vii
4.2. Aquatic Chemoreception
41
4.3.
Why do Juvenile Loggerhead Sea Turtles Occur Near Madeira?
45
5. FUTURE DIRECTIONS
46
6. BIBLIOGRAPHY
47
7. ANNEX I
–
EXPERIMENTS DATA
54
8. ANNEX II
–
EXAMPLE OF A DATA SHEET USED IN AIRBORNE
CHEMORECEPTION EXPERIMENTS
55
viii
FIGURE INDEX
Figure 1 –Juvenile Loggerhead Sea Turtle in waters of Madeira Archipelago. 1
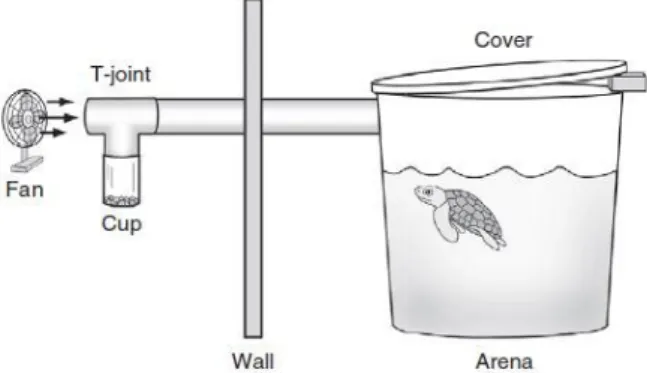
Figure 2 – Diagram of the experimental set-up (not to scale). The fan gently moved air through the PVC pipe, across the t-joint and opening of the cup, and into the arena where the turtle was tested. On the far side of the arena a small opening between the cover and the top of the arena permitted air to escape (Endres et al. 2009). 3
Figure 3 –Dimethylsulfide (DMS) emissions increase when phytoplankton are grazed by zooplankton. Its precursor dimethylsulfoniopropionate (DMSP) is a metabolite of phytoplankton, and an excretion product of zooplankton and other predators (Dacey and
Wakeham in Nevitt 2008). 4
Figure 4 - A theoretical olfactory landscape in the atmosphere reflects biological activity over a seamount. This is an area of upwelling where primary productivity tends to be high. A seabird may be alerted to a potentially productive foraging area as it encounters a change in the olfactory landscape. Elements are not drawn to scale (Nevitt 2000). 5
Figure 5 –Harbour seal (Phoca vitulina vitulina) - Tony Holm©/Azote©. 6
Figure 6 –African penguin (Spheniscus demersus) - Etienne Marais©. 7
Figure 7 – Holotype (IVPP V 15639) of Odontochelys semitestacea gen. et sp. nov.
Skeleton in dorsal view (Li et al. 2008). 8
Figure 8 –Holotype of Santanachelys gaffneyi, gen. et sp. nov. (THUg1386). The median length of the preserved carapace is 145 mm. Dorsal view (Hirayama 1998). 9
Figure 9 – Sea Turtles Taxonomy. Sea Turtles Loggerhead sea turtle illustration
(Márquez Millán 1990). 10
Figure 10 –Loggerhead Sea Turtle (FAO 2009). 11
Figure 11 - Loggerhead sea turtles (Caretta caretta) distribution (FAO 2009). 12
ix Figure 13 –Loggerhead sea turtle entangled in plastic - Martijn de Jonge©. 15
Figure 14 – Loggerhead sea turtle as bycatch victim of longline fisheries (left); Black-Scabbard Fish at Mercado dos Lavradores (Funchal). 15
Figure 15 – Loggerhead sea turtle entangled in lost / abandoned fishing gear -
TDellinger©. 16
Figure 16 –Madeira and Desertas islands – TDellinger©. 17
Figure 17– Chub Mackerel (Scomber japonicus). 18
Figure 18 – Experimental tank. 19
Figure 19 – Localization of the trial tank (3 meters diameter) in the Marine Biology Station
of Funchal (Google Earth® - 19/04/2010). 21
Figure 20 – Compartments numeration of the trial tank. Hypothetic positions of DMS evaporation bottle (blue spot) and Control evaporation bottle (orange). The colors are merely representative, the solutions were transparent. 22 Figure 21 – Plastic bottles used in the experiments. 23
Figure 22 – Modified Fishing Buoy. 26
Figure 23 – Cumulative time (observed and expected) spent by all of the sea turtles in
each compartment of the tank. 28
Figure 24 – Cumulative time spent by each turtle in each compartment of the tank. 29
Figure 25 – Cumulative time spent by all of the sea turtles in each compartment of the
tank. 30
Figure 26 - Cumulative time that each turtle spent in the different compartments of the
tank. 30
Figure 27 – Cumulative time spent by all of the sea turtles in each compartment of the
tank for the different DMS concentrations. 31
Figure 28 – Cumulative time spent by all of the sea turtles only in DMS compartment of
the tank for the different DMS concentrations. 31
Figure 29 – Cumulative time spent by T#1735 only in DMS compartment of the tank for
x Figure 30 – Cumulative time spent by T#1735 in DMS compartment of the tank in each experiment for the different DMS concentrations (R2 = 64,6%). 32
Figure 31– Analysis of aquatic chemoreception by loggerhead sea turtle juveniles (n = 3).
Two substances were used: DMS solution (67 mmol/L) and CMJ (“Chub Mackerel Juice”).
33
Figure 32 –Cory’s shearwater – TDellinger©. 34
Figure 33 -Bulwer’s petrel - Awei Lee© 34
Figure 34 – Common tern - Dave Provencher©. 35
Figure 35 - Yellow–legged gull – TDellinger©. 35
xi
TABLE INDEX
Table I –Sea Turtles Data (SCL – Straight Carapace Length). 18
Table II –DMS Solutions. 21
Table III –Sea Turtles reaction to CMJ and DMS dissolved in water. “0” – Lack of reaction
to the stimulus; “1” – Presence of reaction to the stimulus. 33 Table IV –Bird species sighted during the sea experiments. 35
1
1. INTRODUCTION
1.1. Ecology of the Pelagic Stage of Loggerhead Sea Turtles
Loggerheads spend most of their lives at sea, and most investigations have focuses on the brief terrestrial portion of the life cycle – egg laying, incubation, and hatchling (Plotkin et al. 1993). In fact, a significant proportion of a loggerheads life is spent as a pelagic turtle (Figure 1). It is a critical life history period where most growth occurs and, therefore, with higher energy needs (Dellinger and Freitas 2000) and the areas around Azores and Madeira archipelagos might prove to be the most important developmental habitat for North Atlantic loggerheads (Dellinger and Encarnação 2000).
Figure 1 – Juvenile Loggerhead Sea Turtle in waters of Madeira Archipelago.
Knowledge about the ecology of sea turtles in pelagic stage is still quite rudimentary, mainly due to logistical difficulties. It is unknown how these animals find their food in the vast ocean.
2
1.2. Orientation and Navigation in Sea Turtles
For logistical reasons, most studies on orientation mechanisms in sea turtles have focused on hatchlings rather than adults, because it is much easier manipulate hatchlings instead of adults that often exceed one hundred kilograms (Lohmann et al. 1997). In fact, there is a lack of knowledge about the mechanisms of orientation and navigation that enable juvenile and adult sea turtles to navigate to specific targets, such as feeding areas, or to complete long, seasonal migrations (Avens and Lohmann 2004).
The vast stretches of oceans are almost featureless and migrating animals, such as sea turtles, probably have not only one but a multiple cue-based orientation system (Rozhok 2008). This system could include magnetic, hydrodynamic (wave direction and ocean currents), celestial or chemical cues (reviewed by Lohmann et al. 2008).
1.2.1. Chemoreception in Sea Turtles
In tetrapods, chemoreception is accomplished by olfaction, vomerolfaction (chemical detection using the vomeronasal organ), or gustation (Southwood et al. 2008).
Based in anatomical studies, loggerhead sea turtles present well developed olfactory and vomeronasal organs. The vomeronasal epithelium seems to play an important role in aquatic chemoreception and the olfactory epithelium is related to the airborne chemoreception (Saito et al. 2000).
Several studies were conducted in order to verify if sea turtles are able to detect chemical cues carried by water, air or both (Manton et al. 1972a; Manton et al. 1972b; Owens et al. 1986; Southwood et al. 2008; Endres et al. 2009).
1.2.1.1. Aquatic Chemoreception
A rhythmic “throat-pumping” behaviour was observed in loggerhead sea turtles, while underwater. Probably the turtles were passing water through the nostrils for olfaction (Walker 1959).
3 epithelium with a 0,35 M solution of ZnSO4 (zinc sulfate). After this treatment, the sea
turtles were unable to distinguish the chemical from the control, revealing that they were using olfaction and not taste for chemoreception. These results present evidence to support the theory that soluble compounds in the ocean from the vicinity of nesting sites might be detectable by green turtles, and that this could assist in navigation (Manton et al. 1972a).
1.2.1.2. Airborne Chemoreception
Recently, was proven for the first time that loggerhead sea turtles can detect airborne odours, supporting the theory that airborne chemical cues might be involved in navigation and/or foraging. In this experiment were tested 8 loggerhead sea turtles, raised in captivity, with curved carapace length (CCL) between 25,3 cm and 31,6 cm (approximately 1,5 years). The behaviour of the turtles about the food odour was tested. For this purpose was used an experimental set-up (Figure 2). Gel food was placed in a cup and the odour carried by a fan through the PVC pipe to the tank where the turtle were being tested. As a control a cup with distilled water was placed, instead of gel food. Experiments in which the cup contained the gel food has been detected an increase in turtles activity (measured by the number of transversals by the turtles in the tank during the trials) after they surfaced to breathe. In control experiments no significant differences were detected for an increase in activity. Although, the way in which this ability is used under natural conditions is unknown. A fascinating possibility is the possible presence of certain substances (airborne odours) that can function as a signal of feeding areas. One of these substances that might play an important role in detection of oceanic food patches is dimethylsulfide (DMS) (Endres et al. 2009).
4
1.3. Dimethylsulfide
–
DMS (C2H6S)
–
the “smell of the sea”
Dimethylsulfide (DMS) and its precursor molecule, dimethylsulfoniopropionate (DMSP) dominate the natural sulfur cycle in the marine environment. (Scarratt et al. 2007) and has been studied in global climate change area (Beardall et al. 2009).
DMS is an odour produced by phytoplankton that is associated with areas of high primary productivity where prey are likely to be found (Nevitt et al. 1995) and because of its volatile nature it is lost from the surface waters by ventilation to the atmosphere (Scarratt et al. 2007).
Local emissions of marine DMS can be predictable features in the environment, reflecting bathymetric features such as shelf breaks and seamounts (Berresheim 1987). Furthermore, the rate of DMS emissions have been shown to greatly increase when the phytoplankton are subject to grazing by zooplankton (Dacey and Wakeham 1986) – Figure 3.
5
1.3.1. DMS - an airborne olfactory cue used by pelagic species
1.3.1.1. Procellariiform birds
The tube-nosed seabirds (order: Procellariiformes) are recognized for their wide ranging pelagic lifestyle. These birds spend most of their lives in flight over the ocean, and are tied to land for merely a few months each year or every other year to breed and rear a single offspring (Nevitt 2008).
Most procellariiforms forage over immense areas of the ocean for patchily distributed prey, including various species of fish, squid and krill. These birds use changes in the olfactory landscape to identify potentially productive foraging opportunities as they fly over them (Figure 4) (Nevitt et al. 1995). Such changes in the olfactory landscape reflect bathymetric features, which tend to accumulate phytoplankton and therefore prey. Thus, areas where the phytoplankton are abundant (for example upwelling zones, seamounts and shelf breaks) tend to aggregate seabirds and other marine predators for foraging (Nevitt et al. 1995; Nevitt and Bonadonna 2005).
Figure 4 - A theoretical olfactory landscape in the atmosphere reflects biological activity over a seamount. This is an area of upwelling where primary productivity tends to be high. A seabird may be alerted to a potentially productive foraging area as it encounters a change in the olfactory landscape. Elements are not drawn to scale (Nevitt 2000).
6 to assist seabirds in foraging and navigation (Nevitt 2000). DMS is one of these natural scents and had special attention. In order to test this hypothesis several studies were conducted with procellariiforms, adults and chicks, which confirmed that these birds tend to be attracted not to prey scents per se, but rather to odours such as DMS that are released during feeding interactions (Nevitt et al. 1995; Nevitt 1999a; Nevitt 1999b; Nevitt 2000; Cunningham et al. 2003; Nevitt and Haberman 2003; Bonadonna et al. 2006)
.
1.3.1.2. Harbour seal (
Phoca vitulina vitulina
)
Pinnipeds are known to travel on direct routes and return regularly to particular feeding areas. Nevertheless, the environmental information seals use to perform this navigation is still unknown. Two harbour seals (Figure 5) were tested in order to verify their ability to smell DMS at concentrations typical for the marine environment (Kowalewsky et al. 2006).
Figure 5 – Harbour seal (Phoca vitulina vitulina) - Tony Holm®/Azote©.
7
1.3.1.3. African Penguins (
Spheniscus demersus
)
The African penguins (Figure 6) are listed as a “vulnerable” species (Birdlife International, 2004), breeding only on the coast and coastal islands of Namibia and South Africa (Shannon and Crawford 1999).
Penguins are close relatives of procellariiform birds and similar to procellariiform adults, chicks have a tube-nose (Kinksy 1960). Therefore, it seems plausible that the penguins also have a functional olfactory sense (Cunningham et al. 2008).
Figure 6 – African penguin (Spheniscus demersus) - Etienne Marais©.
8
1.4. Revision of the Sea Turtles Biology
1.4.1. Sea Turtles - Past and Present
The oldest fossil of a prehistoric turtle (Odontochelys semitestacea sp. nov) was found in China and lived about 220 million years ago (Figure 7). Phylogenetic analysis places the new species basal to all known turtles, fossil and extant. The marine deposits that yield the fossils indicate that this primitive turtle inhabited marginal areas of the sea or river deltas (Li et al. 2008).
The second oldest turtle fossil is Proganochelys found in Germany (Gaffney 1990) from the Late Triassic period
.
Figure 7 – Holotype (IVPP V 15639) of Odontochelys semitestacea gen. et sp. nov. Skeleton in dorsal view (Li et al. 2008).
9 Figure 8 – Holotype of Santanachelys gaffneyi, gen. et sp. nov. (THUg1386). The median length of the preserved carapace is 145 mm. Dorsal view (Hirayama 1998).
10 Figure 9 – Sea Turtles Taxonomy. Loggerhead sea turtle illustration (Márquez Millán 1990).
Kingdom Animalia Phylum Chordata Class Reptilia Order Testudines Suborder Cryptodira Superfamily Cheloniidea (Bauer, 1893)
Family
Cheloniidae (Oppel, 1811)
11
1.4.2. Sea Turtles in the North Atlantic Ocean
In North Atlantic Ocean occurred six of the seven species of sea turtles in the world (Brongersma 1982; Márquez Millán 1990; Dellinger 2008). In Portugal there are registers of five of them (Brongersma 1968; Oliveira et al. 2005; Dellinger 2008) but the most common species are loggerhead sea turtle (Caretta caretta) followed by leatherback sea turtle (Dermochelys coriacea) (Oliveira et al. 2005; Dellinger 2008).
1.4.3. Loggerhead Sea Turtle
–
Caretta caretta
1.4.3.1. Morphological Features
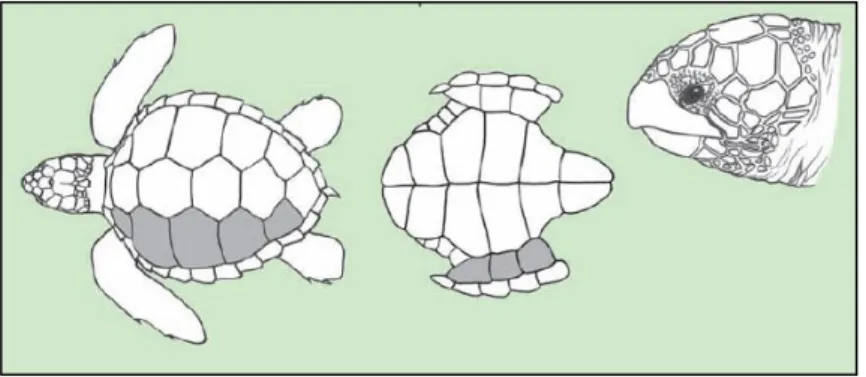
In loggerhead adults, the carapace in dorsal view is heart-shaped and its width corresponds to approximately 76 to 86% of its length (Márquez Millán 1990) (Figure 10).
The size of the sea turtles is commonly indicated as the straight carapace length (SCL -usually measured from the nuchal notch to the tip of the posterior marginal). In general, the loggerhead rookeries with the largest individuals are found in the Atlantic Ocean. The sizes of sea turtles are thought to be affected by genetics, energy consumption, food quality and abundance, and age (Kamezaki 2003). In general, the mean SCL of the mature females is between 81,5 and 105,3 cm (n = 3502), with a mean weight near to 75 Kg (65,7 to 101,4 Kg, n = 153). The carapace length (SCL) in nesting females varies within a limited size range, but always over 70 cm (Márquez Millán 1990).
Figure 10 – Loggerhead Sea Turtle (FAO 2009).
12 commonly 12 or 13 pairs of marginals, including the postcentral or pygal scute. Underneath the bridge of the plastron, there are 3 pairs of inframarginal scutes which rarely have pores. The fore flippers are relatively short and thick, each one, with 2 visible claws on the anterior margin. The rear flippers have 2 or 3 claws. Hatchlings and juvenile loggerhead sea turtles have blunt spines on the carapace scutes, forming 3 longitudinal keels that disappear during the juvenile stage (Márquez Millán 1990).
Loggerhead adults generally have a constant dorsal pattern, easily recognizable by the reddishbrown coloration, sometimes with dark streaks (South African turtles), that become orange-creamy on the flanks and yellow-creamy underneath. The hatchlings are darkbrown dorsally, with the flippers pale brown marginally and underneath, and the plastron usually is much paller (FAO 2009).
1.4.3.2. Distribution
The loggerhead sea turtle is widely distributed in coastal tropical and subtropical waters (16 - 20ºC) around the world (Figure 11). Commonly this species wanders into temperate waters and to the boundaries of warm currents (Márquez Millán 1990).
Figure 11 - Loggerhead sea turtles (Caretta caretta) distribution (FAO 2009).
1.4.3.3. Life Cycle
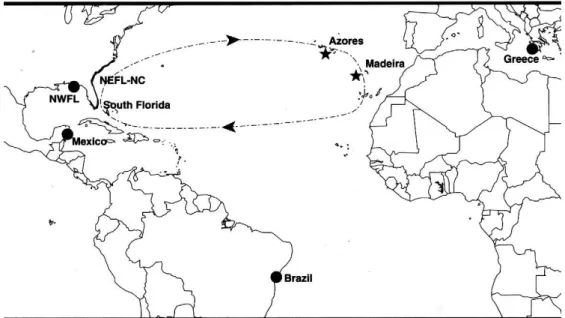
13 An analysis of mitochondrial (mt) DNA sequence comparing mtDNA haplotypes of pelagic juvenile loggerhead sea turtles (Caretta caretta) from Azores and Madeira supported the hypothesis proposed and estimated that 100 % of these pelagic juveniles are from the nesting populations in the southeastern United States and adjacent Yucatan Peninsula, Mexico (Bolten et al. 1998) – Figure 12.
Figure 12 – Map showing locations of sin nesting populations of loggerhead sea turtles: northeast Florida to North Carolina (NEFL-NC), south Florida, northwest Florida (NWFL), Mexico, Brazil and Greece. The two pelagic sampling sites (Azores and Madeira) are indicated with stars. Arrows show the North Atlantic gyre (Bolten et al. 1998).
Larger juvenile loggerheads return to their natal areas in the western Atlantic with an average size of approximately 50 cm SCL (46 - 64 cm SCL, or 6,5 – 11,5 years, as reported by (Bjorndal et al. 2000), where they enter a neritic juvenile stage before reaching maturity (Bolten 2003).
1.4.3.4. Diet
14 by loggerheads in the pelagic stage seems to be coelenterates and cephalopod mollusks (van Nierop and den Hartog 1984).
1.4.3.5. Current Status and Legal Protection
Loggerhead sea turtle (Caretta caretta) is classified as Endangered (EN) in the Red List of Threatened Species of International Union for Conservation of Nature (IUCN 2010). Listed on Appendix I of Convention on International Trade in Endangered Species of Wild Flora and Fauna (CITES) and Appendix I of the Convention of Migratory Species (CMS or Bonn Convention) that prohibits international trade from or to signatory countries.
Since 1979, loggerhead sea turtle is considered Strictly Protected by the Convention on the Conservation of European Wildlife and Natural Habitats (Bern Convention) in Appendix II.
Furthermore is listed in the Habitats Directive (more formally known as Council Directive 92 / 43 / EEC on the Conservation of Natural Habitats and of Wild Fauna and Flora) that aims to protect the wild plants, animals and habitats that make up our diverse natural environment (in Portugal lead to Decree-Law n.º 140 / 99 modified by the Decree-Law n.º 49 / 2005, with Caretta caretta in Appendix B-II and B-IV.
The Law n.º I 1 / 87, modified by the Law n.º 13 / 2002, refers specifically migratory species, a several regulamentory laws for the fishing activity, especially for those that execute fishing in Exclusive Economic Zones (EEZ) such as the Council Regulation (EC) n.º 1954 / 2003. Loggerhead sea turtle is also listed in the Red List of Vertebrates of Portugal of Nature Conservation Institute (ICN) (Oliveira et al. 2005).
The Regional Legislative Decree n.º 18 / 85 / M (7 of September) prohibits capture or intentional killing of turtles in EEZ of Madeira and any form of sea turtles trade.
1.4.4. Main Threats
15 circumstances results in a reduction of nesting beach habitat; loss of nests due to hurricanes; and heavy utilization of nesting beaches by humans (FAO 2009).
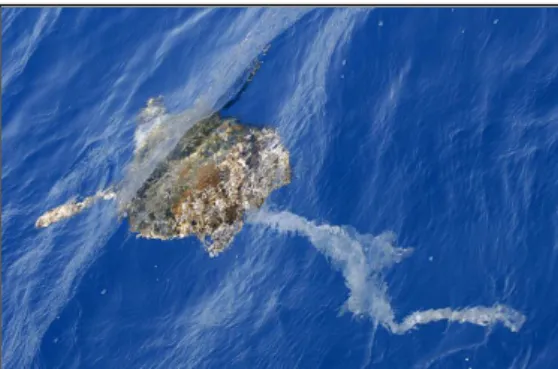
Loggerhead turtles face a number of threats in the pelagic waters of the eastern Atlantic. The same physical forces that tend to concentrate young turtles in convergence zones (the biologically active boundaries between currents and / or water masses) also concentrate floating debris (Figure 13), thus increasing the chance of ingestion or entanglement (Carr 1987). The major threat to the survival of these pelagic juveniles is the risk of incidental capture in commercial fisheries (Bolten 2003).
Figure 13 – Loggerhead sea turtle entangled in plastic - Martijn de Jonge©.
1.4.4.1. Actual Threats in Madeira waters
In Madeira archipelago, the deep pelagic longlines (set between 700 – 1300 m depth, around 15 Km long) targeting black-scabbard fish (Aphanopus carbo) had the greatest impact on sea turtles (Figure 14) compared to the other fishing methods. Based in Catch per Unit Effort (CPUE) values there is an estimation of slightly over 500 turtles are caught, each year, by this activity as bycatch (Dellinger and Encarnação 2000).
Furthermore, debris and lost / abandoned fishing gear (Figure 15) which has negatively impacts on sea turtles are commonly found in Madeira waters.
16 Figure 15 – Loggerhead sea turtle entangled in lost / abandoned fishing gear – TDellinger ©.
1.5. Objectives
This study is expected to contribute about:
(1) Chemoreception capacities (airborne and aquatic) of loggerhead sea turtle juveniles (Caretta caretta);
(2) Better understanding in the way how pelagic loggerheads detect food patches in the vast ocean;
17
2. MATERIAL AND METHODS
2.1. Sea Turtles used in Captivity Experiments
Four juvenile loggerhead sea turtles were collected between 2 and 4 nautical miles (NM) off Funchal on the southern coast of Madeira island (≈32º 40’ N 17º W) – Figure 16. Capture of turtles was most efficient on calm seas with bright sunlight, when turtles bask. They were approached by the boat at slow speed from behind, and caught by hand following the methodology described in Dellinger et al. (1997).
Turtles were kept in captivity for the experiments at the Marine Biology Station of Funchal during the period between July and December of 2009.
It was used the Body Condition Index (CI), that measures fitness and health, described in the equation below. Body Condition Index (Table I) relates the weight (Kg) of the sea turtles with their SCL(cm) as described in (Bjorndal and Bolten 2010).
18 Table I – Sea Turtles Data (SCL – Straight Carapace Length).
ID Name SCL (cm) Weight (Kg)
Condition
Index (CI) Rank
Capture Date
Release Date
1735 Maggie
Kutchi 21,3 1,536 1,59 2 11/07/2009 12/11/2009 1740 Selvagem 32,6 5,622 1,62 1 08/08/2009 12/11/2009
1742 Cracas 26,5 2,098 1,13 4 08/08/2009 13/12/2009
1744 Mancha 35,1 6,362 1,47 3 08/08/2009 12/11/2009
2.2. Acclimation Period Before the Experiments
In order to minimize stress to the sea turtles, the process of capture and transportation was conducted with maximal care. Once in the tanks, turtles had an acclimation period of 2 weeks before the experiments, serving the purpose to establish a captivity routine.
2.3. Diet in Captivity
Sea turtles were fed with chub mackerel (Scomber japonicus) – Figure 17, every other day. Prior to the experiments sea turtles were fasted for two days.
19
2.4. Preliminary Experiments
2.4.1. Airborne Chemoreception
Five different concentrations of DMS (35 mmol/L; 67 mmol/L; 135 mmol/L; 270 mmol/L and 539 mmol/L) were tested with two different experimental methodologies.
The tank used was a circular tank (3 meters diameter) divided equally in 4 compartments (Figure 18). The tank was filled with seawater until 45 cm height.
Figure 18 – Experimental tank.
The methodologies used are explained below:
1) On the top of a floating container was placed a moist ball of cotton with DMS solution and the container was positioned in one of the compartments of the tank. In the opposite compartment was placed a similar floating container, but the cotton was moist only with distilled water. All of the concentrations above were tested;
2) A tea ball infuser was suspended by a string in one of the compartments with a moist ball of cotton with DMS solution inside, about 5 cm from the water level of the tank. All of the concentrations above were tested.
2.4.2. Aquatic Chemoreception
20 The turtle was placed inside the PVC experimental tank (95 cm wide; 115 cm long; 55 cm high, filled with seawater to height of 45 cm). During the experiments, the water volume in the tank was approximately 492 L. The DMS concentration used in these experiments was always 67 mmol/L.
1) Ice prepared with DMS solution and ice made of only distilled water were made. These two types of ice were inserted, alternately, in a tea ball infuser and placed inside the tank. This procedure was conducted in order to promote a slowly diffusion of the DMS in the sea water;
2) CMJ (Chub Mackerel Juice) that was obtained by pressing chub mackerels including their viscera was used. This preparation was sieved through a spoon colander in order to obtain a homogeneous liquid mixture. A similar procedure in the previous experiment with DMS ice was carried out, but the DMS ice was prepared with a red food coloring (without flavour) in order to investigate if the visual attraction was responsible for any reaction by the sea turtles and also to observe the speed of DMS dispersion in the sea water of the tank;
3) In this procedure, it was used CMJ and instead of DMS ice (with red food coloring) was used the red liquid DMS solution.
2.5. Experiments
2.5.1. Airborne Chemoreception of DMS
In order to analyze if loggerhead sea turtle juveniles could detect DMS as an airborne odour, three different concentrations of DMS (67 mmol/L; 135 mmol/L and 270 mmol/L) and distilled water as control were used.
21 The experiments were conducted during the second fast day and at daylight hours. Each experimental trial consisted of up to three 20 minute experiments with short recesses in between to change the positions of the attractants. Subsequent experiments with the same animal started after an interval of at least 3 days, usually much longer.
2.5.1.1. DMS Solutions
DMS is insoluble in water. Due to this fact it was first pre-diluted in ethanol 70 % and then this solution was diluted in distilled water. The protocol to the preparation of the different DMS solutions is in the following table – Table II. It was used 200 mL of DMS solution and 200 mL of distilled water in each experiment.
Table II – DMS Solutions. DMS Concentration
(mmol/L) DMS 99 % Ethanol 70 % Distilled Water Total Volume
67 1 mL 4 mL 195 mL 200 mL
135 2 mL 8 mL 190 mL 200 mL
270 4 mL 16 mL 180 mL 200 mL
2.5.1.2. Trial Tank
The trial tank was a circular pool with 3 meter in diameter and 90 cm of depth. It was filled with seawater until 45 cm height and it was equally divided in four compartments as shown in Figure 19 and Figure 20. During the experiments, the numeration of the compartments was always the same.
22 Figure 20 – Compartments numeration of the trial tank. Hypothetic positions of DMS evaporation bottle (blue spot) and Control evaporation bottle (orange). The colors are merely representative, the solution were transparent.
2.5.1.3. Experimental Protocol
The four sea turtles were tested 3 times each for the 3 different concentrations of DMS, in a total of 36 experiments, using always simultaneously the distilled water as control. The turtle in test was placed inside the trial tank and an acclimation period was performed during 30 minutes before the experiment, in an attempt to avoid stress.
All the experiments were done in the second fast day in order to allow them to become more sensitive to the odours. Attractants as well as the distilled water were placed in plastic bottles (500 mL) which in turn were fixed at the centre of the compartment separator and were suspended by a strand about 2 cm from the water level of the tank.
Control evaporation bottles and attractant evaporation bottles were always placed in opposite compartments (Figure 20). Both evaporation bottles were filled with 200 mL of solution. The bottles also had several 3 mm wide holes to make them permeable to the dispersion of the scent through the air (Figure 21). The time that turtles remained in each of the 4 compartments of the tank was recorded during 20 minutes (example of a data sheet used in these experiments – see annex II).
1 2
3 4
Platform – observer place Sea
23 Figure 21 – Plastic bottles used in the experiments.
2.5.2. Aquatic Chemoreception of DMS and CMJ
These experiments were conducted in order to analyze if pelagic loggerheads could detect DMS in aquatic environment and also to analyze if they demonstrate any behaviour to chub mackerel odour underwater.
2.5.2.1. Substances
Two substances were used in this experiment: DMS solution at a concentration of 67 mmol/L
and chub mackerel “juice” (CMJ). There is no toxicological information available about the effect of high concentrations of DMS in reptiles, but for rats it can lead to toxic reactions [LD50 (Oral) – 535 mg/Kg]. As a precaution this value served as a reference.
As explained above, DMS is insoluble in water, so it was first pre-diluted in ethanol and this solution diluted in distilled water. One hundred milliliters of DMS solution (67 mmol/L) were used in each experiment.
24
2.5.2.2. Trial Tank
Turtles were tested in two experimental PVC tanks 95 cm wide and 115 cm long and 55 cm high, filled with seawater to height of 45 cm. During the experiments, the sea water volume in the tank was approximately 492 L.
2.5.2.3. Experimental Protocol
Three sea turtles were tested each one 3 times for each substance, in a total of 18 experiments. During experiment days, turtles were tested separately for the two substances: DMS (67 mmol/L) and CMJ. The animals were carefully transported to the trial PVC tank 30 minutes before the beginning of the experiment. This period, as mentioned before, had the main purpose to give them the required acclimation. The experiments were conducted during the second fast day and at daylight hours.
The presentation of both attractants was alternated to avoid habituation. The attractant solution was carefully introduced into the tank, avoiding observation by the turtle. During the following 5 minutes the animal reaction to the tested substance was recorded by behavioural observation. A positive reaction was scored when the turtles turned to the substance and opened and closed several times their mouth (trying to bite – behaviour observed when they were eating). Otherwise, if the turtle did not demonstrate any reaction at all, remained lying over the bottom of the tank and barely showed movements, the test was considered as “lack of reaction to the stimulus”.
When each experiment was completed, the turtle was moved to another tank containing clean fresh seawater. After another 30 minutes of acclimation, the turtle was tested again in the same way, using a different attractant.
2.5.3. Classical Conditioning Experiments
The aim of these experiments was to observe if juveniles of loggerhead sea turtles could associate the stimulus of DMS odour, dissolved in the sea water of the tank, with a possible food reward.
In a first period of the experiments, the DMS stimulus was always followed by a food reward (chub mackerel). In the second period of the experiments the DMS stimulus, dissolved in the
sea water of the tank, was presented without the food reward. In the “experimentalprotocol”
25
2.5.3.1. Substances
The substance tested in these experiments was DMS (35 mmol/L).
2.5.3.2. Trial Tank
The sea turtle was tested in a PVC tank 95 cm wide and 115 cm long and 55 cm high, filled with seawater to height of 30 cm.
2.5.3.3. Experimental Protocol
First Period of Experiments
Every day, for a period of 15 days, a DMS solution (35 mmol/L; 100 mL) was placed in the trial tank and approximately 1 minute later was given a small chub mackerel to the sea turtle. After this 15 days of DMS-Chub Mackerel stimulus the sea turtle was fasted for three days in order to make it more sensitive to aquatic odours.
Second Period of Experiments
In experiment days, a DMS solution (35 mmol/L; 100 mL) was placed in the trial tank and the behaviour of the sea turtle (if the turtle opened and closed several times the mouth - trying to bite – behaviour observed when sea turtle were eating) was recorded during the next 2 minutes. Only after 1 - 2 hours the experiment was concluded the turtle were fed with chub mackerel. In each experiment the sea turtle was fasted for 2 days. Eight experiments were conducted.
2.5.4. Sea Experiments with DMS
Three experiments were done at sea, in the south coast of Madeira Island, with wild free-ranging juvenile pelagic basking sea turtles. Sea turtles were spotted as described in Dellinger et al. (1997) and under the same weather and sea conditions, but, instead of capturing them, turtles were observed from a distance and all interactions of the turtle with the observed or boat was avoided. Experiments took place between August and September of 2009, with mostly calm seas and clear skies.
2.5.4.1. Modified Sea Buoy
26 Figure 22 – Modified Fishing Buoy.
2.5.4.2. Protocol
Once a basking sea turtle was sighted, the speed of the boat was reduced to its minimum in order not to disturb or awaken the animal. The buoy fitted with DMS was released at an estimated distance of 100 meters windward to the animal. Then the boat moved away from buoy and animal and assumed a position at the third tip of an equilateral triangle with the other tips formed by the turtle and the buoy.
The motor of the boat was turned out, except for short position readjustments. Behaviour and mainly orientation of the turtle were recorded using “ad libitum”- sampling (Martin and Bateson 1994).
Additionally, bird sightings in the area surrounding the buoy were recorded during the experimental period.
2.6. Statistical Analysis
28
3. RESULTS
3.1. Airborne Chemoreception of DMS
The main goal of these experiments was to determine if sea turtles could detect DMS solutions as an airborne scent, through the registration of the time that each turtle remain in the different compartments of the tank during the experiment period.
3.1.1. Testing Environmental Stimuli and Individual Preference
To analyze if DMS was the only stimulus that influences the behaviour of the sea turtles in study, it was necessary to verify if there were other stimuli that might influence the turtle’s position. To test for possible geostationary stimuli, such as the direction of the sound of the sea or magnetic stimuli, the preference of turtles for specific compartments was tested. It is important to mention again, that the position of the compartments of the tank was always the same during all experiments, only the DMS evaporation bottle and the Control evaporation bottle were rotated through each compartment.
The compartments that were closer to the sea were 3 and 4. Consequently, if turtles were attracted to the sound or smell of the sea, they should spend more time in these compartments instead of compartments 1 and 2. The analysis of the cumulative observed time spent by all of the sea turtles in each compartment, during each experiment, revealed no statistically significant differences (Kruskal-Wallis H = 2,959; df = 3; p = 0,398), although turtles spent slightly more time in compartment 3 (Figure 23).
Figure 23 – Cumulative time (observed and expected) spent by all of the sea turtles in each compartment of the tank.
0:00:00 0:20:00 0:40:00 1:00:00 1:20:00 1:40:00 2:00:00 2:20:00 2:40:00 3:00:00 3:20:00 3:40:00 4:00:00
1 2 3 4
Cu m u lativ e tim e ( h o u rs)
Compartments of the tank
Observed
29 However, when testing each turtle individually (Figure 24), only T#1735 did not divide equally its time between the 4 compartments (Kruskal-Wallis H = 11,276; df = 3; p = 0,010), showing a preference for compartment 3. The other 3 turtles used in the experiments did not revealed any statistically significant preference for a specific compartment.
Figure 24 – Cumulative time spent by each turtle in each compartment of the tank.
3.1.2. Testing if there was reaction for the DMS stimulus
Airborne scents are carried by the wind. Thus the empty compartments may not be equivalent for the turtles since the leeward compartment might have more attractant that the windward one. Since the prevalent wind direction comes from the sea, compartments 1 and 2 are Leeward and 3 and 4 windward.
An analysis of the cumulative time spent in each of the 4 compartments (DMS, Control and Empty Compartments) by all of the sea turtles in study indicate no statistically significant results (Kruskal-Wallis H = 2,444; df = 3; p = 0,485), but besides that it is possible to notice in Figure 25 that they spent more time in the Leeward – Empty Compartment, compared to the other three compartments.
00:00:00 00:10:00 00:20:00 00:30:00 00:40:00 00:50:00 01:00:00 01:10:00 01:20:00 01:30:00
T # 1735 T # 1740 T # 1742 T # 1744
30 Figure 25 – Cumulative time spent by all of the sea turtles in each compartment of the tank.
The analysis of the cumulative time spent by each turtle in each of the four compartments revealed no statistically significant differences by Kruskal-Wallis tests. Only turtle T#1744
showed a tendency for spending more time in the “Leeward - Empty Compartment”
(Kruskal-Wallis H = 5,605; df = 3; p = 0,132) – Figure 26.
Figure 26 - Cumulative time that each turtle spent in the different compartments of the tank.
3.1.3. Behavioural responses vs. DMS concentration
For the different concentrations of DMS used (67 mmol/L; 135 mmol/L and 270 mmol/L) there was no significant differences in the cumulative time spent in each of the 4 compartments (DMS, Control and the two Empty compartments), by all of the sea turtles –
00:00:00 00:20:00 00:40:00 01:00:00 01:20:00 01:40:00 02:00:00 02:20:00 02:40:00 03:00:00 03:20:00 03:40:00 04:00:00
Control DMS Leeward Empty Windward
Empty Cu m u lativ e tim e ( h o u rs)
Compartments of the tank
Observed Expected 0:00:00 0:10:00 0:20:00 0:30:00 0:40:00 0:50:00 1:00:00 1:10:00 1:20:00 1:30:00
T # 1735 T # 1740 T # 1742 T # 1744
Cu m u lativ e tim e in t h e c o m p ar tm e n ts (h o u rs) Turtles ID Control Compartment DMS Compartment
Leeward - Empty Compartment
31 Figure 27, though, for the 67 mmol/L DMS concentration the result of Kruskal-Wallis test was almost statistically significant (Kruskal-Wallis H = 7,652; df = 3; p = 0,054) for the Leeward – Empty Compartment.
Figure 27 – Cumulative time spent by all of the sea turtles in each compartment of the tank for the different DMS concentrations.
However, if only the cumulative time spent in the DMS compartment by all of the sea turtles are analyzed for the different concentrations (67 mmol/L; 135 mmol/L and 270 mmol/L) – Figure 28 – an obvious increase with the DMS concentration is observable, but not significant using a test for averages (Kruskal-Wallis H = 3,677; df = 2; p = 0,159).
Figure 28 – Cumulative time spent by all of the sea turtles only in DMS compartment of the tank for the different DMS concentrations.
0:00:00 0:20:00 0:40:00 1:00:00 1:20:00 1:40:00 2:00:00
67 mmol/L 135 mmol/L 270 mmol/L
Cu m u lativ e tim e in t h e c o m p ar tm e n ts (h o u rs) DMS concentration Control Compartment DMS Compartment
Leeward - Empty Compartment
Windward - Empty Compartment 00:00:00 00:10:00 00:20:00 00:30:00 00:40:00 00:50:00 01:00:00 01:10:00 01:20:00 01:30:00
67 mmol/L 135 mmol/L 270 mmol/L
32 In contrast, a regression confirmed this increase of the cumulative time per experiment spent in the DMS compartment and the DMS concentration (R2=15,7%, F = 6,330; df = 1; p = 0,017). Because only 15,7% of the variation in DMS residency - time is explained by the DMS concentration, each turtle was tested separately. Only T#1735 actually spent more cumulative time in DMS compartment with the increase of DMS concentration (Figures 29 and 30). This result is statistically almost significant for a test using averages (Kruskal-Wallis H = 5,422; df = 2; p = 0,066), but highly significant in a regression (R2 = 64.6%, F = 12,794; df = 1; p = 0,009). The other 3 turtles in study did not present any significant results in this analysis.
Figure 29 – Cumulative time spent by T#1735 only in DMS compartment of the tank for the different DMS concentrations.
Figure 30 – Cumulative time spent by T#1735 in DMS compartment of the tank in each experiment for the different DMS concentrations (R2 = 64,6%).
00:00:00 00:05:00 00:10:00 00:15:00 00:20:00 00:25:00 00:30:00 00:35:00 00:40:00
67 mmol/L 135 mmol/L 270 mmol/L
C u m u lat iv e t im e in DM S co m p ar tm e n t (h o u rs) DMS concentration observed expected
R² = 64,6%
0:00:00 0:02:00 0:04:00 0:06:00 0:08:00 0:10:00 0:12:00 0:14:00 0:16:00 0:18:00 0:20:00
0 50 100 150 200 250 300
Cu m u lati v e Ti m e in DMS co m p ar tm e n t (h o u rs)
33
3.2. Aquatic Chemoreception of DMS and CMJ
Nine experiments with DMS solution (67 mmol/L) diluted in the sea water of the tank were conducted and none of the 3 turtles in study demonstrated a positive reaction to this
substance. However, in the nine experiments using CMJ (“Chub Mackerel Juice”), as
attractant, the sea turtles had a positive reaction (2 = 5,444; df = 1; p = 0,020), as shown in the Figure 31 and in Table III. The maximum DMS dilution in the sea water of the tank reached appoximately 137 µmol/L.
Figure 31 – Analysis of aquatic chemoreception by loggerhead sea turtle juveniles (n = 3). Two substances were used: DMS solution (67 mmol/L) and CMJ (“Chub Mackerel Juice”).
Table III –Sea Turtles reaction to CMJ and DMS dissolved in water. “0” – Lack of reaction to the stimulus; “1” – Presence of reaction to the stimulus.
Turtle ID Substance Reaction Substance Reaction
T#1735
CMJ 1 DMS 0
CMJ 1 DMS 0
CMJ 1 DMS 0
T#1740
CMJ 1 DMS 0
CMJ 1 DMS 0
CMJ 1 DMS 0
T#1744 CMJ 1 DMS 0
CMJ 0 DMS 0
CMJ 1 DMS 0
0% 10% 20% 30% 40% 50% 60% 70% 80% 90% 100%
DMS (67 mmol/L) CMJ
R e ac tion to th e S tim u lu s Substances
34
3.3. Classical Conditioning Experiments
Eight experiments with DMS solution (35 mmol/L) diluted in the sea water of the tank were conducted and the sea turtle tested did not demonstrate any positive reaction to this substance, suggesting that this animal did not associated the DMS stimulus with a possible food reward.
3.4. Sea Experiments with DMS
At sea experiments with wild basking turtles showed that orientation towards the buoy fitted with DMS occurrence in all cases. Furthermore the buoy was overflown more frequently by seabirds (Figures 32 - 35 and Table IV), mainly foraging Procellariiforms
(Cory’s Shearwater and Bulwer’s Petrels).
Figure 32 –Cory’s shearwater – Tdellinger©.
35 Figure 34 –Common tern - Dave Provencher©.
Figure 35 - Yellow–legged gull – Tdellinger©.
Table IV – Bird species sighted during the sea experiments. Common Name
Species Name Procellariform
English Portuguese
Cory’s
shearwater Cagarra
Calonectris diomedea
borealis (Cory, 1881) Yes Bulwer’s
Petrel Alma-Negra
Bulweria bulwerii (Jardine
and Selby, 1828) Yes
Common tern Garajau Sterna hirundo (L., 1758) No
Yellow-legged Gull
Gaivota de Patas Amarelas
Larus cachinnans atlantis
36
3.4.1.
Sea Experiment 1 (8 August 2009)
The turtle was observed for over 1 hour, starting at 13h12 and finishing at 14h15. It woke up from its basking about 40 minutes after the onset of the observation, slowly turned to the buoy approaching it at a very slow speed using sinuous path regularly breathing with its head out of the water. It reached the buoy 10 minutes later and then increased the distance again to 5 meters.
After the first hour wind direction changed, the sea turtle began to move further away, and the observation was terminated.
During the observation time 27 sea birds overflew the experiment (Table V and Annex III) which appeared to be more than usually when sea turtles are captured and measured.
Table V – Number of bird sightings in sea experiments of each species.
Birds Quantity
Cory’s shearwater 15 Bulwer’s Petrel 10
Common tern 1
Yellow-legged Gull 1
3.4.2. Sea Experiment 2 (11 September 2009)
This experiment had 1 hour duration, starting at 12h35 and finish at 13h35. The turtle was basking and became active about 25 minutes later the experiment began. At this time, the turtle presented a similar behaviour observed in the first experiment. Thus, the turtle began to swim slowly to the buoy (not directly but with a sinuous path) and breathing with its head out of the water. Fifteen minutes later, approximately, the turtle was closer to the buoy, around 8 meters, were it remained for more or less 5 minutes. After this, the sea turtle began to move further away from the buoy and for the last 15 minutes of the experiment there was not another approaching.
During the experiment period 3 seabirds were sighted: 2 Cory’s shearwater and 1
37
3.4.3.
Sea Experiment 3 (29 September 2009)
This experiment lasted approximately 25 minutes, starting at 12h48 and finish at 13h12. The sea conditions were not the best to perform this experiment, due to this the DMS buoy was placed closer to the turtle than in the other two experiments, around 30 meters, instead of 100 meters.
The turtle turned to the buoy with DMS and began to approach, about 3 minutes later the experiment began. At that time the sea turtle was about 15 meters to the buoy and continued to swim in DMS buoy direction, with a sinuous path, and breathing with its head out of the water, a behavior observed in the two previous experiments. Approximately 3 minutes after, the sea turtle was around 8 meters from the buoy. However, the wind direction had changed and the sea turtle moved away. Due to the sea conditions, at 13h12 we lose sea turtle sight.
38
4. DISCUSSION
Olfactory-guided search strategies over distances of hundreds or thousands of kilometers has not been rigorously studied in most organisms. Green sea turtles (Chelonia mydas) nesting on Ascension Island, in the middle of the Atlantic Ocean, are guided there from feeding grounds off the coast of South America, presumably by a redundant set of mechanisms that possibly includes an ability to smell their island birth place (Lohmann and Lohmann 1996).
In order to explain such behaviours, it is generally assumed that animals are able to recognize and follow odours emanating from a distant source. This logic predicts that a recognizable odour signature emanates from a site, forming a gradient that can be detected thousands of kilometers away. By some adaptative behavioural mechanisms such as turning or swimming upstream in response to the odour cue, the animal focuses its directional movement to locate the source of the odour plume (Nevitt 2000).
Juvenile pelagic sea turtles inhabit the oceanic domain of the subtropical ocean basins of the world. In such areas the food is patchily distributed both in space and time. Thus turtles have to rely largely on sensory input to locate exploitable food resources. It is this thesis hypothesis, that chemosensory orientation is one of the main mechanisms for food location by sea turtles. Specifically it is hypothesized that turtles may detect DMS, a byproduct from zooplankton grazing on phytoplankton. This is the first time that sea turtles were tested for DMS chemoreception.
4.1. Airborne Chemoreception of DMS
39 odour attractant. Moreover, the sea experiments conducted in the present study, corroborate the sensitivity for DMS by pelagic loggerheads, because (1) in all of the three experiments with wild basking sea turtles they showed curiosity for the DMS buoy and (2) they approached the buoy not in a direct line but used a zig-zag upwind swimming with regular breathing episodes with their head and nostrils out of the water. This zig-zag upwind search behaviour was also verified in procellariiform birds, which also have a wide ranging pelagic lifestyle, (Nevitt et al. 1995) and use DMS as an airborne foraging cue to detect patchily food resources in the wide ocean (Nevitt et al. 1995; Nevitt 1999a; Nevitt 1999b; Nevitt 2000; Cunningham et al. 2003; Nevitt and Haberman 2003; Bonadonna et al. 2006). Similarly to procellariiform birds there are other pelagic animals that also use this scent compound as an airborne foraging cue, such as African penguins (Cunningham et al. 2008) and Harbour seals (Kowalewsky et al 2006). The main studies are summarized below:
- Blue petrel chicks (Halobaena caerulae), thin-billed prion chicks (Pachyptila belcheri) and common diving petrel chicks (Pelecanoides urinatrix) were exposed
to DMS concentrations of 1μmol/L through the vaporization of the nostrils
(Cunningham et al. 2003);
- Antarctic prions (Pachiptila desolata) were tested for DMS. Physiological experiments were conducted where the bird’s beak was positioned in a handblown glass ventilation tube. This tube provided the bird with a constant air stream (1500 ml s-1). A second continuous (10 ml s-1) air flux delivered DMS (10μm, but this concentration was diluted to a level of 3 - 4nm at the bird’s bill) or control stimulus via a system of bypasses. Behavioural experiments in order to determine whether individual prions would orient to DMS in a non-foraging context were carried out. For this purpose a Y-maze set up was used which had in one of the arm a Petri
dish containing either DMS (1μM, 4 mL) or control solution (Nevitt and Bonadonna
2005);
40 - Adult African penguins (Spheniscus demersus) were tested in wild and in captivity in order to investigate if they could detect DMS. The DMS concentrations used
were 1μmolar dissolved in 25 mL distilled water (Kowalewsky et al. 2006).
Though these experiments showed that one and thus probably all sea turtles can detect DMS, the fact remains that 3 turtles did not show any sign that DMS was attractive to them. The shear sensorial ability of sea turtles must not necessarily mean that this capacity is actually used during foraging, though knowledge of their ecology suggest that this is one of the most probable ways to find food. Conditions of captivity, with food being brought to them regularly, may demotivate turtles to use DMS as a cue. The number of pelagic loggerheads in study may also have been insufficient, though other publications in this area generally used low numbers of experimental animals (Kowalewsky et al. 2006; Endres et al. 2009). Why did only T#1735 reveal sensitivity for DMS? Turtle # 1735 differed from the other 3 experimental animals in that it was the smallest turtle and it had the longest time in captivity before the onset of the experiments (~1 month). Compensatory growth has been described for this turtle population (Bjorndal et al 2003), and being the smallest, might mean that it was more sensitive to environmental food cues. Its Body Condition Index (CI =1,59) was within the range of the other 3 turtles, meaning that it was not particularly meagre. Turtle # 1735 DMS sensitivity could of course be explained simply as a result of a high variation among individuals, which was observed in behavioural experiments by Grassman and Owens (1987).
In these experiments, evaporation bottles were used as DMS point sources. The concentrations of the evaporation solutions were chosen to be rather high, in order to counterbalance its volatile nature. Since no gas chromatographic (Scarratt et al. 2007) equipment was available, it was impossible to determine air concentrations of DMS over the tank and within each of the 4 compartments. In the natural environment DMS concentrations peaks of 8 x 10³ pmol DMS m-3 (air) were measured in productive areas in the North Atlantic (north of 40º N) and English Channel (north of 48º N) (Bürgermeister et al. 1990). Furthermore, naturally occurring DMS may have added sensorial noise to experiments in the present study. No data exist on the DMS concentration in the atmosphere around Madeira archipelago.