Adiposity with Circulating Biomarkers in Caucasian and
Japanese American Women
Unhee Lim1*, Stephen D. Turner2, Adrian A. Franke3, Robert V. Cooney4, Lynne R. Wilkens1, Thomas Ernst5, Cheryl L. Albright6,7, Rachel Novotny1, Linda Chang5, Laurence N. Kolonel1,
Suzanne P. Murphy1, Loı¨c Le Marchand1
1Epidemiology Program, University of Hawaii Cancer Center, Honolulu, Hawaii, United States of America,2Bioinformatics Core, University of Virginia School of Medicine, Charlottesville, Virginia, United States of America,3Cancer Biology Program, University of Hawaii Cancer Center, Honolulu, Hawaii, United States of America,4Office of Public Health Studies, John A Burns School of Medicine, University of Hawaii, Honolulu, Hawaii, United States of America,5Division of Neurology, John A Burns School of Medicine, University of Hawaii, Honolulu, Hawaii, United States of America,6Prevention and Control Program, University of Hawaii Cancer Center, Honolulu, Hawaii, United States of America,7School of Nursing, University of Hawaii, Honolulu, Hawaii, United States of America
Abstract
Background:Characterization of abdominal and intra-abdominal fat requires imaging, and thus is not feasible in large epidemiologic studies.
Objective: We investigated whether biomarkers may complement anthropometry (body mass index [BMI], waist circumference [WC], and waist-hip ratio [WHR]) in predicting the size of the body fat compartments by analyzing blood biomarkers, including adipocytokines, insulin resistance markers, sex steroid hormones, lipids, liver enzymes and gastro-neuropeptides.
Methods:Fasting levels of 58 blood markers were analyzed in 60 healthy, Caucasian or Japanese American postmenopausal women who underwent anthropometric measurements, dual energy X-ray absorptiometry (DXA), and abdominal magnetic resonance imaging. Total, abdominal, visceral and hepatic adiposity were predicted based on anthropometry and the biomarkers using Random Forest models.
Results:Total body fat was well predicted by anthropometry alone (R2= 0.85), by the 5 best predictors from the biomarker
model alone (leptin, leptin-adiponectin ratio [LAR], free estradiol, plasminogen activator inhibitor-1 [PAI1], alanine transaminase [ALT]; R2= 0.69), or by combining these 5 biomarkers with anthropometry (R2= 0.91). Abdominal adiposity (DXA trunk-to-periphery fat ratio) was better predicted by combining the two types of predictors (R2= 0.58) than by anthropometry alone (R2= 0.53) or the 5 best biomarkers alone (25(OH)-vitamin D3, insulin-like growth factor binding
protein-1 [IGFBP1], uric acid, soluble leptin receptor [sLEPR], Coenzyme Q10; R2= 0.35). Similarly, visceral fat was slightly better predicted by combining the predictors (R2= 0.68) than by anthropometry alone (R2= 0.65) or the 5 best biomarker predictors alone (leptin, C-reactive protein [CRP], LAR, lycopene, vitamin D3; R2= 0.58). Percent liver fat was predicted better
by the 5 best biomarker predictors (insulin, sex hormone binding globulin [SHBG], LAR, alpha-tocopherol, PAI1; R2= 0.42) or by combining the predictors (R2= 0.44) than by anthropometry alone (R2= 0.29).
Conclusion:The predictive ability of anthropometry for body fat distribution may be enhanced by measuring a small number of biomarkers. Studies to replicate these data in men and other ethnic groups are warranted.
Citation:Lim U, Turner SD, Franke AA, Cooney RV, Wilkens LR, et al. (2012) Predicting Total, Abdominal, Visceral and Hepatic Adiposity with Circulating Biomarkers in Caucasian and Japanese American Women. PLoS ONE 7(8): e43502. doi:10.1371/journal.pone.0043502
Editor:Konradin Metze, University of Campinas, Brazil
ReceivedMay 10, 2012;AcceptedJuly 24, 2012;PublishedAugust 17, 2012
Copyright:ß2012 Lim et al. This is an open-access article distributed under the terms of the Creative Commons Attribution License, which permits unrestricted use, distribution, and reproduction in any medium, provided the original author and source are credited.
Funding:Funding for this study was provided in part by the University of Hawaii Cancer Center (SPM, RN, LLM) and individual research funds (UL, LLM), as well as by the National Cancer Institute for the Multiethnic Cohort (R37 CA54281: LNK) and for the University of Hawaii Cancer Center’s Shared Resources (P30 CA71789), the National Institutes of Health for the University of Hawaii-Queen’s Medical Center MR Research Center (5P20-RR11091 and G12-RR003061: TE and LC), and the National Institutes of Health - National Center for Research Resources for the University of Hawaii Clinical Research Center (P20 RR11091). The funders had no role in study design, data collection and analysis, decision to publish, or preparation of the manuscript.
Competing Interests:The authors have declared that no competing interests exist.
* E-mail: ulim@cc.hawaii.edu
Introduction
Excess body fat leads to changes in a number of biological pathways. In particular, fat accumulation in the abdominal,
and using computed tomography (CT) or magnetic resonance imaging (MRI) scans for visceral and hepatic fat distribution, it is rarely feasible to utilize these costly imaging methods in large-scale population studies. Anthropometric measures, such as body mass index (BMI) and waist size (waist circumference [WC] or waist-hip ratio [WHR]), have been used as surrogates for total and abdominal adiposity: however, their correlations with fat mass vary by sex, ethnicity, life stages and other as yet-unknown factors [5,6], indicating the limitations of these proxies, particularly for heterogeneous populations when studying disease risks. Moreover, these anthropometric measurements are poorly correlated with fat compartments that carry the highest metabolic risk, such as visceral and hepatic fat [6,7]. In this regard, judiciously selected biomarkers assessed in peripheral blood may provide an attractive alternative to, or complement, anthropometry as predictors of body fat composition and distribution.
Few systematic attempts have been made to predict adiposity using a comprehensive array of biomarkers [8]. One major challenge is the limitation of conventional statistical methods to handle a large number of correlated predictors without over-fitting the data and leading to unreliable predictive ability [9]. The recent increase in computing capacity has allowed the development of statistical methods based on re-sampling to predict complex traits from large numbers of independent markers in a limited sample size, such as Random Forest modeling. In this report, we present a Random Forest analysis of commonly used anthropometric measures and circulating biochemical markers for the prediction of total and compartment-specific body fat content among healthy, Caucasian or Japanese American postmenopausal women. Our general objective was to determine the best predictive biomarkers for each body fat measure to complement the anthropometric indicators. We studied biochemical markers of inflammation, insulin resistance, sex steroid hormones, lipids, liver function, and gastro-neuropeptides, which have been associated with body fat distribution in past reports. Our findings demonstrate that measuring a small subset of these known biomarkers enhanced the prediction ability of simple anthropometric indicators for total and abdominal adiposity, but especially for visceral and hepatic adiposity in these two female populations.
Subjects and Methods
Study Subjects
As described previously [10,11], study subjects were recruited from a random sample (n = 218) of participants in the Multiethnic Cohort Study [12] who were female residents of Oahu, Hawaii, were 60–65 years of age as of September 2009, and had BMIs in the range of 18.5–40 kg/m2. All reported that both of their parents were either of Caucasian or Japanese ethnicity. Exclusion criteria included current smoking, use of selected medications (chemotherapy, insulin, or weight-loss drugs), a substantial weight change ($ 20 pounds in the past six months) or soft or metal implants/objects in the body (n = 46). An additional 98 women were unavailable or unwilling to participate. Among the 74 remaining eligible women, we selected 60 women (30 Caucasians and 30 Japanese Americans) distributed equally across BMI categories (cutoff points at BMI 22, 25, 27.5, and 30 kg/m2) to obtain a balanced representation by ethnicity and BMI levels.
Participants underwent anthropometric measurements, a DXA scan and a fasting venous blood collection at the University of Hawaii Clinical Research Center (UH-CRC). Forty-eight of the 60 women (28 Caucasian and 20 Japanese American) also agreed to participate in an MRI scan at the University of Hawaii and Queen’s Medical Center (UH-QMC) MR Research Center. The
Institutional Review Boards of UH and QMC approved the study protocol, and all participants signed an informed consent.
Body Fat Composition and Distribution
Anthropometric measurements included standing and sitting heights, weight, and waist and hip circumferences. Waist circumference (WC) was measured at two locations, at the navel and immediately above iliac crest, and hip circumference (HC) was measured at the widest area between waist and thighs, including buttocks [13]. WC at navel and its ratio over HC (waist-hip ratio; WHR) were used in the current analysis. A whole-body DXA scan (GE Lunar Prodigy, Madison, WI) was performed to measure total and regional body fat mass in the trunk, arms and legs. Trunk fat-periphery fat ratio (TPFR), calculated by dividing the trunk fat mass by the sum of fat mass in the arms and legs, was used as an indicator of abdominal adiposity. A subset of women completed an abdominal MRI scan on a 3 Tesla TIM Trio scanner (Siemens Medical Systems, Erlangen, Germany) in a supine position with a series of water-suppressed lipid scans at L4– L5 inter-vertebral position and axial triple gradient-echo scans of the liver [10]. Using the NIH program, Image J (http://rsbweb. nih.gov/ij), each subject’s cross-sectional lipid MR image was analyzed to determine the total fat and visceral fat areas at L4–L5 and to estimate the subcutaneous fat area by subtraction. Using a Siemens Leonardo workstation, the relative fat content of the liver was calculated based on the signal intensities of the three gradient echo images from a circular region (15–25 cm2) in the lateral portion of the right lobe [14].
Circulatory Biochemical Markers
Serum and plasma components were separated from fasting blood samples and stored in aliquots at280uC until analysis at the University of Hawaii Cancer Center’s (UHCC) Analytical Laboratory Shared Resource. The 58 analytes measured and their analytic methods, along with information on commercial kits when applicable, are listed in Table S1 (Supporting Infor-mation). Some of the markers were derived from directly measured analytes, as indicated in the Table. All assays were conducted on the same day in one or two batches, with most markers showing 2–20% variation among blind duplicate QC samples (10% of study samples; Table S1). Accuracy was assured by participation in quality assurance programs by the National Institute for Standards and Technology (Gaithersburg, MD) and/ or by the testing of commercial control samples.
Statistical Analysis
measure based on this cross-validation [15,16]. The Random Forest method provides a summary of the importance of predictors across the multiple regression trees and, thus, is suitable for multicollinear predictors, as it grows each tree with only a subset of all predictors and ranks correlated predictors with similar importancein later cross-validation [16]. It has been widely utilized in the prediction of complex biological pathways [18] and cancer risk [19].
All predictor and outcome variables, other than ethnicity, were continuous – percent liver fat was natural-log transformed to meet model assumptions. Among the 58 biomarkers, highly correlated markers (r.0.8) were consolidated in order to keep only one marker in each correlated cluster with the highest correlation with adiposity outcomes. As the result, 48 biomarkers were included in the final data analysis. For example, leptin-adiponectin ratio was chosen over adiponectin (rho = 20.87), insulin over Homeostatic Model Assessment of beta-cell function (HOMA-beta; rho = 0.80) or HOMA of insulin resistance (HOMA-IR; rho = 0.99), and total cholesterol over low-density lipoprotein cholesterol (LDL; rho = 0.91), due to their respective high correlations (all p’s,.0001). Random Forest prediction models for each adiposity outcome included: (1) anthropometric variables (BMI, WC, WHR), age and ethnicity; (2) 48 biomarkers, age, ethnicity and key covariates; (3) only the top 5 most important predictors from the biomarker model (2); and (4) top 5 predictors (from model 2), anthropometric variables (BMI, WC, WHR), age and ethnicity. Thekey covariatesthat were tested in model (3) included information on smoking status (never vs. former, pack-years of cigarette smoking), education, use of medications (estrogen, statins, aspirin) and dietary supplements, and number of children. Age, ethnicity
and the key covariates were selected because they may confound the association between biomarkers and body fat distribution but, as with all other variables in the model, were not retained if they did not show important predictive ability. Because of the limited sample size, a stratified sampling approach was used for each tree so that there were no imbalances between the splits in the distributions of all adiposity variables by age, BMI and WHR (t-testp.0.50). For each analysis, 500 regression trees were fit to the training data of 2/3 of the sample, with each tree using a subset of all available predictors. Two measures of predictability were created in each iteration. Animportancescore for each predictor was created from each cross-validation step using the 1/3 OOB testing sample, defined as the percent increase in the mean square error upon random permutation of the given predictor. The R2gives the proportion of variability in the dependent variable that is accounted by the given model in the test data. Subsequently, the top 20 most ‘‘important’’ predictors were plotted and the top 5 most important predictors selected for each adiposity outcome based on the measure of predictability. All statistical analyses were performed using the R statistical computing environment, v2.12.1 (R Core Development Team, 2010) and SAS v9.3 (SAS Institute, Cary, NC). Random Forest modeling was implemented using the randomForest package for R (Liaw & Wiener 2002).
Results
Table 1 describes the participant characteristics. Since the recruitment balanced the sample by ethnicity and BMI categories and applied an upper BMI limit of 40 kg/m2, participants’ BMI ranged from normal-weight to Class II obesity (18.8–39.6 kg/m2) Table 1.Characteristics of participating women.
N with
available data* Mean (standard deviation) or N (%) Range
Age, yrs 60 63.4 (1.37) 60.9–65.8
Ethnicity, n (%) 60
Caucasian American 30 (50%) –
Japanese American 30 (50%) –
Smoking history*, n (%) 60
Never 37 (62%) –
Former 23 (38%) –
Hormone treatment, % current use 60 6 (10%) –
Lipid-lowering medications, % current use 60 22 (37%) –
Dietary supplement, % current use 60 51 (85%) –
Body Mass Index (BMI), kg/m2 60 26.7 (4.9) 18.8–39.6
Obese (BMI$30 kg/m2), n (%) 60 14 (23%)
Waist circumference (WC), cm 60 94.9 (14.4) 70.3–134.9
Waist-hip ratio (WHR) 60 0.93 (0.08) 0.78–1.10
Abdominal obesity (WC.88 cm or WHR.0.85) 60 53 (88%) –
Total fat mass, kg 60 27.2 (9.2) 11.1–53.5
Trunk-to-periphery fat ratio 60 1.26 (0.34) 0.67–2.35
Visceral fat area, mm2 48 138.2 (93.9) 16.3–50.1
Subcutaneous fat area, mm2 48 19.5 (98.9) 69.3–553.1
Liver fat, % 48 6.2 (5.6) 1.5–20.9
Fatty liver (.5.5% liver fat) 48 17 (35%) –
and was distributed similarly between Caucasian and Japanese American women [10]. Also, the mean total fat mass among these women (27 kg), partially due to the truncated BMI range at recruitment, was lower than that reported in a national survey for mostly white women of similar ages (< 32 kg/m2) [20].
Nevertheless, a majority of these healthy, non-diabetic women (88%) had abdominal obesity (WC.88 cm or WHR.0.85), and a substantial fraction (35%) also had fatty liver (liver fat.5.5%; [21]).
Figure 1 illustrates the Random Forest plots for predicting total, abdominal, visceral and liver fat, based on biomarkers as well as age, ethnicity, and key covariates, and without the anthropo-metric indicators (model 3). Predictors selected from the training data sets are listed in the order of ‘‘importance’’ for up to 20 predictors. Based on the test data sets, these biomarkers explained 70%, 51%, 47% and 44% of the variance in total, abdominal, visceral and liver fat, respectively (Table 2). The top 5 predictors for each adiposity outcome in the testing data set were identical, and in a mostly identical order, as the top 5 predictors in the training data set.
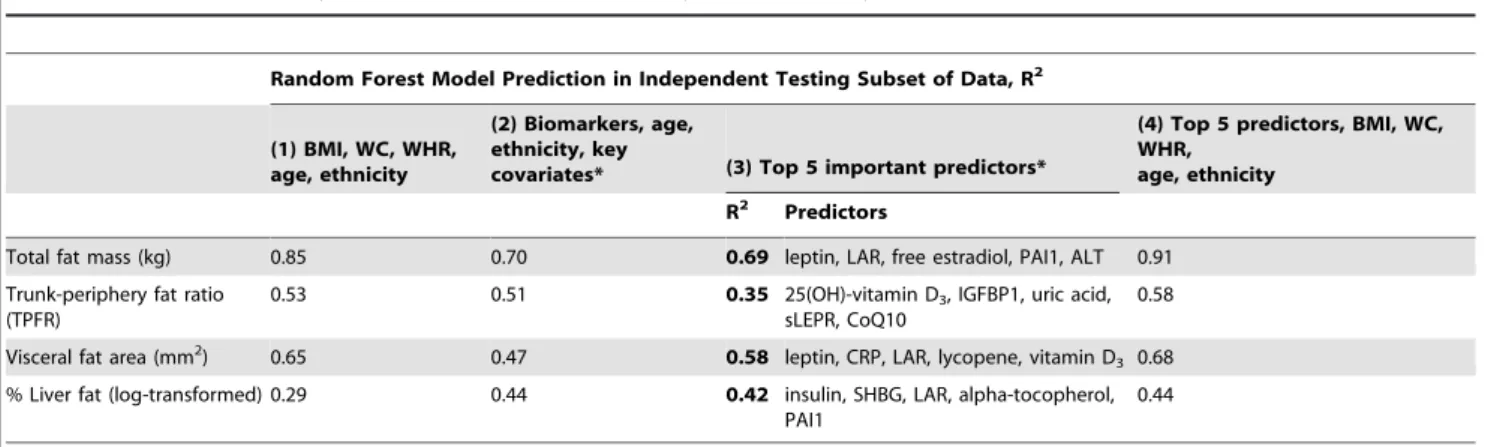
Table 2 presents the results from various prediction models. For total fat, the Random Forest model based on anthropometry, age and ethnicity explained most of the variation (R2= 0.85). Random Forest of 46 biomarkers and covariates (age, ethnicity, smoking, medication, supplement and parity), without anthropometry, provided a good but lower prediction (R2= 0.70) than the prediction from the anthropometry model. The top 5 most important predictors alone (leptin, leptin-adiponectin ratio [LAR], free estradiol, plasminogen activator inhibitor-1 [PAI1], and alanine transaminase [ALT]) predicted 69% of the variation. However, Random Forest prediction of total body fat mass based on these 5 top predictors and anthropometry combined showed the best prediction (R2= 0.91).
Unlike total fat mass, the prediction of abdominal fat (TPFR) was similar by anthropometry alone (R2= 0.53) or by biomarkers alone (R2= 0.51), although the R2 was attenuated when consid-ering only the top 5 predictors (25(OH)-vitamin D3, insulin-like growth factor binding protein-1 [IGFBP1], uric acid, soluble leptin receptor [sLEPR], Coenzyme Q10 [CoQ10]; R2= 0.35). Adding the top 5 biomarkers to BMI and the waist measures improved somewhat the prediction of abdominal fat (R2= 0.58).
The prediction of visceral fat obtained from the biomarkers (R2= 0.47) was improved when considering only the top 5 biomarkers (leptin, C-reactive protein [CRP], LAR, lycopene, vitamin D3; R
2
= 0.58). Adding the anthropometric variables to the biomarkers further improved the prediction (R2= 0.68) and performed better than the anthropometry-only model (R2= 0.65). Liver fat was predicted 1.5-fold better by the biomarkers (R2= 0.44) than by anthropometric variables alone (R2= 0.29), with the top 5 predictors from the biomarker model being insulin, sex hormone binding globulin [SHBG], LAR, alpha-tocopherol, and PAI1 (R2= 0.42). Adding BMI and waist size variables to the biomarker model only improved the prediction slightly (R2= 0.44).
Discussion
These prediction analyses of measured total and regional fat mass confirmed that BMI, based on weight and height, and waist size measurements together predict total body fat very well (R2= 85%). However, we found that measures of abdominal and intra-abdominal (visceral and liver) fat were predicted less optimally by these anthropometric variables and that the addition of adiposity-associated biomarkers improved their predictions. About half of the variation in abdominal adiposity was predicted
by anthropometry, with the prediction of this variability further improved by adding the top 5 predictors from the Random Forest biomarker model (R2= 0.53 to 0.58). The prediction of visceral fat also improved slightly (R2= 0.65 to 0.68) by adding the top 5 biomarker predictors. The largest contribution from the biomark-er model was obsbiomark-erved for the prediction of livbiomark-er fat, for which R2 increased from 29% with the anthropometry model to 44% with the model that also included the top 5 biomarkers. Blood adipokines (leptin, leptin-adiponectin ratio, sLEPR, PAI1) con-tributed to the prediction of both total and regional fat. Other top predictors included markers of insulin resistance and the IGF pathway (insulin, IGFBP1, uric acid), sex hormones (free estradiol, SHBG), lipid-soluble micronutrients (vitamin D3, lycopene, CoQ10, alpha-tocopherol) and markers of inflammation (CRP).
It is well established that adipose tissues are active endocrine organs, with each regional depot having intrinsic secretory profiles [22–24]. Thus, blood concentrations of depot-specific adipocyte-derived biomarkers and their metabolites may reflect relative body fat distribution and also contribute to associated metabolic risks. Metabolic syndrome has been associated more with abdominal fat than total or gluteofemoral fat [25,26], and more with visceral fat compared to abdominal subcutaneous fat [27–29]. Accordingly, in past studies, certain circulatory markers have shown a strong association with visceral fat specifically (Table S1), including low blood levels of adiponectin [30–32] and SHBG [33], and high levels of PAI1 [34], visfatin [35], systemic inflammatory markers [36], insulin [37] and free estradiol [38]. Also, liver fat has been associated with blood levels of liver enzymes [39,40], insulin and sLEPR [41], adiponectin [42], PAI1 [43], fetuin A [44], retinol binding protein-4 (RBP4) [45,46], and free fatty acids [47]. Our study included most of these biomarkers associated with regional adiposity.
There have been few published studies that have attempted to optimally predict body composition with a comprehensive list of biomarkers. In a study of 56 middle-aged and 20 older adults who were healthy but overweight, 124 proteins in fasting blood analyzed with a Luminex multiplex assay were tested for their prediction of BMI using Random Forest modeling [8]. Similar to our study, the candidate markers were selecteda priori, based on their association with chronic diseases, inflammation, endothelial function and metabolic signaling. BMI was best predicted, positively, by leptin, complement 3 (C3), CRP, amyloid P and vascular endothelial growth factor, and, negatively, by IL-3, IL-13 and apolipoprotein A1. In another study of 20 postmenopausal women, DXA-based percent lean body mass was predicted by fasting blood levels of 90 cytokines analyzed with a Luminex multiplex assay [48]. Random Forest modeling identified 7 top predictors of percent lean mass (serum leptin, adiponectin, insulin, C3, amyloid P, growth hormone, eotaxin) and discriminated high vs. low lean mass groups with less error (mean error = 8.1%, SD = 5.0%) compared to an alternative Recursive Partitioning model (mean error = 11.9%, SD = 8.5%).
Our findings support the contention that adding key biomarkers to usual anthropometric variables may enhance the prediction of body fat distribution patterns when reference imaging-based methods are not practical, such as typically in large epidemiologic studies. Past studies that compared anthropometric measures to imaging of fat topography observed a good correlation between anthropometry and total fat mass [49] but detected lower correlations for intra-abdominal fat distribution [6,7]. Our study results are consistent with this literature.
SHBG for liver fat (Figure 1). We did not observe one or two predominantly strong predictors for abdominal fat like we did for the other adiposity measures. Leptin, a well-established indicator of total adiposity, also predicted visceral fat, together with leptin-adiponectin ratio, which may independently reflect leptin resis-tance due to excess intra-abdominal adiposity [50]. Insulin
resistance markers (insulin, HOMA-IR, HOMA-beta) were consistently among the most important predictors of visceral fat and liver fat, although we included only insulin in the final model due to their high correlations. These results are consistent with the notion that visceral fat carries a greater metabolic risk than subcutaneous fat by inducing fatty acid drainage into the liver
Figure 1. Random Forest models for predicting adiposity. Total, abdominal (trunk-to-periphery fat ratio or TPFR), visceral and hepatic
adiposity measurements were predicted to various extent by a number of blood biomarkers, as well as by demographic (age, ethnicity, education) and key lifestyle variables (smoking, medication use, supplement use, parity), without anthropometric variables. Predictors were ranked by the importance score, which was based on percent increase in mean square error upon random permutation of the given predictor. The figure shows the top 20 predictors for each adiposity measure. (Abbreviations: BMI [body mass index], %incMSE (percent increase in mean square error), RF [Random Forest]; see Table S1 for the full names of the biomarkers).
through the portal venous system, which then may impair insulin/ glucose homeostasis [51–53]. Endogenous synthesis of estrogen from androstenedione in adipocytes is known to be particularly active in the subcutaneous adipose tissue, whereas visceral fat and subsequent increase in liver fat may interfere with the production of SHBG [54]. This is also consistent with our findings, where blood levels of bioactive free estradiol were shown to predict total adiposity (mostly subcutaneous fat) and SHBG predicted hepatic adiposity.
CRP ranked high for predicting visceral adiposity. However, in contrast to previous studies [26,55], other common markers of systemic inflammation were either mostly undetectable (TNFa) or showed only modest to low predictive ability for total adiposity (IL6). This may be because our study participants were mostly healthy adults who were non-diabetic and without overt low-grade inflammation. Lipid-soluble micronutrients, especially D vitamers, also showed prediction capacity for abdominal, visceral and hepatic adiposity, as noted before [56,57].
A key strength of the present study is the implementation of Random Forest modeling. The use of stepwise linear regression to screen biomarkers resulted in over-fitting of the training data (leading to many predictors in the final model and a R2.95%), with a low predictive R2in the testing data, in our analysis (data not shown), as well as in past studies [58]. The tree-based Random Forest modeling also allowed the incorporation of potentially important interactions among predictors. This is the first time that this analytic approach was used to predict detailed, imaging-based regional body fat measurements. The study limitations include a relatively small sample size and the possibility that potential confounders were not accounted for. Also, there may be other (as yet unidentified) biomarkers that could substantially improve the predictions. Replications in larger datasets are warranted, especially to compare the prediction performance of biomarkers in men and across ethnic groups with varying body fat distribution. In this sample of Caucasian and Japanese American women, ethnicity was an important determinant of fat distribution [10]. Interestingly, it did not remain an important predictor after accounting for anthropometry and the biomarker predictors.
In summary, we provide preliminary evidence that supports the utility of measuring key blood biomarkers to improve the
performance of usual anthropometric variables in predicting abdominal, visceral and liver fat. Discovery of additional biomarker predictors and generalization of this research to other populations may allow for the development of accurate prediction models for specific body fat compartments. Such prediction equations may be very useful in predicting risk of obesity-associated diseases at the individual and population levels.
Supporting Information
Figure S1 Diagram of Random Forest modeling. Random Forest takes an ensemble approach to create and summarize multiple regression trees. For this study, each regression tree performed linear regression of an adiposity variable of interest on a random subset of all available predictors in a random bootstrap subsample of all women. Each regression tree is then measured for predictability of the given linear regression model by applying it to the remaining sample as an out-of-bag testing sample. Each predictor is assigned a predictability measure (‘‘importance’’) based on this cross-validation, which is summarized across multiple regression trees.
(DOC)
Table S1 Measured and derived biomarkers considered for Random Forest (RF) prediction of body fat distribution and supporting evidence.
(DOC)
Acknowledgments
We thank the study participants. We also acknowledge the contribution of Laurie Custer, Cynthia Morrison, William Cooney and Jennifer Lai and Drs. Weiwen Chai and Xingnan Li for the biochemical analysis in the Analytical Laboratory Shared Resource at UHCC.
Author Contributions
Conceived and designed the experiments: UL LRW CLA RN LNK SPM LLM. Analyzed the data: UL SDT LLM. Wrote the paper: UL SDT LLM. Critical revision of manuscript: UL SDT AAF RVC LRW TE CLA RN LC LNK SPM LLM. Human data collection: UL LNK SPM LLM. Imaging data collection: TE LC. Laboratory analysis: AAF RVC.
Table 2.Prediction of body fat content and distribution by anthropometry and biomarkers.
Random Forest Model Prediction in Independent Testing Subset of Data, R2
(1) BMI, WC, WHR, age, ethnicity
(2) Biomarkers, age, ethnicity, key
covariates* (3) Top 5 important predictors*
(4) Top 5 predictors, BMI, WC, WHR,
age, ethnicity
R2 Predictors
Total fat mass (kg) 0.85 0.70 0.69 leptin, LAR, free estradiol, PAI1, ALT 0.91
Trunk-periphery fat ratio (TPFR)
0.53 0.51 0.35 25(OH)-vitamin D3, IGFBP1, uric acid,
sLEPR, CoQ10
0.58
Visceral fat area (mm2) 0.65 0.47 0.58 leptin, CRP, LAR, lycopene, vitamin D 3 0.68
% Liver fat (log-transformed) 0.29 0.44 0.42 insulin, SHBG, LAR, alpha-tocopherol, PAI1
0.44
*Model (2) included all biomarkers, age, ethnicity, and key covariates, including smoking status (never vs. former, pack-years of cigarette smoking), education, use of medications (estrogen, statins, aspirin) and dietary supplements, and number of children. Model (3) shows the top 5 predictors from Model (2).
Abbreviations: IGFBP1 (insulin-like growth factor binding protein 1); LAR (leptin to high-molecular-weight adiponectin ratio); PAI1 (plasminogen activator inhibitor-1); SHBG (sex hormone binding globulin); sLEPR (soluble leptin receptor).
References
1. Boyko EJ, Fujimoto WY, Leonetti DL, Newell-Morris L (2000) Visceral adiposity and risk of type 2 diabetes: a prospective study among Japanese Americans. Diabetes Care 23: 465–471.
2. Oh TH, Byeon JS, Myung SJ, Yang SK, Choi KS, et al. (2008) Visceral obesity as a risk factor for colorectal neoplasm. J Gastroenterol Hepatol 23: 411–417. 3. Sorensen HT, Mellemkjaer L, Jepsen P, Thulstrup AM, Baron J, et al. (2003)
Risk of cancer in patients hospitalized with fatty liver: a Danish cohort study. JClinGastroenterol 36: 356–359.
4. Balkau B, Lange C, Vol S, Fumeron F, Bonnet F (2010) Nine-year incident diabetes is predicted by fatty liver indices: the French D.E.S.I.R. study. BMC Gastroenterol 10: 56.
5. Lemieux S, Prud’homme D, Bouchard C, Tremblay A, Despres JP (1996) A single threshold value of waist girth identifies normal-weight and overweight subjects with excess visceral adipose tissue. Am J Clin Nutr 64: 685–693. 6. Camhi SM, Bray GA, Bouchard C, Greenway FL, Johnson WD, et al. (2011)
The relationship of waist circumference and BMI to visceral, subcutaneous, and total body fat: sex and race differences. Obesity (Silver Spring) 19: 402–408. 7. Ludescher B, Machann J, Eschweiler GW, Vanhofen S, Maenz C, et al. (2009)
Correlation of fat distribution in whole body MRI with generally used anthropometric data. Invest Radiol 44: 712–719.
8. van Dijk SJ, Feskens EJ, Heidema AG, Bos MB, van de Rest O, et al. (2010) Plasma protein profiling reveals protein clusters related to BMI and insulin levels in middle-aged overweight subjects. PLoS One 5: e14422.
9. Cohen J, Cohen P, West SG, Aiken LS (2003) Applied multiple regression/ correlation analysis for the behavioral sciences. Mahwah, NJ.: Lawrence Erlbaum Associates.
10. Lim U, Ernst T, Buchthal SD, Latch M, Albright CL, et al. (2011) Asian women have greater abdominal and visceral adiposity than Caucasian women with similar body mass index. Nutrition and Diabetes (Epub on Nutrition & Diabetes website. Available: http://www.nature.com/nutd/journal/v1/n5/index_by_ arttype.html) Accessed 2012 July 5.
11. Lim U, Ernst T, Wilkens LR, Albright CL, Lun-Jones A, et al. (2012) Susceptibility variants for waist size in relation to abdominal, visceral and hepatic adiposity in postmenopausal women. J Academy Nutr Dietetics in press. 12. Kolonel LN, Henderson BE, Hankin JH, Nomura AM, Wilkens LR, et al. (2000) A multiethnic cohort in Hawaii and Los Angeles: baseline characteristics. AmJEpidemiol 151: 346–357.
13. Bosy-Westphal A, Booke CA, Blocker T, Kossel E, Goele K, et al. (2010) Measurement site for waist circumference affects its accuracy as an index of visceral and abdominal subcutaneous fat in a Caucasian population. J Nutr 140: 954–961.
14. Guiu B, Loffroy R, Petit JM, Aho S, Ben Salem D, et al. (2009) Mapping of liver fat with triple-echo gradient echo imaging: validation against 3.0-T proton MR spectroscopy. Eur Radiol 19: 1786–1793.
15. Breiman L (2001) Random Forests. Machine Learning 45: 5–32.
16. Svetnik V, Liaw A, Tong C, Culberson JC, Sheridan RP, et al. (2003) Random forest: a classification and regression tool for compound classification and QSAR modeling. J Chem Inf Comput Sci 43: 1947–1958.
17. Hastie T, Tibshirani R, Friedman J (2009) The elements of statistical learning: data mining, inference and prediction. New York: Springer.
18. Rodenburg W, Heidema AG, Boer JM, Bovee-Oudenhoven IM, Feskens EJ, et al. (2008) A framework to identify physiological responses in microarray-based gene expression studies: selection and interpretation of biologically relevant genes. Physiol Genomics 33: 78–90.
19. Kim BK, Lee JW, Park PJ, Shin YS, Lee WY, et al. (2009) The multiplex bead array approach to identifying serum biomarkers associated with breast cancer. Breast Cancer Res 11: R22.
20. Li C, Ford ES, Zhao G, Balluz LS, Giles WH (2009) Estimates of body composition with dual-energy X-ray absorptiometry in adults. Am J Clin Nutr 90: 1457–1465.
21. Szczepaniak LS, Nurenberg P, Leonard D, Browning JD, Reingold JS, et al. (2005) Magnetic resonance spectroscopy to measure hepatic triglyceride content: prevalence of hepatic steatosis in the general population. Am J Physiol Endocrinol Metab 288: E462–468.
22. Wajchenberg BL, Giannella-Neto D, da Silva ME, Santos RF (2002) Depot-specific hormonal characteristics of subcutaneous and visceral adipose tissue and their relation to the metabolic syndrome. Horm Metab Res 34: 616–621. 23. Vohl MC, Sladek R, Robitaille J, Gurd S, Marceau P, et al. (2004) A survey of
genes differentially expressed in subcutaneous and visceral adipose tissue in men. Obes Res 12: 1217–1222.
24. Wang S, Sparks LM, Xie H, Greenway FL, de Jonge L, et al. (2009) Subtyping obesity with microarrays: implications for the diagnosis and treatment of obesity. Int J Obes (Lond) 33: 481–489.
25. Snijder MB, Visser M, Dekker JM, Goodpaster BH, Harris TB, et al. (2005) Low subcutaneous thigh fat is a risk factor for unfavourable glucose and lipid levels, independently of high abdominal fat. The Health ABC Study. Diabetologia 48: 301–308.
26. Koster A, Stenholm S, Alley DE, Kim LJ, Simonsick EM, et al. (2010) Body fat distribution and inflammation among obese older adults with and without metabolic syndrome. Obesity (Silver Spring) 18: 2354–2361.
27. Carr DB, Utzschneider KM, Hull RL, Kodama K, Retzlaff BM, et al. (2004) Intra-abdominal fat is a major determinant of the National Cholesterol Education Program Adult Treatment Panel III criteria for the metabolic syndrome. Diabetes 53: 2087–2094.
28. Goodpaster BH, Krishnaswami S, Harris TB, Katsiaras A, Kritchevsky SB, et al. (2005) Obesity, regional body fat distribution, and the metabolic syndrome in older men and women. Arch Intern Med 165: 777–783.
29. Kuk JL, Church TS, Blair SN, Ross R (2006) Does measurement site for visceral and abdominal subcutaneous adipose tissue alter associations with the metabolic syndrome? Diabetes Care 29: 679–684.
30. Cnop M, Havel PJ, Utzschneider KM, Carr DB, Sinha MK, et al. (2003) Relationship of adiponectin to body fat distribution, insulin sensitivity and plasma lipoproteins: evidence for independent roles of age and sex. Diabetologia 46: 459–469.
31. Koh SJ, Hyun YJ, Choi SY, Chae JS, Kim JY, et al. (2008) Influence of age and visceral fat area on plasma adiponectin concentrations in women with normal glucose tolerance. Clin Chim Acta 389: 45–50.
32. Nakamura Y, Sekikawa A, Kadowaki T, Kadota A, Kadowaki S, et al. (2009) Visceral and subcutaneous adiposity and adiponectin in middle-aged Japanese men: the ERA JUMP study. Obesity (Silver Spring) 17: 1269–1273. 33. Nielsen TL, Hagen C, Wraae K, Brixen K, Petersen PH, et al. (2007) Visceral
and subcutaneous adipose tissue assessed by magnetic resonance imaging in relation to circulating androgens, sex hormone-binding globulin, and luteinizing hormone in young men. J Clin Endocrinol Metab 92: 2696–2705.
34. Lee CG, Carr MC, Murdoch SJ, Mitchell E, Woods NF, et al. (2009) Adipokines, inflammation, and visceral adiposity across the menopausal transition: a prospective study. J Clin Endocrinol Metab 94: 1104–1110. 35. Indulekha K, Anjana RM, Surendar J, Mohan V (2011) Association of visceral
and subcutaneous fat with glucose intolerance, insulin resistance, adipocytokines and inflammatory markers in Asian Indians (CURES-113). Clin Biochem 44: 281–287.
36. Carroll JF, Fulda KG, Chiapa AL, Rodriquez M, Phelps DR, et al. (2009) Impact of race/ethnicity on the relationship between visceral fat and inflammatory biomarkers. Obesity (Silver Spring) 17: 1420–1427.
37. Miyazaki Y, DeFronzo RA (2009) Visceral fat dominant distribution in male type 2 diabetic patients is closely related to hepatic insulin resistance, irrespective of body type. Cardiovasc Diabetol 8: 44.
38. Tanko LB, Bruun JM, Alexandersen P, Bagger YZ, Richelsen B, et al. (2004) Novel associations between bioavailable estradiol and adipokines in elderly women with different phenotypes of obesity: implications for atherogenesis. Circulation 110: 2246–2252.
39. Fierbinteanu-Braticevici C, Dina I, Petrisor A, Tribus L, Negreanu L, et al. (2010) Noninvasive investigations for non alcoholic fatty liver disease and liver fibrosis. World J Gastroenterol 16: 4784–4791.
40. Loomba R, Rao F, Zhang L, Khandrika S, Ziegler MG, et al. (2010) Genetic covariance between gamma-glutamyl transpeptidase and fatty liver risk factors: role of beta2-adrenergic receptor genetic variation in twins. Gastroenterology 139: 836–845, 845 e831.
41. Nobili V, Manco M, Ciampalini P, Diciommo V, Devito R, et al. (2006) Leptin, free leptin index, insulin resistance and liver fibrosis in children with non-alcoholic fatty liver disease. Eur J Endocrinol 155: 735–743.
42. Turer AT, Browning JD, Ayers CR, Das SR, Khera A, et al. (2012) Adiponectin as an Independent Predictor of the Presence and Degree of Hepatic Steatosis in the Dallas Heart Study. J Clin Endocrinol Metab.
43. Ishii M, Yoshioka Y, Ishida W, Kaneko Y, Fujiwara F, et al. (2005) Liver fat content measured by magnetic resonance spectroscopy at 3.0 tesla indepen-dently correlates with plasminogen activator inhibitor-1 and body mass index in type 2 diabetic subjects. Tohoku J Exp Med 206: 23–30.
44. Ix JH, Wassel CL, Chertow GM, Koster A, Johnson KC, et al. (2009) Fetuin-A and change in body composition in older persons. J Clin Endocrinol Metab 94: 4492–4498.
45. Stefan N, Hennige AM, Staiger H, Machann J, Schick F, et al. (2007) High circulating retinol-binding protein 4 is associated with elevated liver fat but not with total, subcutaneous, visceral, or intramyocellular fat in humans. Diabetes Care 30: 1173–1178.
46. Tonjes A, Bluher M, Stumvoll M (2010) Retinol-binding protein 4 and new adipocytokines in nonalcoholic fatty liver disease. Curr Pharm Des 16: 1921– 1928.
47. Kotronen A, Seppanen-Laakso T, Westerbacka J, Kiviluoto T, Arola J, et al. (2010) Comparison of lipid and fatty acid composition of the liver, subcutaneous and intra-abdominal adipose tissue, and serum. Obesity (Silver Spring) 18: 937– 944.
48. Bea JW, Wright NC, Thompson P, Hu C, Guerra S, et al. (2011) Performance evaluation of a multiplex assay for future use in biomarker discovery efforts to predict body composition. Clin Chem Lab Med 49: 817–824.
49. Sun Q, van Dam RM, Spiegelman D, Heymsfield SB, Willett WC, et al. (2010) Comparison of dual-energy x-ray absorptiometric and anthropometric measures of adiposity in relation to adiposity-related biologic factors. Am J Epidemiol 172: 1442–1454.
syndrome, dependent on visceral fat accumulation and endurance fitness in obese patients with diabetes mellitus. Metab Syndr Relat Disord 3: 85–94. 51. Montague CT, O’Rahilly S (2000) The perils of portliness: causes and
consequences of visceral adiposity. Diabetes 49: 883–888.
52. Kabir M, Catalano KJ, Ananthnarayan S, Kim SP, Van Citters GW, et al. (2005) Molecular evidence supporting the portal theory: a causative link between visceral adiposity and hepatic insulin resistance. Am J Physiol Endocrinol Metab 288: E454–461.
53. Bergman RN, Kim SP, Catalano KJ, Hsu IR, Chiu JD, et al. (2006) Why visceral fat is bad: mechanisms of the metabolic syndrome. Obesity (Silver Spring) 14 Suppl 1: 16S–19S.
54. Rose DP, Haffner SM, Baillargeon J (2007) Adiposity, the metabolic syndrome, and breast cancer in African-American and white American women. Endocr Rev 28: 763–777.
55. Beasley LE, Koster A, Newman AB, Javaid MK, Ferrucci L, et al. (2009) Inflammation and race and gender differences in computerized tomography-measured adipose depots. Obesity (Silver Spring) 17: 1062–1069.
56. Young KA, Engelman CD, Langefeld CD, Hairston KG, Haffner SM, et al. (2009) Association of plasma vitamin D levels with adiposity in Hispanic and African Americans. J Clin Endocrinol Metab 94: 3306–3313.
57. Targher G, Bertolini L, Scala L, Cigolini M, Zenari L, et al. (2007) Associations between serum 25-hydroxyvitamin D3 concentrations and liver histology in patients with non-alcoholic fatty liver disease. Nutr Metab Cardiovasc Dis 17: 517–524.