2Department of Geomatics Engineering, Ho Chi Minh city University of Technology, 268 Ly Thuong Kiet St., Dist. 10, Ho Chi Minh City, Vietnam
Correspondence to:V. H. Phan (v.phanhien@tudelft.nl)
Received: 12 December 2012 – Published in Hydrol. Earth Syst. Sci. Discuss.: 17 January 2013 Revised: 22 August 2013 – Accepted: 14 September 2013 – Published: 21 October 2013
Abstract.The Tibetan Plateau is an essential source of wa-ter for Southeast Asia. The runoff from its∼34 000 glaciers, which occupy an area of∼50 000 km2, feeds Tibetan lakes and major Asian rivers like the Indus and Brahmaputra. Re-ported glacial shrinkage likely has an impact on the runoff. Unfortunately, accurate quantification of glacial changes is difficult over the high-relief Tibetan Plateau. However, it has recently been shown that it is possible to directly assess wa-ter level changes of a significant number of the∼900 Tibetan lakes with an area over 1 km2. This paper exploits different remote sensing products to create drainage links between Ti-betan glaciers, lakes and rivers. The results allow us to dif-ferentiate between lakes with and without outlet. In addition, we introduce the notion of geometric dependency of a lake on glacial runoff, defined as the ratio between the total area of glaciers draining into a lake and the total area of the lake catchment. We determined these dependencies for all∼900 sufficiently large Tibetan lakes. To do so, we combined three remote sensing products: the CAREERI glacier mask prod-uct, a lake mask product based on the MODIS MOD44W water product and the HydroSHEDS river network product derived from Shuttle Radar Topography Mission (SRTM) el-evation data. Using a drainage network analysis, we deter-mined all drainage links between glaciers and lakes. The re-sults show that 25.3 % of the total glacier area directly drains into one of 244 Tibetan lakes. The results also give the geo-metric dependency of each lake on glacial runoff. For exam-ple, there are ten lakes with direct glacial runoff from at least 240 km2of glacier. Three case studies, including one of the well-studied Nam Tso Lake, demonstrate how the geometric dependency of a lake on glacial runoff can be directly linked to hydrological processes.
1 Introduction
In addition to monitoring glacier changes, researchers have also studied lake level fluctuations on the Tibetan Plateau. As described in recent reports (Zhang et al., 2011; Phan et al., 2012a; Wang et al., 2013), studies estimated roughly 150 water level trends in the Tibetan lakes sam-pled by the ICESat/GLAS LIDAR campaigns between 2003 and 2009. The results indicate that the water level of most lakes on the southern Tibetan Plateau and along the Himalaya mountain range shows a serious downwards trend. Lakes with a positive water level trend during the observed period are mostly located on the inner plateau. Phan et al. (2012b) showed that seasonal variations in lake levels and lake level trends differ considerably for different parts of the Tibetan Plateau. Besides, Zhang et al. (2013) correlated water mass increases derived from GRACE data to positive lake level trends.
Glacial runoff is only one component contributing to the water levels of the lakes on the Tibetan Plateau. Water levels are also affected by rainfall, snow melt, underground water, evaporation and lake water runoff. Hydrological models can be used to estimate the amount of glacier meltwater flow-ing into a lake. At the moment, it is only possible to estab-lish these hydrological models for selected basins, simply be-cause the necessary measurements are not available for most of the Tibetan Plateau. As demonstrated in this paper, how-ever, it is possible to determine all geometric links between Tibetan lakes and glaciers. This enables us to determine to what level each lake is geometrically dependent on glacial runoff. This work will constrain the modeling of hydrologi-cal processes and will also provide an indirect way to mon-itor the state of the Tibetan glaciers, as monmon-itoring lake lev-els is easier than monitoring glacial changes in a high-relief environment. We believe that a regional approach, like this work, is needed to start understanding the spatial variations in glacial mass changes that are reported in current literature.
2 Data and methods
In this section, we introduce all used data products, data for-mat conversions and coordinate systems. We define geospa-tial notions such as lake catchment, lake outlet, connection between glacier and lake, etc. Then, we show how to de-termine connections between glaciers and lakes. Finally, we describe indicators for the geometric dependency of a Ti-betan lake on glaciers and methods for the computation of this dependency.
2.1 Data
The main data sources used in this paper are the MODIS land-water mask, the CAREERI glacier mask, and the Hy-droSHEDS river network and drainage basin data. The wa-ter mask gives the locations of the Tibetan lakes. The glacier mask gives the outlines of the Tibetan glaciers. The river data
provides information on the direction of surface runoff, while the drainage basin data describes the catchment areas on the Tibetan Plateau. The river network is used to analyze the con-nections between glaciers and lakes. For integration, all these data are projected onto the WGS84 Geographic Coordinate System.
2.1.1 The MODIS land-water mask
The water mask, called MODIS MOD44W 250 m, was pro-duced using over 8 yr of Terra MODIS spectral data, over 6 yr of Aqua MODIS spectral data and Shuttle Radar To-pography Mission (SRTM) elevation data (GLCF, 2012). For each pixel, the MODIS land-water mask indicates in different ways whether one of the contributing algorithms decided that the pixel represents water. In addition to lakes, the mask also shows some parts of rivers. The lakes in the mask are com-pared to Google Earth and appropriate Landsat TM images to remove parts of rivers and empty depressions or holes. For this study, we selected lakes with an area over 1 km2. This limits a trade-off: selecting only larger lakes would decrease the number of lakes in the analysis, while applying a lower threshold would stretch the possibilities of the 250 m MODIS land-water mask too much. This selection returns 891 lakes with an area over 1 km2on the Tibetan Plateau. They occupy a total area of approximately 38 800 km2, as shown in Fig. 1.
2.1.2 The CAREERI glacier mask
The glacier mask was developed by the World Data Cen-ter for Glaciology and Geocryology, Lanzhou (WDC, 2012). The product is distributed as ArcInfo coverage data, a GIS file format. It uses the Projected Coordinate System, based on the Krasovsky spheroid and the Albers map projection, as detailed in its metadata file. Its attributes consist of the area of each glacier (m2), perimeter (m), and glacier identifica-tion codes. The glacier inventory was based on both remote sensing and in situ data from 1978 to 2002 (Shi et al., 2009). The original data was collected and digitized by the Cold and Arid Regions Environmental and Engineering Research In-stitute, Chinese Academy of Science (CAREERI). The data accuracy is not described in the metadata. To enable inte-gration into this application, we project the glacier coverage onto the WGS84 Geographic Coordinate System using a map conversion tool in ArcGIS. The glacier mask contains 34 676 glaciers, stored as polygons that represent the glacier bound-aries on the Tibetan Plateau. The total area of the glaciers is approximately 53 236 km2, as shown in Fig. 1.
2.1.3 The HydroSHEDS river and drainage basin data
Fig. 1.Glaciers and lakes on the Tibetan Plateau.
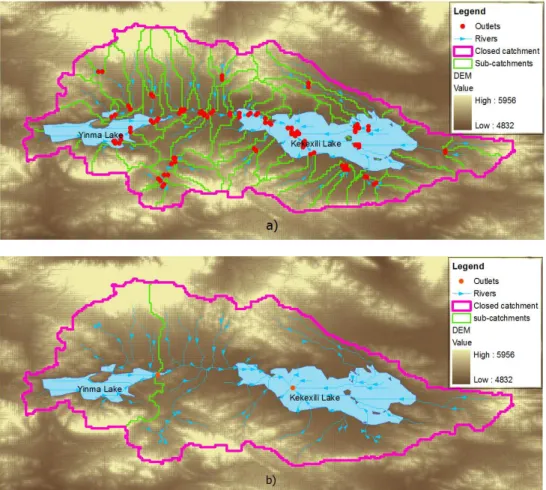
Fig. 2.Tibetan catchments derived from HydroSHEDS. Inset: the river network at the Kekexili catchment.
offers a suite of geo-referenced data sets (vector and raster), including stream networks, watershed boundaries, drainage directions and ancillary data layers such as flow accumula-tions, distances and river topology information. It is derived from elevation data of the STRM at 3 arcsecond resolution (a grid cell size of approximately 87 m on the Tibetan Plateau). The processing methods include void filling, filtering, stream burning, and up-scaling techniques. Manual corrections were made where necessary (Lehner et al., 2008).
The HydroSHEDS river data are directly derived from drainage directions and flow accumulation layers. The river data are built at 15 arcsecond resolution (approximately 410 m on the Tibetan Plateau). Grid cells with an upstream drainage area exceeding a threshold of 100 upstream cells were considered as belonging to a stream or a river segment. The river data are formatted in polyline vectors where each line is formed by a from-node (starting point), a list of ver-tices and a to-node (end point). The river network is refer-enced to WGS84. Each river segment has a pointer to its corresponding flow accumulation given as a number of grid
cells. For example, the inset in Fig. 2 shows the river net-work in the Kekexili Lake catchment, and the flow route from Yinma Lake to Kekexili Lake is indicated.
The HydroSHEDS drainage basin data, describing the catchment areas or the watershed boundaries, are also built at 15 arcsecond resolution. This product is formatted as poly-gons, as shown in Fig. 2. It is also referenced to WGS84. Catchments are attributed with an area in square kilome-ter, e.g. the Kekexili Lake catchment occupies an area of 2636.5 km2.
Fig. 3.CAREERI glacier mask data, MODIS MOD44W land-water mask data and HydroSHEDS rivers and basin outlines superimposed over Landsat-ETM+. Note the discrepancy between the CAREERI glacier outlines and the location of the glaciers on the Landsat image.
approximately 2 km. On the other hand, the MODIS lakes and the HydroSHEDS rivers and catchments match the Land-sat image quite well.
2.2 Methods
2.2.1 Determining the catchment of a Tibetan lake
A catchment, also known as drainage basin or watershed, is defined as the area where the surface water from rain and melting snow or ice converges to a single point or outlet, where the water joins another water body such as a lake, river or ocean (DeBarry, 2004). In a closed catchment, also called endorheic basin, surface flow is trapped in a lake or depression without outlet. Water typically leaves the basin by evaporation. As surface water contains some salt that is left behind after evaporation, such sink lakes, e.g. Nam Tso, are typically salty. Figure 4 illustrates the Kekexili catchment. All surface runoff from this closed catchment (described by the purple boundary) converges to Kekexili Lake, a sink lake. Each catchment is surrounded by a geographical barrier, typ-ically a mountain ridge.
Catchments drain into other catchments in a hierarchical pattern, with smaller catchments, also called sub-catchments, combining to larger catchments. Depending on the applica-tion scale, a sub-catchment can be determined accordingly. If there is one river that leaves a certain lake with an outlet, that lake is an upstream lake. The sub-catchment for such a lake is part of a bigger catchment. An example for this is the Yinma
Lake catchment. As shown in Fig. 4, the Yinma Lake catch-ment is a sub-catchcatch-ment of the Kekexili Lake catchcatch-ment.
2.2.2 Determining connections between glaciers and lakes
Based on the river network, an oriented route of river seg-ments can be determined, running from one node to an-other. Determining the connection between a glacier and a lake means finding a route from an origin (where the glacier drains into the river network) to the outlet of a lake catch-ment. In most cases, the origin of the glacier-melt drainage coincides with the from-node of a river segment, as illus-trated in Fig. 5. A node of the river network is also used to represent the outlet of a lake catchment, as illustrated in Fig. 6. We describe a connection between lakes as an ori-ented route from the outlet of a lake catchment to the outlet of another lake catchment. To determine these glacier-lake and lake-lake connections, we have built a module in the Ar-cGIS environment that executes the four procedures below.
Fig. 4. (a)Catchments represented by at least 100 upstream cells draining into a river segment based on the HydroSHEDS DEM data at 15 arcsecond resolution.(b)The Yinma Lake sub-catchment as part of the Kekexili Lake closed catchment.
Fig. 5.Glaciers G1and G2belonging to catchment Cat1and from-nodes A, B and E corresponding to origins of the glacier-melt drainage of glaciers G1, G2and G3.
in Fig. 5, the two glaciers G1 and G2are assumed to belong to catchment Cat1.
2. Estimating the origin of the glacier-melt drainage.In reality, meltwater from a glacier directly drains into the outlet of one catchment, through surface runoff
Fig. 6.The sinks A and H of closed catchments and the outlets C and F of sub-catchments.
in reality glacier G2may also drain its meltwater via from-node C.
3. Identifying the outlet of a lake catchment. The outlet of each lake has to be inside the lake region. If all incident river segments stream toward the outlet inside a lake, that lake is the sink of a closed catchment. In Fig. 6a and c, point A and point H are the outlets of closed catchments, and are therefore sinks. If even one river segment leaves a lake and drains into another lake or river, the lake is an upstream lake. In Fig. 6b and c, point C and point F are outlets of their sub-catchments. 4. Indicating the oriented route of river segments from a source to a destination. Each river segment is an ori-ented vector. At each node of the river network, the number of river segments leaving the node can be zero or one, as illustrated in Fig. 6. Therefore, the oriented route from a source (glacier or lake outlet) to a des-tination can be determined using the following proce-dure. First, the river segment whose from-node coin-cides with the source begins the route. If the to-node of that river segment coincides with the from-node of another river segment, that river segment is added to the route. This process is repeated until the to-node of a river segment coincides with the destination. In Fig. 6a, for example, a route is mapped from source E to destination A. The route includes two segments (ED and DA), making point D the point of conjunc-tion. Similarly, the route from F to H in Fig. 6c consists of two segments (FD and DH).
The module outputs shapefiles in GIS polyline vector for-mat, with each polyline representing an oriented route from a source to a destination. The route’s attributes consist of the identification codes of the source and the destination. The module determines either a connection between a glacier at-tributed with a glacial code and a lake with a lake code or a connection between two lakes, each with its own lake code. Figure 7 shows the result of the module for the Kekexili catchment.
2.2.3 Calculating the area of a lake catchment (AC)
Based on the HydroSHEDS drainage basin data, we con-cluded that most of the catchments inside the inner Tibetan Plateau are closed catchments. Lake catchments that are not
closed belong to the catchments of one of the major rivers: Brahmaputra, Ganges, Indus, Irrawaddy, Mekong, Salween, Yangtze, or the Yellow River. Because HydroSHEDS only includes the shapes and areas of closed catchments or big river catchments, this study needed to explicitly determine the areas of lake sub-catchments, as follows.
Computing the area of a lake sub-catchment
The HydroSHEDS river data provides the number of up-stream grid cells of each river segment, as illustrated in Fig. 6. From this, the area of each lake catchment can be calculated as the product of grid cell size and total number of upstream grid cells of all river segments converging on the outlet of the lake. For each sub-catchment, the following steps have to be performed.
1. Obtaining the total number of upstream grid cells. For each lake, an outlet is determined by the module de-scribed above. Then, the total number of upstream grid cells is determined, by adding up the upstream grid cells derived from river segments draining into the out-let of the lake. In Fig. 6, for example, the total number of upstream grid cells flowing into an outlet is 1000 cells for sink A, 500 cells for sink H, 850 cells for out-let C, and zero for outout-let F. In the case of outout-let F, the area of the lake catchment was calculated manually us-ing ArcHydro, as mentioned in the discussion section below. For instance, the total number of grid cells rep-resenting the Yinma Lake catchment, as illustrated in Fig. 4b, is 3775.
2. Calculating grid cell size in meters.Grid cell size, in-cluding width and height, varies regularly depending on latitude. Grid cell size is approximated using the “haversine” formula (Sinnott, 1984) which takes this dependency into account:
a=sin2(1lat/2)+cos(lat1)·cos(lat2)·sin2(1lon/2) c=2·atan 2(√a,√1−a)
d=R·c
, (1)
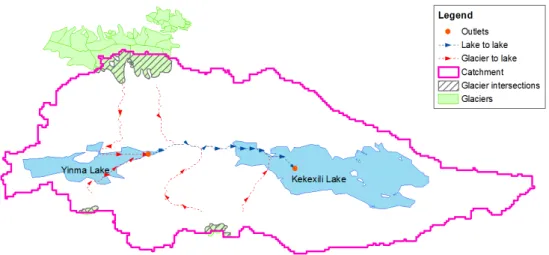
Fig. 7.Determination of the glaciers belonging to the Kekexili catchment, the runoff connections from glaciers to Yinma Lake and Kekexili Lake, and the flow from Yinma Lake to Kekexili Lake.
The Tibetan lake catchments may occupy large areas. The latitude of the outlet of the lake sub-catchment is used to compute grid cell size for the entire lake sub-catchment. For example, the outlet of the Yinma Lake catchment is located at 35.62 degree latitude. Therefore, grid cell size is estimated at 0.3766×0.6433 km. This results in an estimated area of ap-proximately 658.7 km2. Alternatively, the Yinma Lake catch-ment area can be derived from its geospatial boundary, as il-lustrated in Fig. 4b. This method also shows the area of the Yinma Lake catchment to be 658.7 km2.
Obtaining the area of a closed lake catchment
The area of closed Tibetan lake catchments can be deter-mined by three methods.
1. Taken directly from the attributes of the HydroSHEDS drainage basin data. For example, HydroSHEDS re-ports the Kekexili Lake catchment area as 2636.5 km2. 2. Calculated from grid cell size and total number of upstream grid cells. Similar to the computation of the area of the Yinma Lake sub-catchment above, grid cell size for the Kekexili Lake catchment is 0.3767×0.6433 km. The total number of grid cells in the Kekexili Lake catchment is 15 100. Therefore, the area of the Kekexili Lake catchment is approximately 2635.3 km2.
3. Calculated from its geospatial boundary. The Kekexili Lake catchment occupies an area of 2636.8 km2. The small differences in area derived from method two are caused by using one representative grid cell size. Bigger catchment areas actually include a range of grid sizes, de-pending on latitude. For highest accuracy, the rest of the pa-per derives the area of each closed catchment of a Tibetan lake directly from the drainage basin data.
2.2.4 Computing the total area of glaciers draining into a lake
Based on the distribution of the Tibetan glaciers as shown in Fig. 1, it is obvious that part of the glacier meltwater flows to some of the Tibetan lakes. A lake can collect glacier meltwa-ter directly from glaciers or indirectly via upstream lakes. For each lake, we therefore distinguish the total area of directly contributing glaciers (AGD) and the total area of upstream glaciers (AGU)draining into it.
AGD= n X
i=1
Ai (2)
AGU= n X
i=1 Ai+
m X
j=1
AGDj, (3)
whereAi is the area of theith glacier directly draining into the lake, andAGDj is the total area of glaciers contributing directly to thejth upstream lake flowing to the lake.
For example, 41.9 km2 of glaciers drain directly into Yinma Lake and 50.1 km2 into Kekexili Lake, as shown in Fig. 7. Because Yinma Lake is the only lake upstream of Kekexili Lake, the total area of upstream glaciers of Kekexili Lake equals 92 km2.
2.2.5 Determining the geometric dependency of a lake on glacial runoff
Table 1.Tibetan lakes with and without outlet.
Upstream Total surface area of Sink Total surface area of No. Catchment lakes upstream lakes (km2) lakes sink lakes (km2)
1 Brahmaputra 78 1535.3 3 53.6
2 Ganges 14 78.5 2 330.1
3 Indus 28 1333.5 5 212.7
4 Irrawaddy 0 0 0 0
5 Mekong 3 15.3 1 17.7
6 Salween 16 253.4 0 0
7 Yangtze 87 965.4 13 1157.9
8 Yellow River 56 2165.6 2 4170.1
9 Inner plateau 323 5949.0 260 20 560.7
Total 605 12 296.0 286 26 502.8
dependency of that lake on glaciers draining directly into it. The indicatorRUrepresents the geometric dependency of the lake on any upstream glaciers.
RD= AGD
AC
(4)
RU= AGU
AC
(5) Continuing the above example,RD for Yinma Lake equals 0.064, whileRD for Kekexili Lake equals 0.019. Since no glacier-fed lakes drain into Yinma Lake,RU equalsRD for Yinma Lake. As Yinma Lake is upstream of Kekexili Lake, RUfor Kekexili Lake is 0.035.
3 Results
After defining the geospatial objects and coding the proce-dures introduced above, we computedRDandRU, represent-ing the geometric dependency of a Tibetan lake on glaciers, for all the lakes on the Tibetan Plateau with an area over 1 km2. The result shows that 244 Tibetan lakes are directly fed by glaciers while 266 lakes have at least one upstream glacier, possibly buffered by an upstream lake. In addition, we include three case studies, studying the glacial depen-dency of three lakes: the Aksai Chin Lake in the North-Western Kunlun Mountain, the Nam Tso Lake 100 km north of Lhasa and the Yamdrok Lake in the south of Tibet.
3.1 Lakes with glacial runoff at the Tibetan Plateau
3.1.1 Classification of lakes with or without outlet
The Tibetan Plateau contains 891 lakes over 1 km2, occupy-ing a total area of approximately 38 800 km2; 150 of those lakes have an area of over 50 km2. In Table 1, the Tibetan lakes are divided into lakes with an outlet (upstream lakes) and without an outlet (sinks). As it turns out, over two-thirds of the Tibetan lake water is contained in sinks. On average,
these endorheic lakes are four to five times bigger than lakes with an outlet. In total, there are 96 sinks with an area of over 50 km2, 86 of which are located in the region called the inner plateau.
3.1.2 Geometric dependency of Tibetan lakes on direct glacier runoff
Based on the spatial distribution of glaciers and catchments, glacier area per catchment is shown in Table 2. In this pa-per, we only consider the major catchments of the Tibetan Plateau. According to Table 2, 25.3 % of the total glacier area drains directly into 244 lakes. These lakes consist of 133 upstream lakes and 111 sinks. Thus, 74.7 % of the total glacial area on the Tibetan Plateau directly drains into rivers, notably Brahmaputra, Ganges, Indus, Mekong, Yangtze, and Yellow River. On the inner plateau, 37.4 % of the glacier area drains directly into 160 lakes, mostly situated in the north and the northwest of the inner plateau. Within the Brahma-putra River catchment, 11.1 % of glacier area drains directly into its 33 lakes. The remaining glacier area, approximately 14 000 km2, eventually drains into the Brahmaputra River which passes through China, India and Bangladesh. Simi-larly, 96.6 % of glaciers attributed to the Mekong catchment, approximately 316 km2, eventually drain into the Mekong river, supporting fresh water for China, Myanmar, Laos, Thailand, Cambodia and Vietnam.
Fig. 8.The geometric dependency of Tibetan lakes on direct glacial runoff (RD).
Fig. 9.Tibetan lakes grouped by their level (%) of geometric depen-denciesRDandRUon glacial runoff.
top ten lakes ranked by total area of directly contributing glaciers.
3.1.3 Geometric dependency of Tibetan lakes on upstream glaciers
In addition to being directly fed by glaciers, a Tibetan lake can also be fed indirectly by glaciers, through upstream lakes. That is why we also determinedRUfor the 266 lakes, to show the geometric dependency of Tibetan lakes on up-stream glaciers. Figure 9 also shows the result of grouping the Tibetan lakes according to theirRU. About 75 % of the 266 lakes with at least one upstream glacier correspond have anRU of under 0.005. We also found 9 sinks and 13 lakes with runoff that are only indirectly fed by glaciers.
3.2 Case studies
The case studies below show the situation in the catchments of three lakes: Aksai Chin Lake, Nam Tso Lake and Yam-drok Lake. The Aksai Chin Lake closed catchment contains a small lake with highest geometric dependency on direct glacial runoff. The geospatial properties of this lake are char-acteristic for Tibetan lakes with highRD values. The Nam
Tso Lake closed catchment is included as a case study since it has been a pilot for many studies on lake water level change and water balance. Nam Tso Lake mostly depends on di-rectly contributing glaciers situated in the Nyainqentanglha Mountains. Finally, the Yamdrok Lake sub-catchment is sur-rounded by snow-capped mountains, but Yamdrok Lake de-pends much more on indirect glacial runoff via upstream lakes rather than from direct glacial runoff.
3.2.1 Aksai Chin Lake closed catchment
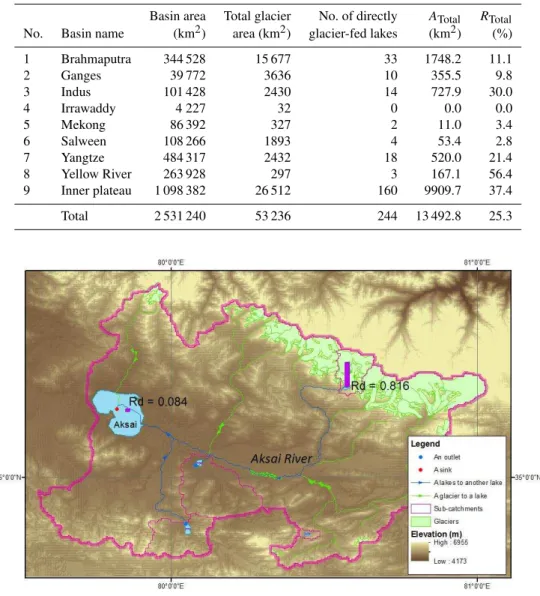
Aksai Chin Lake is a sink on the Aksai Chin plateau. The lake is located at 35.208◦N, 79.828◦E in the south of the Kunlun
Mountains. The Aksai Chin plateau is a vast high-altitude desert at an average elevation of 5500 m. Aksai Chin Lake is fed by Aksai River and many other streams, as illustrated in Fig. 10. The Aksai Chin Lake closed catchment occupies an area of about 8000 km2.AGD, the total area of glaciers drain-ing directly into Aksai Chin Lake, equals 673 km2. There is only one small lake upstream of Aksai Chin Lake.AGU, the total area of the glaciers upstream Aksai Chin Lake, is approximately 769 km2. Accordingly, itsRD value is 0.084 while itsRUvalue is 0.096. We conclude that the dependency of Aksai Chin Lake on glacial runoff is mostly direct, i.e. al-most not tempered by intermediate lakes.
The maximumRDvalue we found in this study, 0.816, be-longs to a relatively small lake in Aksai Chin Lake catch-ment, occupying only 2 km2. It is located at 35.293◦N,
80.572◦E at an altitude of approximately 5500 m in the
Table 2.Glacier area per basin on the Tibetan Plateau.ATotalis the total area of glaciers with direct runoff into a lake andRTotalis the ratio betweenATotaland the total glacier area.
Basin area Total glacier No. of directly ATotal RTotal
No. Basin name (km2) area (km2) glacier-fed lakes (km2) (%)
1 Brahmaputra 344 528 15 677 33 1748.2 11.1
2 Ganges 39 772 3636 10 355.5 9.8
3 Indus 101 428 2430 14 727.9 30.0
4 Irrawaddy 4 227 32 0 0.0 0.0
5 Mekong 86 392 327 2 11.0 3.4
6 Salween 108 266 1893 4 53.4 2.8
7 Yangtze 484 317 2432 18 520.0 21.4
8 Yellow River 263 928 297 3 167.1 56.4
9 Inner plateau 1 098 382 26 512 160 9909.7 37.4
Total 2 531 240 53 236 244 13 492.8 25.3
Fig. 10.The maximumRDvalue occurs at a small lake belonging to the Aksai Chin Lake closed catchment.
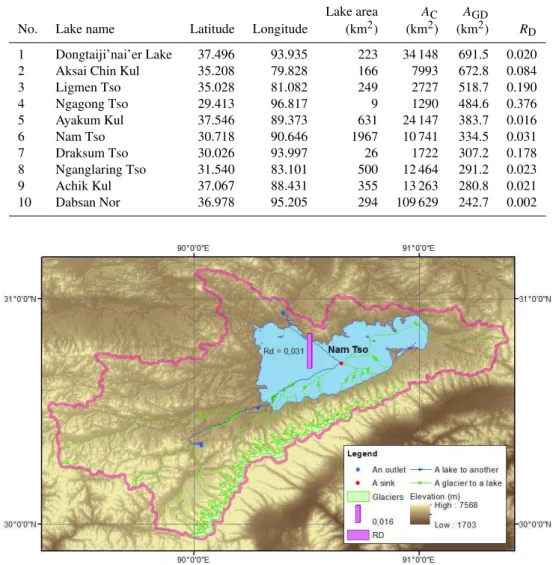
3.2.2 Nam Tso closed catchment
Nam Tso Lake, also called Nam Tso or Nam Co, is the largest salt lake on the Tibetan Plateau. The lake is located at 30.718◦N, 90.646◦E at an elevation of 4718 m and
occu-pies a surface area of about 1960 km2. Nam Tso is a sink at the foot of the Nyainqentanglha Mountains and is mostly fed by glaciers from these mountains. While Nam Tso has two small upstream lakes, no glacier drains into these smaller lakes. The Nam Tso closed catchment occupies an area of 10 741 km2, as shown in Fig. 11 while the total area of direct glaciers draining into Nam Tso is calculated as 334.5 km2. This makes it one of the top ten lakes directly fed by glaciers, as shown in Table 3. This gives it an RD value of 0.031, which indicates that over 3 % of the Nam Tso catchment is
covered by glaciers. ThisRD value can be considered rela-tively high, and shows a relarela-tively high dependency of Nam Tso on glacial runoff.
According to Krause et al. (2010), the sum of all wa-ter inflow to Nam Tso Lake resulted in an increase of the lake volume by 33.5 km3 for the period between Novem-ber 1961 and OctoNovem-ber 2010. This study computed the mean total annual inflow of water from glaciers into Nam Tso as 7.12 km3yr−1during the observed period, and indicated that this glacial meltwater is the largest contributor to the in-creased lake water volume. This was corroborated by anal-ysis of satellite laser altimetry data from between 2003 and 2009, which show that Nam Tso has a positive lake level trend of+23 cm yr−1 (Phan et al., 2012a) or
Fig. 11.Geometric dependency of Nam Tso Lake on glacial runoff.
reported that the glaciers from the Nyainqentanglha Moun-tains draining into the Nam Tso catchment were shrinking during the period 2001–2009, based on analysis of optical data from Hexagon KH-9 and Landsat MSS (both 1976), Metric Camera (1984), and Landsat TM/ETM+(1991, 2001, 2005, 2009).
Nam Tso is exceptional among the many lakes on the Ti-betan Plateau because it is relatively well studied. In our opinion, our analysis of Nam Tso indicates the potential of the approach of this paper. By correlating the geometric de-pendency of Nam Tso Lake on glacial runoff to other papers on water level, we can link glacial shrinkage and lake level increase. The possible significance of these links should be studied further for a large number of lakes.
3.2.3 Yamdrok Lake sub-catchment
Yamdrok Lake, also called Yamzho Yumco, is one of the largest lakes on the Tibetan Plateau. The lake is fan-shaped and occupies an area of about 640 km2. It is located at 28.979◦N, 90.717◦E at an elevation of about 4440 m on the
Fig. 12.Geometric dependency of Yamdrok Lake sub-catchment lakes on glacial runoff.
Yamdrok Lake a relatively highRU of 0.026. This means that Yamdrok Lake depends more on glacial runoff from up-stream lakes than on direct glacial runoff.
The geometric links also indicate that three nearby lakes, Bagyu, Gongmo and Phuma, flow into Yamdrok Lake, as shown in Fig. 12. Although no glacier directly feeds it, Bagyu Lake depends on glacial runoff through a nearby small lake with an RD of 0.004, giving Bagyu Lake an RU of 0.004. Yamdrok Lake has a high dependency on glacial runoff from Gongma Lake and Phuma Lake.
Gongmo Lake is another of the lakes upstream of Yam-drok Lake. The lake occupies an area of about 40 km2. It is located near the western end of Yamdrok Lake, at an alti-tude of 4500 m. The Gongmo Lake sub-catchment occupies an area of 620 km2, with 77.7 km2 of the area covered by glaciers. Therefore, the dependency of Gongmo Lake on di-rect glaciers is high, with anRDvalue of 0.125.
Phuma Lake, also called Puma Yumco, is a big upstream lake draining into Yamdrok Lake, as shown in Fig. 12. Phuma Lake occupies an area of about 285 km2, at an elevation of 5030 m. The lake is directly fed by meltwater from surround-ing mountains. The area of the Phuma Lake sub-catchment equals about 1815 km2. Our analysis indicates that the total area of glaciers draining directly into Phuma Lake is about 153 km2, indicating Phuma Lake also depends highly on di-rect glacial runoff, corresponding to anRDvalue of 0.084.
4 Discussion
In this discussion chapter, two topics are considered. First, we discuss how the geometric links we quantified between glaciers and lakes are expected to contribute to further
understanding of the hydrological mass balance of the Ti-betan Plateau. The second part gives more details on several technical aspects, such as input data, computation times and the non-standard processing steps that were necessary to ar-rive at the results presented above.
4.1 The hydrological interpretation of geometric dependency on glacial runoff
Because of the high relief of the Tibetan Plateau, elevation dominates the hydrological processes that influence mass balance. This high relief also makes it more difficult to assess the state of mass balance from remote sensing data, when compared to monitoring the mass balance of the relatively flat Greenland and Antarctica ice sheets (Radic and Hock, 2011). Recent work, however, showed two things: how to gather information on water level variations for many Tibetan lakes (Zhang et al., 2011; Phan et al., 2012a), and how to collect data on glacier mass changes on the borders of the Ti-betan Plateau (Kaab et al., 2012). It was also shown that lake levels vary per season and per location (Phan et al., 2012b), in a way that is not directly understandable without further information. State-of-the-art modeling results of the hydro-logical mass balance of the Tibetan Plateau relies on an un-derlying grid of surface runoff with a grid size in the order of 5 km (Immerzeel et al., 2010).
Fig. 13.The lake sub-catchments, belonging to the Palku Lake closed catchment, are manually created using ArcHydro.
flow on the Tibetan Plateau is also largely determined by el-evation differences, and a large part of the groundwater flow will also end up in lakes. Estimating discharge due to melt-ing has already successfully been attempted at smaller scale. Krause et al. (2010), for example, used a degree day factor approach to estimate the mean total annual inflow of glacier meltwater into the Nam Tso Lake at 7.12 km3yr−1during the period between 1961 and 2010. Similarly, Zhou et al. (2010) also used a degree day model to study how changes in air temperature and precipitation from 2007 to 2008 affected glacier runoff from Zhadang glacier runoff in the Nam Tso Lake basin. To quantify each lake’s potential inflow of glacial meltwater, we determine theRD(geometric dependency of a lake on direct glacial inflow). Clearly, glaciers buffered by an upstream lake may also have impact on a downstream lake’s water balance, but only in an indirect way. Therefore, we distinguish between direct and indirect inflow by deter-mining a separateRUvalue (geometric dependency of a lake on both direct and indirect glacial inflow). Further research is expected to show to what extent the difference in depen-dency on glacial meltwater can explain differences in lake level variations.
A second goal of the work in this paper is to facilitate and further constrain future hydrological modeling efforts. This
work shows in detail how to create a surface runoff grid for the Tibetan Plateau, including lakes, rivers and glaciers, at a resolution of an unprecedented∼400 m. Combining this hydrological model with existing and new empirical results on the mass balance of lakes and glaciers is expected to re-sult in new and more accurate hydrological mass balance predictions.
4.2 Details on computing the geometric dependency of lakes on glacial runoff
4.2.1 Sensitivity of the results
In this paragraph, we discuss how the results presented in this paper depend on the quality of the different data sets and on the processing.
The MODIS land-water mask
Fig. 14.Description of the low resolution of the HydroSHEDS rivers superimposed over the MODIS lakes.
errors affecting the shape of the lake polygons. For exam-ple, there are cases where two different lake polygons rep-resent the same lake, e.g. Yamdrok Tso or Pang Gong Tso, and, vice versa, where different lakes are included in one lake polygon, e.g. Chibchang Tso and Mitijiangzhanmu Tso. Ex-cept for permanent lakes, the MODIS land-water mask also contains some small seasonal lakes. In addition, the mask contains many small polygons representing parts of rivers.
The Tibetan lake layer, used in this paper, was derived from the MODIS land-water mask. It is stored in shapefile format and is the product of a previous study (Phan et al., 2012a). All lake outlines were checked and river remains were removed with the support of Google Earth and one set of Landsat TM data. The Landsat TM image data used as reference was acquired in 2002 and 2003 which corresponds to the acquisition of the data used for the MODIS land-water mask. We believe that the number of remaining errors in the lake mask is quite small, also because most elevations con-sidered now are already unambiguously representing a lake surface of a known lake, compare also Phan et al. (2012a).
The HydroSHEDS river data derived from SRTM
SRTM data are used to generate the HydroSHEDS data sets at 3 arc second resolution (approximately 90 m at equator). With a pixel size of∼90 m, the SRTM data represent a dig-ital topographic map of the Earth’s land surface. Note that at 90 m resolution it is possible that some river channels run-ning in for example, a canyon, are not well represented. This may in some cases result in incorrect channel representa-tions in derived products, such as the HydroSHEDS prod-uct. The SRTM data has an absolute horizontal accuracy of below 20 m and a relative vertical accuracy of less than 10 m (Bamler, 1999; Zandbergen, 2008). The HydroSHEDS data sets including stream networks, watershed boundaries, drainage directions and ancillary data layers such as flow accumulations, distances and river topology information are derived from SRTM DEM, basically using an eight-direction (D8) flow model (O’Callaghan and Mark, 1984). The D8 method estimates surface flow in gridded digital terrain mod-els by systematically tracking 8 possible directions from a candidate pixel to one of its eight neighbors. This method works well when the direction of steepest descent is well-defined. Errors in the elevation data and lack of relief may therefore result in wrong channel locations, or even in locally wrong flow directions. The level of detail of these hydrologic
data sets depends on the minimum number of accumulation upstream pixels that is used to create a stream or a river segment.
Based on the river network and the location of a lake, the outlet of each lake catchment is defined as a point inside the lake region. If river segments all stream to the intersection point inside the lake polygon, the lake has no outflow. The intersection point is considered a sink of a closed catchment. If one river segment has the from-node inside and the to-node outside a lake, the lake has an outflow. The from-to-node of the river segment is considered the outlet of a lake sub-catchment. By applying this rule, we could identify the out-lets of most of the 891 Tibetan lakes. The outout-lets of some lakes are not automatically determined due to the low resolu-tion of the river network, as described in Fig. 14. These lakes were marked and checked manually. If glaciers occur in the lake’s catchment, we manually created a detailed drainage network of the lake’s area in ArcHydro, as described in the Sect. 4.2.2.
The low resolution of SRTM has for example affected the connection between Chibchang Tso Lake and Miti-jiangzhanmu Tso Lake (Appendix). In reality, these lakes are connected by a small channel, as shown in Fig. 15. However, the HydroSHEDS catchment data, derived from SRTM, rep-resent Chibchang Tso Lake and Mitijiangzhanmu Tso Lake as sinks in two separate closed catchments. The mean alti-tude of Mitijiangzhanmu Tso is 4938.1 m while the mean al-titude of Chibchang Tso is 4933.4 m, according to SRTM. It is quite possible that in reality these two lakes connect to a lake during part of the year. It should be further investigated.
The flat outlets
Fig. 15.Effect of the low resolution of SRTM in the separation of Chibchang Tso and Mitijiangzhanmu Tso into two closed catchments derived from the HydoSHEDS drainage basins when overlaid on Google Earth.
The HydroSHEDS river network is susceptible to various errors, foremost in flat regions, including lake surfaces. In fact, river segments inside a lake polygon are still oriented. This can affect the location of the outlet of a lake. Further-more, the vertical error of SRTM can influence the orienta-tion of a river segment. Of the 311 pairs, there are 99 in which the difference in mean elevation between two linked lakes is less than 20 m. It is noticed that 33 of such 99 pairs are di-rectly dominated by glaciers. Thus, if some of the links orient inversely by the elevation error, the corresponding indicator values (RU)of geometric dependency of the linked lakes are affected.
The seasonal variations
In this paper, we use the Tibetan lake layer, as produced for a previous study in which Phan et al. (2012a) removed small seasonal lakes or empty depressions from the MODIS land-water mask. However, as a result of the drainage network analysis, we also found 140 sinks without permanent lake, according to the MODIS land-water mask. Most of them are in the northern Tibetan Plateau. It is possible that these sinks correspond to seasonal lakes that may be empty in winter and with water in summer by rainfall and snow melt.
The deformations in the glacier mask
Recent studies report that the total glacier area on the Ti-betan Plateau is shrinking. This affects the indicator values RDandRUbecause the total area of glaciers directly and in-directly draining into a lake changes. In this paper, the area of each glacier, derived from the CAREERI glacier mask,
is determined based on both remote sensing and in situ data from 1978 to 2002. Thus, the indicator valuesRD andRU represent the geometric dependency of the Tibetan lakes on glacial runoff in 2002. Therefore, in order to determine the indicator values RD andRU in later years, the rates of re-treat in glaciers can be used to re-compute the area of each glacier. These rates are reported in recent literatures for indi-vidual regions on the Tibetan Plateau. For example, Wang et al. (2011) estimated a retreat in glacier area of 21.7 % in the Middle Qilian Mountain region from 1956 to 2003. Thus, the area of each glacier in this region can decline 4.6 % in 2012. Subsequently, the indicator valuesRD andRU at the lakes dominated by glaciers in this region have a reduction of 4.6 % in 2012 as well.
4.2.2 Manually calculating the area of lake sub-catchments using ArcHydro
As mentioned in Sect. 2.2.3, the area of a lake sub-catchment is the product of its grid cell size and the total number of grid cells draining into its outlet. Due to the limited resolu-tion of the HydroSHEDS river network, the outlet of a lake sub-catchment can be just one of several sources of a river network, e.g. outlet F in Fig. 6c. In this particular case, the total number of grid cells cannot be determined automatically from the HydroSHEDS data. However, the area of a lake sub-catchment can also be calculated based on its geometric shape. The ArcHydro extension of ArcGIS supports manual outlining of catchments from a digital elevation model.
19 such lakes directly fed by glaciers. First, we clipped the terrain data for the 19 lake regions from the HydroSHEDS DEM. Second, we created small catchments by following the ArcHydro user guide. For this purpose, a threshold of 30 upstream drainage grid cells is used to define a river seg-ment, to improve the level of detail of the river network. This threshold also means that this manual outlining will only pro-duce catchments with an area of at least 30 grid cells. Subse-quently, for each lake, we determined the lake sub-catchment by merging the small catchments draining into its outlet, as illustrated in Fig. 4. Finally, the catchment area was obtained directly from its geometric shape. As an example, the geo-metric shapes of the three small lake sub-catchments in the south of the Palku Lake basin are shown in Fig. 13.
4.2.3 Dividing the Tibetan Plateau into parts for speeding up computations
The Tibetan Plateau is large, so it takes a long time to run the drainage network analysis module and determine con-nections between glaciers and lakes. When the module was run on a desktop with a 3.2 GHz CPU and 2 GB RAM or on a laptop with a 2.2 GHz Core 2 Duo CPU and 4 GB RAM, it took 4 or 5 days to process the data for the whole Tibetan Plateau. Sometimes the process stopped altogether. Although the river network is organized per catchment, a large amount of PC memory is required to find a route of river segments for each glacier. This holds especially for the major catchment of Brahmaputra River, which occupies a large area and has a densely spread river network. To complicate calculations, most of the glaciers inside the Brahmaputra major catch-ment do not drain into the outlet of any lake catchcatch-ment. To more efficiently calculate the total area of directly contribut-ing glaciers draincontribut-ing into each lake on the whole plateau, we divided the plateau into sub-areas, grouping some closed catchments on the inner plateau. As a consequence, we had to run the module several times to manually determine connec-tions between glaciers and lakes. In addition, for each major river catchment we created several virtual outlets in the river network to reduce computation time. Then we used the mod-ule to make connections between the virtual outlets, the way it is also used to make connections between lakes. Finally, we found the connections between glaciers and lakes in each major catchment by combining routes from glaciers to out-lets and between outout-lets.
5 Conclusions
In this paper, we calculate for each lake larger than 1 km2 on the Tibetan Plateau (891 in total) how much it is geo-metrically dependent on glacial runoff. The results show that 244 of these lakes receive direct runoff from glaciers while another 22 lakes only obtain glacial meltwater buffered by upstream lakes. The ratio between the total area of glaciers
draining into a lake and the area of its catchment (RD) rep-resents the dependency of a lake on glacial runoff. Geomet-ric connections between glaciers and lakes are determined based on drainage network analysis. From this, the total area of directly contributing glaciers or the total area of upstream glaciers draining into a lake is computed. This geometric dependency is a first proxy for the actual dependency of a lake on glacial runoff. Our results clearly list which lakes are more or less dependent on glacial runoff and therefore in-dicate which lakes are expected to be strongly affected by the predicted further shrinkage of the glaciers on the Tibetan Plateau.
Supplementary material related to this article is
available online at http://www.hydrol-earth-syst-sci.net/ 17/4061/2013/hess-17-4061-2013-supplement.pdf.
Acknowledgements. This work was jointly supported by the
EU-FP7 project CEOP-AEGIS (grant number 212921) and by the Vietnam Ministry of Education and Training.
Edited by: M. Werner
References
Bamler, R.: The SRTM mission – A world-wide 30 m resolution DEM from SAR interferometry in 11 days. Proceedings of the 47th Photogrammetric Week ’99, Wichmann Verlag, Heidelberg, Germany, 145–154, 1999.
Bolch, T., Yao, T., Kang, S., Buchroithner, M. F., Scherer, D., Maus-sion, F., Huintjes, E., and Schneider, C.: A glacier inventory for the western Nyainqentanglha Range and the Nam Co Basin, Ti-bet, and glacier changes 1976–2009, The Cryosphere, 4, 419– 433, doi:10.5194/tc-4-419-2010, 2010.
DeBarry, P. A.: Watersheds: Processes, Assessment and Manage-ment, John Wiley & Sons, Inc., (Chapter 1), 2004.
Gardelle, J., Berthier, E., and Arnaud, Y.: Slight mass gain of Karakoram glaciers in the early twenty-first century, Nat. Geosci., 5, 322–325, doi:10.1038/NGEO1450, 2012.
GLCF: MODIS Water Mask, available at: http://landcover.org/data/ watermask, last access: 12 December 2012.
Immerzeel, W. W., Van Beek, L. P. H., and Bierkens, M. F. P.: Cli-mate change will affect the Asian water towers, Science, 328, 1382–1385, 2010.
Kaab, A., Berthier, E., Nuth, C., Gardelle, J., and Arnaud, Y.: Contrasting patterns of early twenty-first-century glacier mass change in the Himalayas, Nature, 488, 495–498, 2012.
Krause, P., Biskop, S., Helmschrot, J., Flügel, W.-A., Kang, S., and Gao, T.: Hydrological system analysis and modelling of the Nam Co basin in Tibet, Adv. Geosci., 27, 29–36, doi:10.5194/adgeo-27-29-2010, 2010.
Sinnott, R. W.: Virtues of the Haversine, Sky Telescope, 68, p. 159, 1984.
Sorg, A., Bolch, T., Stoffel, M., Solomina, O., and Beniston, M.: Climate change impacts on glaciers and runoff in Tien Shan (Central Asia), Nature Climate Change, 2, 725–731, 2012. USGS: Hydrological data and maps based on Shuttle Elevation
Derivatives at multiple Scales, available at: http://hydrosheds.cr. usgs.gov/index.php, last access: 12 December 2012.
Wang, P., Li, Z., and Gao, W.: Rapid shrinking of glaciers in the Middle Qilian Mountain region of Northwest China during the last∼50 years, J. Earth Sci., 22, 539–548, 2011.
Wang, X., Gong, P., Zhao, Y., Xu, Y., Chang, X., Niu, Z.,Luo, Z., Huang, H., Sun, F., and Li, X.: Water-level changes in China’s large lakes determined from ICESat/GLAS data, Remote Sens. Environ., 132, 131–144, 2013.
F.: Monitoring lake level changes on the Tibetan Plateau using ICESat altimetry data (2003–2009), Remote Sens. Environ., 115, 1733–1742, 2011.
Zhang, G., Yao, T., Xie, H., Kang, S., and Lei, Y.: Increased mass over the Tibetan Plateau: From lakes or glaciers?, Geophys. Res. Lett., 40, 2125–2130, doi:10.1002/grl.50462, 2013.
Zhang, Y., Liu, S., Xu, J., and Shangguan, D.: Glacier change and glacier runoff variation in the Tuotuo River basin, the source re-gion of Yangtze River in western China, Environ. Geol., 56, 59– 68, 2008.