141
SPATIAL DISTRIBUTION OF THE AVERAGE RUNOFF IN THE
IZA AND VI EU WATERSHEDS
HORVÁTH CS. 1, RÉTI KINGA-OLGA 2, BILA CO T. 3, RO IAN GH. 4
ABSTRACT –Spatial distribution of the average runoff in the Iza and Vi eu watersheds. The average runoff represents the main parameter with which one can best evaluate an area’s water resources and it is also an important characteristic in al river runoff research. In this paper we choose a GIS methodology for assessing the spatial evolution of the average runoff, using validity curves we identifies three validity areas in which the runoff changes differently with altitude. The tree curves were charted using the average runoff values of 16 hydrometric stations from the area, eight in the Vișeu and eight in the Iza river catchment. Identifying the appropriate areas of the obtained correlations curves (between specific average runoff and catchments mean altitude) allowed the assessment of potential runoff at catchment level and on altitudinal intervals. By integrating the curves functions in to GIS we created an average runoff map for the area; from which one can easily extract runoff data using GIS spatial analyst functions. The study shows that from the three areas the highest runoff corresponds with the third zone but because it’s small area the water volume is also minor. It is also shown that with the use of the created runoff map we can compute relatively quickly correct runoff values for areas without hydrologic control.
Keywords: runoff, Maramureș, GIS, spatial analyst.
1. INTRODUCTION
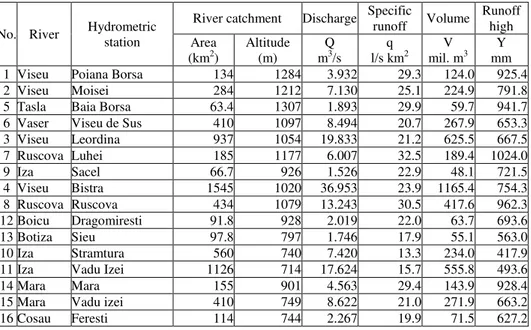
The average runoff analysis is the most practical way of assessing water resources in a particular area. Its spatial distribution is particularly useful in evaluating and sizing water management works. In its quantitative characterization we use several base elements such as average discharge (Q, m3/s), runoff volume (V, m3), runoff height (Y, mm) or specific average runoff (q, l/s.km2) (Sorocovschi, 1986) (Table 1).
The study area includes much of the Maramureș basin and also the corresponding mountainous area of the Vișeu and Iza rivers watershed. In the present study we used data from 16 hydrometric stations, eight within each analyzed basin, covering a period of almost 40 years (1968-2006).
Analysis of the average runoff in the study area was performed using MS Excel by mathematical analysis of the primary raw monthly data, while for the spatial analysis we used the ESRI group GIS programs. In the spatial analysis we
1, 3Babeş
-Bolyai University, Faculty of Geography, Cluj-Napoca, Romania E-mail: [email protected]; [email protected]
2,4 Babeş
142 model, runoff) databases.
In order to generalize spatially the average annual runoff we established a relationship between the average specific discharge values of the hydrometric stations and the mean catchment altitude controlled by them (Table. 1).
Table 1.Multiannual runoff characteristics (1968-2006)
2. STUDY AREA
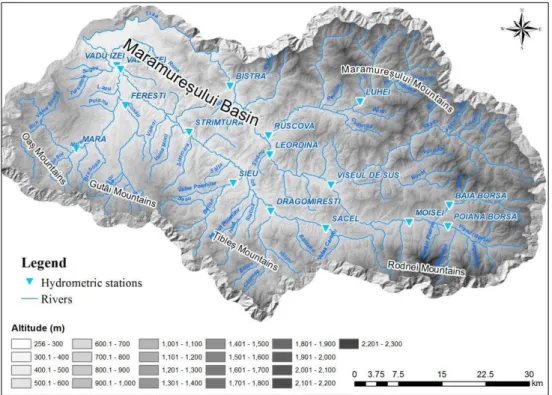
The analyzed area overlaps the Maramureș basin and the neighboring mountain area, which includes the north-eastern slope of the volcanic Oas – ibleş Mountains, the northern flank of the Rodna Mountains and southwestern flank of Maramureș Mountains (Fig. 1). The geographical position of the basin and also the river system layout favors a matter and energy flow conveyed by the surface and groundwater from the adjacent mountain area, so from the mountain edge appears a relief characterized by glacis and piedmont deposits which encloses a significant water resource in the region (Sorocovschi & Cocut, 2008).
The landscape has a direct influence on the river runoff organization embodied by the slope and landscape fragmentation, specific features that determine the specific runoff speed and an indirect influence through the vertical zoning of climate. The main collector is the Upper Tisza Basin, the Vișeu and Iza tributaries flow in the SE-NW direction. The hydrographic network is dense reaching values of 0.8 and high slopes of the rivers shows a high theoretical hydropower potential (Sorocovschi, 1994).
No. River Hydrometric station
River catchment Discharge Specific
runoff Volume Runoff
high Area
(km2)
Altitude (m)
Q m3/s
q l/s km2
V mil. m3
143
Fig. 1.Vișeu and Iza Rivers watersheds
3. DATA AND METHODS
The analysis of the average runoff was performed based on monthly data from 16 stations in the study area. Average monthly discharge values were converted into annual and then multiannual runoff, values thus obtained was expressed in specific runoff to compare runoff values from different sized catchments.
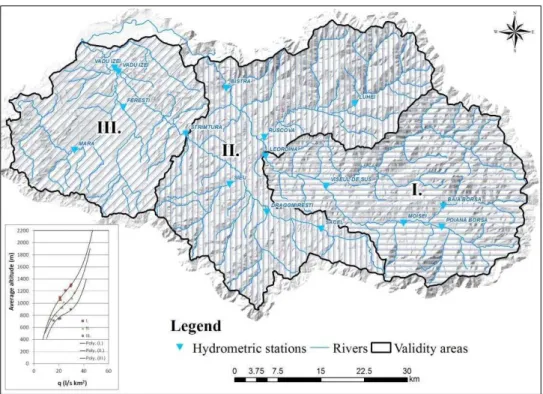
To analyze spatially the specific runoff thus obtained we choose the validity curves methodology. So we looked for correlations (validity curves) between specific runoff values from hydrometric stations and average altitude of the stations catchment (Fig. 2). To these curves in the study are correspond validity areas in which the average runoff values growth with the altitude is done differently. Validity curves were chosen by the CurveFinder analysis of the CurveExpert program; analysis which choses the best correlation curves also shows the identified function equation.
144
Fig. 2. Validity area map and the correspondent correlations between the specific runoff and the average altitude
From the GIS program group we used the “Spatial analyst” module, where the Raster Calculator function makes possible the integration of mathematic equations into GIS (Bilaşco et al.2009). For the study area average general runoff map we used the Mosaic to New Raster function from the Data Management Tools/Raster toolbox and with its help we managed to merge the three specific runoff raster which were computed separately for every validity curve and the correspondent areas digital elevation model.
4. RESULTS
145
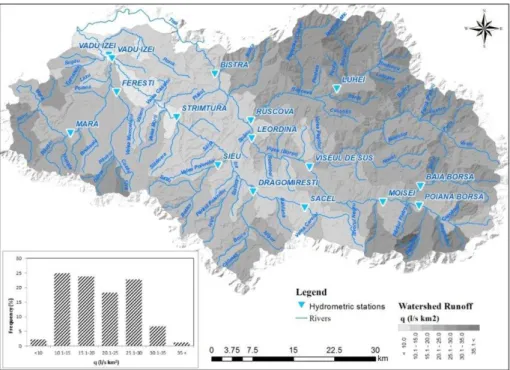
Fig. 3. Watersheds and sub-watersheds specific average runoff map and statistics
146
of the Iza River, its most representative sub catchment is Mara, with only 22% of the water volume because it has the smallest surface only 25% of the whole area.
The spatial distribution of runoff was monitored at catchment level (Fig. 3) and also at altitudinal intervals (Fig. 4).
Regarding the watersheds runoff we opted for the analysis of all sub-basins larger than 5 km2, so there were chosen 84 areas and 2 inter-basinal zones on each main collector.
The analysis was performed using the Spatial Analyst Tools/Zonal Statistics function, which trough averaging the specific runoff map (Fig. 4) allows the extraction of runoff data corresponding to each area. Thus of the 86 areas 60% fall below 05 m3/s and 25% between 0.5-1 m3/s, we find only 6 catchments with higher discharge values of 2 m3/s. The highest runoff values are linked to the largest watershed area of course and so the biggest discharge values are recorded in the Ruscova (10.944 m3/s), Mara (8.533 m3/s) and Vaser (9.303 m3/s) basins.
We observe in these values a correlation between the mathematic calculation and the GIS analysis, after analyzing the areas of the different catchments it highlighted the GIS analysis accuracy, the values obtained maintain in the hydrological acceptable error margins. For this we give as example the Vadu Izei station on the Mara River where the multiannual average discharge is calculated at 8.622 m3/s and the runoff value extracted from the map by GIS methodology is 8.533 m3/s, so the corresponding error is only 1%.
The runoff analysis on altitudinal ranges (Fig. 4) emphasizes once again the importance of the surface area in the water resource calculation, so although the richest specific runoff are recorded at the highest altitudes, the maximum water volume is found at the 900-1100 altitude interval where there are necessary areas to collect water.
5. CONCLUSIONS
147
climate conditions prevail in the runoff formation with mainly alimentation from precipitation and in the spring with a significant snow contribution from melting’s on the northern slope of the Oaș-Gutâi Mountains. The specific runoff analysis at river catchment level highlights the surface-altitude correlation and also the runoff’s alimentation importance; one can also observe the significant differentiation between the Maramureș Basin area, including the interbazinal hills and the Mara-Săpân a Piedmont with average low runoff values and the mountainous area represented mainly by the Maramureș Mountains with calculated average high specific runoff.
So we can conclude that the analysis of the river runoff in the Iza and Viseu catchments highlighted three areas in which runoff values evolve differently. The three identified validity curves present the different runoff variation in accordance with the altitude changes. Integrating these mathematical functions in the GIS analysis facilitates the spatial analysis of the runoff also enables in areas without hydrometric control the calculation of potential water resources.
Acknowledgment
This work was perform in the frame of NATO SfP 984440 Project, founded by NATO Science for Peace and Security Programme
REFERENCES
1. Bilaşco, St., Horváth, Cs., Cocean, P., Oncu, M. (2009), Implementation of the Usle Model Using GIS Techniques. Case Study: The Someş Plateau, Carpathian Journal of Earth and Environmental Science, vol. 4, No. 2, p. 123–132.
2. Diaconu C., Şerban P. (1994), Sinteze şi regionalizări hidrologice, Edit.Tehnică, Bucureşti
3. Horváth Cs, Buimaga-Iarinca St, Rosian G, (2011), Flow Regimes Spatial Variability, Conferinta Aerul si Apa Componente ale Mediului, Edit. Presa Universitara Clujana, p. 313-319
4. Horváth Cs, Pop Oana Antonia, (2009), Assessing the average multi-annual runoff in the Tur River Basin, Geographia Napocensis , Cluj-Napoca, p.25-31
5. Pop Oana Antonia, Horváth Cs, (2010), Scurgerea anotimpuală în bazinul Tur, Aerul si Apa Componente ale Mediului, Presa Universitara Clujana, p. 294-298 6. Sorocovschi, V. (1986), Poten ialul scurgerii medii anuale a râurilor din nord –
vestul Carpa ilor Orientali, Probleme de Geografie aplicată, Univ. din Cluj – Napoca, Facultatea de biologie, geografie şi geologie, – 83, Cluj
7. Sorocovschi, V. (1994), Diferen ierea altitudinală a scurgerii râurilor din lan ul
neoeruptiv Oaş – Gutâi – ibleş, Studia Univ. “Babeş-Bolyai”, Geogr., 2, p.53-57,
Cluj.
8. Sorocovschi, V., Cocu , M. (2008), Regimul scurgerii apei râurilor din Depresiunea Maramureşului şi spa iul montan limitrof, Geographia Napocensis, an.II, 2, Casa Căr ii de Ştiin ă, p.37-49, Cluj-Napoca
9. Ujvari, I. (1972), Geografia apelor României. Edit. Ştiin ifică, Bucureşti
10. *** The Digital Elevation Model over Europe from the GMES RDA project