www.adv-geosci.net/11/57/2007/ © Author(s) 2007. This work is licensed under a Creative Commons License.
Geosciences
Information system “BW Abfluss”: regionalisation of flood, mean
and low flow parameters
A. S. Blatter, J. Liebert, P. A. Preuss, J. Szabadics, and J. Ihringer
Institute of Water and River Basin Management (IWG) (http://www.iwg.uni-karlsruhe.de), Universit¨at Karlsruhe (TH), Germany
Received: 16 January 2007 – Revised: 11 April 2007 – Accepted: 15 May 2007 – Published: 1 June 2007
Abstract. On behalf of and in close collaboration with the institution of environment, measurements and conservation of the federal state of Baden-W¨urttemberg (Landesanstalt f¨ur Umwelt, Messun-gen und Naturschutz Baden-W¨urttemberg/LUBW/ see http://www.lubw.baden-wuerttemberg.de/) an innovative regionnalisation concept has been developed. This concept allows the supply of flood, mean or low flow parameters for 10 790 sites in Baden-W¨urttemberg and an evaluation of the predicted impact of climate change on the flood situation.
The extensive data basis for this regionalisation concept with numerous input parameters and varied result reporting made it necessary to select an appropriate database structure. New software was developed to help with the calculations, notably for:
– upgrading the official areal water system register (Gew¨asserkundliches Fl¨achenverzeichnis/GKFV)
– proofing tools to maintain consistency
– automatic parameter derivation with the software ESRI© ArcInfo.
The results were published in electronic form and included a stand-alone geo-information software for easy and fast re-trieval of data and results.
The objective of this article is to describe the implementa-tion of these new concepts for coupling Geographic Informa-tion System (GIS) and database needs to reach the identified requirements.
1 Introduction
To design water engineering structures and to evaluate the flood risk along natural watercourses, the knowledge of
Correspondence to:K. Remmler or A. S. Blatter ([email protected] or [email protected])
flood, mean or low flow parameters is required area-wide. To allow sustainable design of flood-protection measures, in-cluding strategies for their operation, the estimation of the future development of flood flows was also included. Thus, the predicted impact of climate change has been taken into account.
To meet these demands for 10 790 sites of the river net-work in the federal state of Baden-W¨urttemberg, Germany (36 000 km2), an innovative regionalisation concept was de-veloped at the Institute of Water and River Basin Manage-ment of the Universit¨at Karlsruhe (TH). The regionalisation concept for the flood, mean or low flow parameters bases on a multiple, linear regression approach, which is an extension of the formula of WUNDT (1953):
ln(Y )=C0+C1×ln(P1)+C2×ln(P2+1)+C3×ln(P3+1)
+C4×ln(P4)+. . .+C8×ln(P8) (1) Y is the relevant flood, mean or low flow parameter. The val-uesP1toP8represent appropriate catchment parameters like catchment area, percentage of urban area, percentage of for-est area, weighted slope, channel-segment lengths, charac-teristic channel-segment lengths, average annual rainfall and landscape factor.
The corresponding regression coefficients have been fitted by using the results of statistical analyses of more than 400 long-term flow series from the available gauges in the project area.
In a study called KLIWA a method has been developed to fix climate factors against different return periods and differ-ent “climate regions” of Baden-W¨urttemberg. A detailed de-scription of the method is published in Arbeitskreis KLIWA (2004).
By allocating a catchment to such a “climate region”, it is now possible to get values for the climate factors for floods of different return periods.
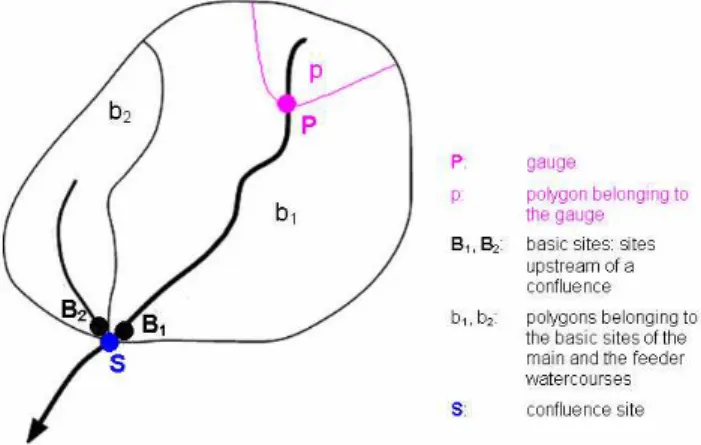
Fig. 1.Definitions of sites.
sites of the GKFV, 3380 confluence sites of those basic sites, 448 gauges and 155 special interest sites (definition of sites: see Fig. 1).
In order to i) determine and manage the regionalisation parametersP1toP8for all these sites ii) calculate the several flood, mean or low flow parameters iii) ascertain the climate factors and iv) publish the extensive result data required a tool to link the specific GIS and the database.
The objective of this article is to describe the implemen-tation of these new concepts for coupling GIS and database needed to reach the identified requirements.
2 Database and data preparation
To implement the ambitious project objectives, a specific conceptual design was selected for the GIS related parts. In the course of the project, several specific developments in the processing and visualisation of GIS have been made. The extensive data basis for the regionalisation concept and the numerous result parameters made it necessary to consider a distinctive database structure.
The most interesting strategies and developments are ex-plained and discussed in detail in the following descriptions. 2.1 Realisation of the database
The detailed derivation of the different flood, mean or low flow parameters and, also, the climate factors for the gauges can be found in:
– Ihringer et al. (2005) for the floods of different return periods (HQ2–HQ100,f200–f10 000)
– Ihringer et al. (2004) for the mean flow (MQ) and low flow value (MNQ)
– Arbeitskreis KLIWA (2004) and in Arbeitskreis KLIWA (2006) the derivation of the climate fac-tors (fK,2–fK,1000) to consider the predicted climate change.
The most important geographical data for the actual inves-tigation is represented by the GIS layer which describes the official areal water system register (GKFV). In accordance with the guidelines of the LUBW, this layer was substantially refined.
First, the geographical information of the former version of the GKFV was stored in a data type called Coverage of ESRI© ArcInfo. The official identification number (ID) of the basic sites of the former GKFV was annotated in the at-tribute table of the polygon layer (always the upstream adja-cent polygon got the number of the basic site).
The data type Coverage provides the capability to record several layers which are linked with each other in one sin-gle dataset. Furthermore, it allows the aggregation of several polygons to a “Region” which is retained in a new layer.
The big advantage of defining Regions, is to run routines for generating a layer that describes catchments by aggregat-ing the upstream polygons of a site automatically.
The ability to link several layers allows the modification of a boundary of a catchment on the arc layer so that all the other layers which will always include polygon layer, and may include Region layer(s) based on that arc layer, are al-tered simultaneously.
The upgrading process itself is described in Subsects. 2.2 and 2.3.
For deriving the percentage of urban and forest area for the catchments, a grid based on the Landsat-TM survey of the year 1993 (land use for 16 categories) has been used. This grid has been produced by the Institute for Photogramme-try and Remote Sensing (Institut f¨ur Photogrammetrie und Fernerkundung) of the Universit¨at Karlsruhe and the RIPS-Pool of the institution of conservation of the federal state of Baden-W¨urttemberg (Landesanstalt f¨ur Umweltschutz Baden-W¨urttemberg/LfU) in 1996.
A digital elevation model (sink filled, edge length of 50 m) has been applied for calculating the corresponding weighted slopes, channel-segment lengths and the charac-teristic channel-segment lengths. This grid was supplied by the survey administration of the federal state of Baden-W¨urttemberg (Landesvermessungsamt Baden-Baden-W¨urttemberg) in 1990. At the borders it has been complemented by annex-ing digital elevation models of Switzerland and the federal states of Hesse and Bavaria.
To derive the values for the average annual rainfall, a grid called Quartal-Rasterdaten, with a grid size of 1000 m, has been applied. This grid was produced by the German Weather Service (DWD) in 1995 and by the RIPS-Pool of the LfU in 1996.
Rohstoffe Baden-W¨urttemberg) and the RIPS-Pool of the LfU in 1996.
2.2 Interactive management tool to upgrade the official areal water system register (GKFV)
Before applying the GKFV for the purposes of the regional-isation efforts in the federal state of Baden-W¨urttemberg, a further subdivision from former∼2500 basic sites to actual
∼7000 basic sites took place. This GKFV applies a unique 13-digit number (GKFV-ID) that refers to the unique and hi-erarchical watercourse identification number (river ID). The GKFV-IDs must ascend in flow direction and follow some specific rules (e.g. the main stream ends with an even num-ber, the last inflow to the next hierarchical level ends with digit 9). To assign these 13-digit numbers manually for the 4500 new subdivided catchments by following the prescribed registering rules is quite difficult, time consuming and error-prone.
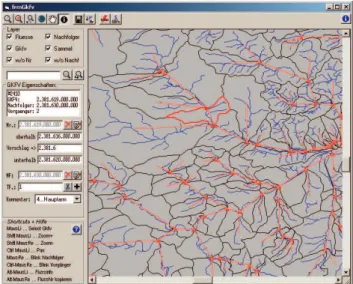
To facilitate the numeration process, a special numbering support and checking tool (Fig. 2) was created using ESRI© MapObjects and MS© Visual Basic. The tool visualises the catchment area in a GIS window and proposes GKFV-IDs for newly created polygons. Successor and predecessor relations between sites can be set by a simple point-and-click.
In addition to generating GKFV-IDs, the tool also ascer-tains all confluence nodes at the watercourse and automati-cally generates a flow chart for the water system. Sites out-side the official register (e.g. gauges or special interest sites) can be integrated into the unique numbering concept. Via an interface to the database, a further database operation al-lows the automatic naming of almost all 10 790 regionalisa-tion sites by river name and locaregionalisa-tion.
Summary of the tool features:
– load and visualize the catchment shape
– add the river shape and show the river ID
– define multi-polygon and subdivided catchments (i.e. gauge, special interest site)
– showing and setting the successor/predecessor relations between sites
– calculate the locations of the confluence nodes between two catchments
– supported editing of the official areal water system reg-ister (GKFV)
– enumeration of all polygons by flow direction, addition-ally storing of successor and source catchment ID
– checking all inputs, displaying issues
– comprehensive error report
– database interface storing inputs
Fig. 2.Interactive tool to set stream orders, to facilitate unique IDs and to check inputs.
2.3 Applying of the regionalisation concept
By using Arc Macro Language (AML) of ESRI© ArcInfo, two routines could be developed:
– The first routine allows the generation of Regions ac-cording the catchments based on the previous derived flow direction and corresponding source catchment. For example for Fig. 1: catchment for the gaugeP = Region P, containing polygonp; catchment for basic siteB1= RegionB1, containing polygonsp and b1; catchment for basic siteB2 = RegionB2, containing polygonb2; catchment for confluence siteS= RegionS, containing polygonsp,b1andb2.
– The second routine enables the calculation of the catch-ment related parametersP1toP8 for all 10790 catch-ments. The catchment area is derived by reading the value for the area in the attribute table of the corre-sponding GKFV Region. To obtain the values of all the other parameters the respective grid or coverage (e.g. land use) has to be defined by a layer that only contains the GKFV Region which represents the catchment. In some cases implemented ESRI© ArcInfo commands or external Fortran routines have to be used additionally.
Finally, the flood, mean and low flow parameters were de-rived by applying formula (1) to linked databases using MS© Access and doing extensive validation.
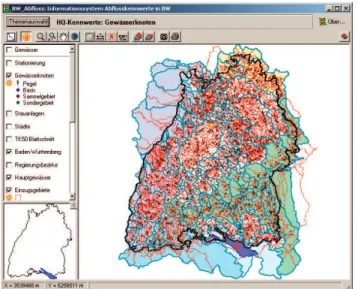
Fig. 3. BW Afbluss: General window offering the possibility to navigate through Baden-W¨urttemberg with the usual GIS functions, directly linked to the result window.
3 Publication and distribution: stand-alone geographi-cal information system “BW Abfluss”
The result of the regionalisation covers a large amount of data (for 10 790 sites, each having several parameters and values). These values include:
– floods of different return periods (HQ2–HQ100)
– factors to evaluate extreme floods (f200–f10 000)
– climate factors (fK,2–fK,1000)to consider predicted cli-mate changes
– mean flow (MQ) and low flow values of different return periods (MNQ,NQ2–NQ100)
– mean low flow durations (ND2–ND100).
In addition to the above-mentioned main results, the fol-lowing information is available and included in the publica-tion:
– catchment parameters
– statistical values and graphs for the time series at the gauges
– 258 longitudinal sections along the water system with the data of different flood, mean or low flow parameters
– characteristic data of all storage basins with volume
≥50 000 m3
– maps of land use, rainfall and the regionalisation spe-cific landscape factor
Fig. 4.BW Abfluss: Example of a result report for a single location within Baden-W¨urttemberg. The table on the left side summarizes the relevant characteristic values of the catchment (area, percentage of urban area, percentage of forest area, ...), the table on the right side shows the results of floods of different return periods.
– official areal water system register (GKFV), stream net-work and contour maps
– documentation and description of the regionalisation concept and the results.
To publish such a large amount of data and make it quick and easy to search required an electronic solution. For this specific purpose, new software was developed (Fig. 3). With this release of “BW Abfluss: Abflusskennwerte in Baden-W¨urttemberg” the fourth version of this software will be pub-lished (spring 2007).
While the first version was embedded into ESRI© ArcView 3.1, now the software is a stand-alone geo-information system with its own database which is dis-tributed on a DVD-ROM. The system is independent from other software components, requires only a Microsoft Windows© platform and uses ESRI© MapObjects to display geographic information. The included geographic data is di-rectly linked to the results of the regionalisation (Fig. 4) to get quick access to points of interest. Also, a searching tool is embedded to simplify queries over the large amount of sites. Additional layers, such as contour maps or even own data layers, can be loaded and displayed. All data include print-ing functions to save researched results.
4 Summary and perspective
acceptance in the water management administration of Baden-W¨urttemberg and are used by engineering consul-tants, too. Furthermore the data are used as inputs for the state-wide generation of flood risk maps.
The new release provides additional values for the pre-dicted impact of climate change and low flow values of dif-ferent return periods. Moreover, the amount of represented sites has more than doubled. Hence, this release will cer-tainly be a very helpful tool for river basin management.
The realisation of this new release demanded the handling of large amount of data and it could only be achieved by a new concept for coupling GIS and database needs. The deci-sive components are:
– using a data type called Coverage of ESRI© ArcInfo. This data type has two big advantages: the capability to record several layers which are linked with each other in one single dataset and the possibility to aggregate sev-eral polygons to a “Region”
– a newly developed interactive management tool to up-grade the official areal water system register (GKFV) by using ESRI© MapObjects and MS© Visual Basic
– a stand-alone geo-information system with its own database which is independent from other software components.
With this method of coupling GIS and database, a very pow-erful tool for handling large amount of data has been devel-oped and tested successfully under real conditions.
Acknowledgements. The authors thank the contracting authority the Landesanstalt f¨ur Umwelt, Messungen und Naturschutz Baden-W¨urttemberg (LUBW).
Edited by: K.-E. Lindenschmidt
Reviewed by: K. Schneider and an anonymous referee
References
Arbeitskreis KLIWA (Hrsg.): Langzeitverhalten der Hochwasser-abfl¨usse in Baden-W¨urttemberg und Bayern, Karlsruhe, M¨unchen, Offenbach: Arbeitskreis KLIWA, KIWA-Heft 2, http://www.kliwa.de/index.php?pos=ergebnisse/hefte/, 2002. Arbeitskreis KLIWA (Hrsg.): Klimaver¨anderung und
Konse-quenzen f¨ur die Wasserwirtschaft: Fachvortr¨age; 2. KLIWA-Symposium am 03. und 04.05.2004 in W¨urzburg, Karlsruhe, M¨unchen, Offenbach: Arbeitskreis KLIWA, KIWA-Heft 4, http: //www.kliwa.de/index.php?pos=ergebnisse/hefte/, 2004. Arbeitskreis KLIWA (Hrsg.): Regionale Klimaszenarien f¨ur
S¨uddeutschland, Karlsruhe, M¨unchen, Offenbach: Arbeitskreis KLIWA, KIWA-Heft 9, http://www.kliwa.de/index.php?pos= ergebnisse/hefte/, 2006.
Ihringer, J., Becker, R., Brunner, R., Harlos, S., Kiefer, H., Merz, R., Neff, H.-P., Luft, G., Marusic, D., H¨onig, U. und Casper, M.: Hochwasserabfluss-Wahrscheinlichkeiten in W¨urttemberg, Landesanstalt f¨ur Umweltschutz Baden-W¨urttemberg, Oberirdische Gew¨asser/Gew¨asser¨okologie, 54, 1999.
Ihringer, J., Becker, R., Blatter, A., Neff, H.-P., Preuß, P., Luft, G., Straub, H., Vormann, E., und Beerling, P.: Mittlere Abfl¨usse und mittlere Niedrigwasserabfl¨usse in Baden-W¨urttemberg, Lan-desanstalt f¨ur Umweltschutz Baden-W¨urttemberg, Oberirdische Gew¨asser/Gew¨asser¨okologie, 86, CD-ROM, 2004.
Ihringer, J., Becker, R., Blatter, A., Liebert, J., Preuß, P., Luft, G., und Straub, H.: Abflusskennwerte in Baden-W¨urttemberg, T. 1: Hochwasserabfl¨usse, Landesanstalt f¨ur Umweltschutz Baden-W¨urttemberg, Oberirdische Gew¨asser/Gew¨asser¨okologie, 94, CD-ROM, 2005.