A new approach to estimating Mean Flow in the UK
M.G.R. Holmes
1,
A.R.Young
1, A. Gustard
1and R. Grew
21Natural Environment Research Council, Centre for Ecology and Hydrology,Wallingford, Oxfordshire, OX10 8BB, UK
2Environment Agency for England and Wales, South West Region, Exeter, EX2 7LQ, UK
Email for corresponding author: [email protected]
Abstract
Traditionally, the estimation of Mean Flow (MF) in ungauged catchments has been approached using conceptual water balance models or empirical formulae relating climatic inputs to stream flow. In the UK, these types of models have difficulty in predicting MF in low rainfall areas because the conceptualisation of soil moisture behaviour and its relationship with evaporation rates used is rather simplistic. However, it is in these dry regions where the accurate estimation of flows is most critical to effective management of a scarce resource. A novel approach to estimating MF, specifically designed to improve estimation of runoff in dry catchments, has been developed using a regionalisation of the Penman drying curve theory. The dynamic water balance style Daily Soil Moisture Accounting (DSMA) model operates at a daily time step, using inputs of precipitation and potential evaporation and simulates the development of soil moisture deficits explicitly. The model has been calibrated using measured MFs from a large data set of catchments in the United Kingdom. The performance of the DSMA model is superior to existing established steady state and dynamic water-balance models over the entire data set considered and the largest improvement is observed in very low rainfall catchments. It is concluded that the performance of all models in high rainfall areas is likely to be limited by the spatial representation of rainfall.
Keywords: hydrological models, regionalisation, water resources, mean flow, runoff, water balance, Penman drying curve, soil moisture
model
Introduction
Within water resources, the Mean Flow (MF) of a river is a commonly used statistic which may be calculated from an annual time series of daily flows recorded at a gauging station by taking an arithmetic average of observed flows and provides a preliminary assessment of resource availability in a catchment. MF may be used to standardise flow statistics to minimise the influence of climatic and catchment scale, enabling the impact of other physical or climatic controls on river flows to be investigated. For example, in the UK, strong relationships have been found between low flow statistics standardised by MF and descriptors of catchment hydrogeology (Institute of Hydrology, 1980; Holmes et al., 2002). More recently there has been interest in developing MF models for calibrating general climatic models for simulating climate change scenarios (Russell and Miller, 1990; Arnell, 1999). In practice, water resource assessments are often required in catchments that are ungauged, hence regionalised models
for estimating MF at any point within a river network are commonly required.
A useful transformation is to express MF as an equivalent depth of water over the contributing catchment, which is referred to as an Average Annual Runoff Depth (AARD). When transformed in this manner the observed values of runoff in the UK range from over 3500mmyr-1 in the upland
areas in western Scotland, to less than 50mmyr-1 in East
1992) to complex physically based rainfall runoff models (Moore, 1985; Manley, 1978) designed to replicate the entire observed hydrograph; consequently, they contain many parameters, require suitable calibration in specific catchments and generally are not suited to regionalisation. Mean flow models, in contrast, seek to replicate only one aspect of the observed hydrograph, the measure of central tendency and, hence, are of a simplified form, with few parameters and are suited to regionalisation. Furthermore, mean flow models tend to have lower data requirements in terms of the temporal and spatial resolution of the climatic data, which ultimately assist in the application of the models on a national basis. However, there are disadvantages associated with such simplifications; e.g. the model developed by Gustard et al. (1992) has difficulty predicting MF in very dry catchments due to the simplified model structure.
This study developed a regionalised, nationally applicable water balance type model that addressed current deficiencies in MF estimation in the low rainfall areas of the UK. The model incorporates a soil moisture accounting model and was calibrated against stream flow records for numerous hydrologically representative catchments in the UK. Results were compared with estimates of MF derived from the steady state water balance model developed by Gustard et al. (1992) and the UK Meteorological Office Rainfall and Evaporation Calculation system (MORECS).
Background
Each of the models considered by this study uses the concept of a catchment water balance, albeit applied at different temporal and spatial scales. The catchment water balance is one of the most fundamental principles in hydrology. A catchment is considered as a closed system generating river flows in response to precipitation inputs, evaporation outputs and changes in the total volume of water stored in the catchment. The general form of a water balance model is Eqn. (1) where q is the river flow per unit area, P is precipitation, E is net evaporative losses and the ∆S term is the change in storage of water within the catchment.
S
E
P
q
=
−
±
∆
(1)Models based on water balance principles are conceptually appealing as their form includes an understanding of the relationships between the processes controlling flow generation. Application of the water balance equation requires catchment based-estimates of precipitation, evaporation and a measure of the change in storage of water within the catchment. The effect of changes in water storage
within a catchment can be minimised by using long modelling periods and excluding catchments susceptible to significant gauge by-pass, such as those with ephemeral streams with very permeable beds.
Precipitation inputs of catchment average rainfall estimates are typically made by interpolating point data recorded at raingauges over the catchment area. This study was restricted to catchments without significant precipitation contributions of snow, typically the case in the UK with the exception of very high elevation areas in Scotland. Although measurement of rainfall is conceptually simple, uncertainties arise from the point measurement of rainfall, the interpolation scheme and the density of the raingauge network used to extrapolate the data to a spatial coverage. Lowland areas of the UK tend to have higher densities of raingauges than the mountainous and inaccessible highlands of Scotland. Consequently, errors of interpolation, likely to be higher in mountainous areas are compounded by the high spatial heterogeneity in rainfall in these areas.
Evaporation from a catchment is dependant on the climatic conditions that provide the required energy to transform water from a liquid to a gas, as transpiration via vegetation and evaporation from free water surfaces and the soil matrix. Consequently, point measurement of evaporation using lysimeters is more complex than measurement of rainfall. Variations in vegetation, soils and climatic conditions across UK catchments are significant, the network of lysimeters is relatively sparse and hence extrapolation and interpolation of the data will introduce uncertainties in the estimation of catchment average evaporation.
occurring in a catchment.
The relationship between PE and AE is a function of the interaction of soil moisture stores, vegetation and climatic conditions. Penman (1949) conceptualised these physical processes as evaporation taking place at the potential rate when sufficient water is available to satisfy demands made by the plant/soil interface. As the soil moisture store is depleted and soil moisture deficits (SMDs) occur, the net rate of evaporation falls below the potential rate as the vegetation has more difficulty extracting water from the soil and the transpiration process is slowed. Penman (1949) proposed a simple ‘drying curve’ model that reduced evaporation from the potential rate to a constant actual evaporation rate once a critical ‘root reservoir’, equivalent to SMD, had been depleted. In this model, the critical SMD level would be defined by a ‘root constant’, representing the depth of water which could be evaporated readily by a specific vegetation from a specific soil. Grindley (1970) defined root constants for a variety of crop types in the UK and related them to expected maximum SMD values, representing the deficit at which permanent wilting of the vegetation would occur. Deep-rooted vegetation, such as deciduous forests located on permeable soils in southern England, extract water from greater depths than grasses located on thin impermeable soils of the Scottish Highlands. Alternatives to the ‘Penman-Grindley’ description of the interaction of soil moisture and evaporation have been suggested. For example, Wallace (1994) argued that the process of correcting estimates of PE, using crop factors for example, to calculate AE is conceptually complicated and AE should be estimated by identifying the physiological controls on the surface resistance parameter in the Penman-Monteith equation directly. However, many difficulties are associated with quantifying the effect of the environment on surface resistance parameters. Therefore, the Penman-Grindley approach has been incorporated, in modified forms, into deterministic models such as the Four Layer Root Model (FLRM) developed by the Institute of Hydrology, Ragab et al. (1997). This model includes four soil layers between which water can move and assumes a linear reduction in the ratio of AE to PE once critical soil moisture conditions are reached. The Meteorological Office Rainfall and Evaporation Calculation System (MORECS) (MORECS v 1.0, Thompson et al., 1981; MORECS v 2.0, Hough et al., 1995) represents a national system for producing time-series of PE estimates using a modified version of the Penman-Monteith equation. Actual evaporation rates are estimated by reducing evaporation from the potential rate in response to daily accrued SMDs. MORECS outputs are in the form of 40 × 40 km grids covering the entire UK at a weekly, monthly or annual resolution.
The Penman-Grindley conceptualisation of the interaction of soil moisture and evaporation rates allowed estimates of PE, made at climate stations to be converted to areal estimates of actual evaporation that took account of the variation in vegetation type. This information was originally used by agriculturists to manage crop water requirements more efficiently; however, it also represents a method for estimating water loss from a catchment water balance model. Specifically including a deterministic soil moisture model in water balance type MF models is particularly relevant for areas where the build up of SMDs in summer restricts runoff. Traditional water balance models generally include simple conceptualisations of soil moisture behaviour and hence perform poorly in these regions. Models such as the FLRM and MORECS, calibrated against soil moisture rather than stream flow data, would not be expected to estimate MF well. The inclusion of a simple soil moisture model within a water balance type MF model that is calibrated against stream flow records, can improve MF estimation in low rainfall regions of the UK where the management of water resources is most critical.
Model development
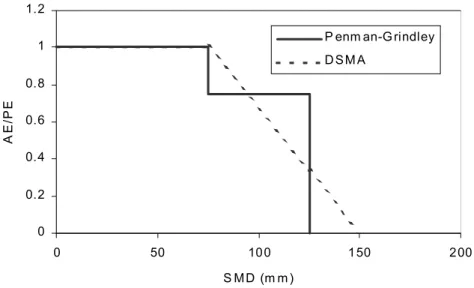
The Daily Soil Moisture Accounting (DSMA) model developed was suited to estimating MF in very dry catchments since it specifically included a representation of a soil moisture store which would simulate variations in actual evaporation rate. The relationship between evaporation rate and soil moisture was determined using a modified form of the Penman-Grindley model. The constant reduction of PE to AE beyond a critical SMD has been replaced with the linear relationship shown in Eqn . (2).
(
)
× − −
=
RC A
RC SMD PE
AE
1 (2)
where AE is the actual evaporation rate, PE is the potential evaporation rate, SMD is the soil moisture deficit, RC is the rooting constant and A is the shape parameter.
0 0.2 0.4 0.6 0.8 1 1.2
0 50 10 0 1 50 2 00
S M D (m m )
AE
/P
E
P enm an-G rindley
D S M A
Fig. 1. Relationships between the ratio of actual to potential evaporation in relation to soil moisture deficits proposed by the Penman-Grindley model and the DSMA model
(assuming RC = 75 mm and A = 1) for grass
depth is reached, (Penman, 1949).
The DSMA model conducts a water balance on a daily time step, reflecting the observed time scale at which soil moisture typically varies in UK catchments. Catchment average daily time series of rainfall and potential evaporation were required as inputs and for each time step i the equations governing the generation of runoff and soil moisture deficits are detailed below.
(1) The actual evaporation rate (AE) for time step i+1 is governed by whether the existing SMD exceeds the rooting constant (RC). If SMDi >RCthen the evaporation rate is reduced to less than the potential rate following Eqn. 2:
(
)
1
1 1 +
+ ×
× − −
= i i
i PE
RC A
RC SMD AE
If SMDi ≤RCthen evaporation occurs at the potential rate:
1
1 +
+
=
ii
PE
AE
(2) If sufficient rainfall (R) is occurs within time step i+1 to overcome the existing SMD, while satisfying the evaporative demand (AE), then runoff (RO) is generated and the SMD is reset to zero.
If Ri+1−AEi+1 >SMDi then
i i
i
i R AE SMD
RO+1= +1− +1− and SMDi+1=0
(3) If insufficient rainfall occurs to overcome the existing SMD, while satisfying the evaporative demand, then no runoff is generated and the SMD is increased. If Ri+1−AEi+1≤SMDi then ROi =0 and
SMDi+1 =Ri+1−AEi+1−SMDi
The relatively simple structure of the DSMA was designed deliberately as the model was required only to estimate MF, a single aspect of observed hydrographs, and it is accepted that the model will not predict the whole hydrograph well. Consequently, the inclusion of many parameters would be likely to create problems; Beven (1989), suggested that three to five parameters should be sufficient to describe most aspects of an observed hydrograph. The structure of the DSMA model, Eqn. (2), suggests that a high level of parameter covariance between A and RC could be expected. To avoid the issue of parameter identifiability and model over-specification, the shape parameter A was fixed equal to unity, which effectively dictates that evaporation ceases at twice the rooting constant.
Data
The climatic inputs for the DSMA model were daily rainfall and potential evaporation grids for the UK, developed at a 1 × 1 km resolution, for the period 1961 to 1990. Digitised catchment boundaries were then overlain to obtain a daily time-series of catchment average estimates of rainfall and potential evaporation.
MORECS provides the UK with the only nationally consistent estimates of PE, derived for short grass, using a modified form of the Penman-Monteith equation. These data were available at an average monthly resolution as a 40 × 40 km grid. The coarse spatial resolution of the MORECS data is significant at the scale of the catchments in the data set and PE would vary considerably within a given MORECS cell. Therefore, a correction for within-cell altitude variations was applied to the monthly MORECS data to refine the data set to a 1 × 1 km resolution as
described by Young (2000). The PE rate was assumed to be constant for all days within a month.
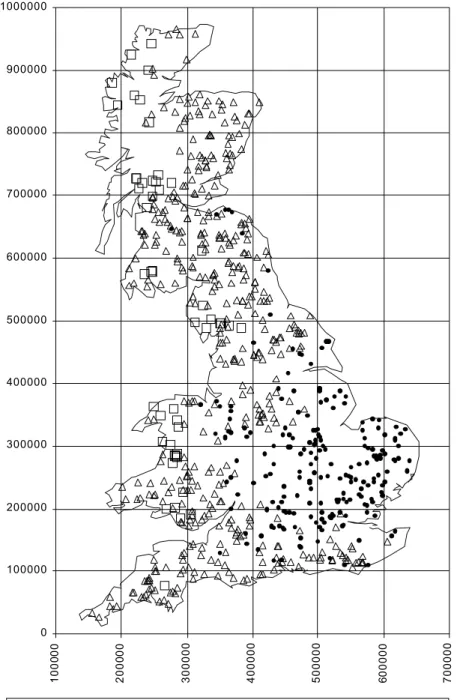
The DSMA model was calibrated against stream flow data from catchments with essentially natural flow records drawn from the UK National Water Archive (www.ceh.ac.uk/data). A minimum record length of six years was set and the final data set of 677 catchments is shown in Fig. 2, grouped by observed AARD that ranged between 88 mm yr–1 and 3395 mm yr–1 (average 657 mm yr–1,
standard deviation 514 mm yr–1).
0 100000 200000 300000 400000 500000 600000 700000 800000 900000 1000000
1000
00
2000
00
300000 400000 500000 600000 700000
A A RD < 300mm/y r 300 mm/y r < A ARD < 1500 mm/y r A A RD > 1500mm/y r
The data set was representative of UK catchments in terms of climatic conditions and included a wide range of different hydrological responses. Catchments in the data set recorded values of SAAR ranging between 555 mm yr–1 and 3473
mm yr–1 (average 1103 mm yr–1, standard deviation 482 mm
yr–1). The values of average annual PE for the catchment
data set ranged between 377 mm yr–1 and 665 mm yr–1
(average 536 mm yr–1, standard deviation 58 mm yr–1).
Optimisation of the Rooting Constant
The DSMA model was firstly calibrated against observed MF values from streamflow records within the period 1961 to 1990 to identify optimal values of the parameter RC. Catchments likely to violate the assumption of a closed catchment water balance, such as ephemeral permeable catchments, were excluded. Checks were also made to ensure that the start and end date of short flow records (six to ten years) did not fall in drought years, so that any such impact on catchment storage would be minimised and a ‘burn in’ period of one year would be adequate to establish model stability. Optimal parameter estimates were defined as those that gave the minimum standard residual (SRES);
OBS PRED OBS
AARD AARD AARD
SRES = −
where AARDOBS is the observed average annual runoff (mm yr–1) and AARD
PRED is the predicted average annual
runoff (mm yr–1) for the catchment. AARD
PRED values were
obtained by averaging the predicted daily values of runoff over the periods for which observed daily values of AARD existed.
Boundary limits of 1mm and 250 mm were adopted for the RC parameter. The lower limit reflects a conceptual lower limit of zero and the upper limit is the maximum rooting depth for permanent woodland on fertile soils suggested by Grindley (1970). These limits were used to identify instances where the conceptual daily water balance was violated. A total of 25 catchments were found to have RCOPT values of 1mm and 86 catchments had RCOPT values of 250 mm. Careful examination revealed that the closed water balance assumption might well have been violated in each case due to errors in the estimation of rainfall (small mountainous catchments), errors in the estimation of catchment area (permeable catchments with non-coincident topographic and groundwater boundaries), or significant artificial influences on the flow regime.
Over the reduced data set of 566 catchments the distribution of RCOPT values was positively skewed with a median value of 46 mm. The 10th and 90th percentiles for
the distribution were approximately 12 mm and 107 mm, respectively.
Regionalisation of the Rooting
Constant
A regionalised model for RC was developed using the optimised rooting constants to enable the model parameter to be determined for any catchment in the UK and hence enable the DSMA to be applied to ungauged catchments. The conceptualisation of the DSMA implies that the RC parameter reflects the ease with which water may be evaporated from the combined soil/vegetation layer. Therefore, the soil and vegetative covers of catchments were used as explanatory variables for regionalising RC. The Hydrology of Soil Types (HOST) soil classes were used to describe the soil characteristics of a catchment. This classification system, developed by Boorman et al. (1995), groups 969 soil series into 30 HOST classes on the basis of similarity in hydrological response. Physical properties considered to affect hydrological response included soil hydrogeology, depth to aquifer, presence of peaty topsoil, depth to a slowly permeable layer, depth to gleyed layer and integrated air capacity (a surrogate for permeability in permeable soils which indicates the capacity of an impermeable soil to store excess water). The final form of the classification exists as a set of digital grids expressing the fractional extent of each HOST class at a 1 × 1 km resolution.
The vegetative characteristics of a catchment were obtained from the LAND classification system, a data set derived from Landsat imagery taken in the early 1990s by the NERC Institute of Terrestrial Ecology (Fuller et al., 1994). This data set defines 26 classes of land use including urban land, arable land, meadows, coniferous forests and deciduous forests. The LAND classification data was converted from a 50 × 50m grid to a 1 × 1 km resolution grid of fractional extents of each class.
of LANDHOST variables, see Eqn. (3).
i i
i
EST a LANDHOST
RC =
∑
×= 8
1
(3)
where RCESTis the estimate of the evaporation threshold parameter from the DSMA model; LANDHOSTi is the fraction of the combined LANDHOST class i occurring in the catchment; and ai is a parameter estimate for LANDHOST class i.
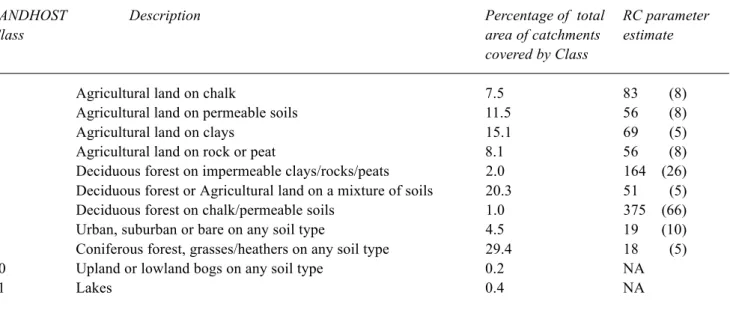
The final groupings and parameter values shown on Table 1 suggest that RC is a physically significant parameter reflecting the combined impact of soils and land use/ vegetation on catchment-scale evaporation. The grouping of urban/suburban land use with any soil type (LANDHOST8) confirm that urban land use dominates the evaporation processes regardless of the underlying soil type. Conversely, the groupings in LANDHOST classes 1 to 4 illustrate that the impact of agricultural land use on evaporation will be dependent on the underlying soils. The LANDHOST class representing lakes and bogs was assumed to provide an unlimited supply of water to the evaporation process.
The large uncertainties associated with some of the parameter estimates were regarded as acceptable given the relative scarcity of those classification types within the catchment data set and within the UK.
Evaluation
The performance of the DSMA model, using the regionalised RC parameter values was assessed over the entire data set of catchments. AARD values were derived from averaging the daily runoff values predicted by the DSMA model. The performance of the model was examined over three bands of average annual rainfall; SAAR < 700 mm yr–1 where significant soil moisture deficits would
occur regularly; 700 < SAAR < 1000 mm yr–1and SAAR
> 1000 mm yr–1 where significant soil moisture deficits
would not be expected each year.
The performance measures used to assess the ability of a model to predict runoff were BIAS, to assess systematic error and RMSE, to assess random error.
where AARDi
OBSis the observed value of average annual
runoff depth (mm yr–1) for the ith catchment, and AARDi PRED
is the predicted value of average annual runoff depth (mm yr–1) for the ith catchment.
A factorial standard error (FSE), representing the random error in the predictive capacity of the model, was determined from a logarithmic regression of AARDOBS against AARDPRED.
The performance of the DSMA model was compared, in
Table 1. Parameter estimates for RC derived using fractional extents of the LANDHOST classification system. Standard error (mm) shown in brackets.
LANDHOST Description Percentage of total RC parameter
Class area of catchments estimate
covered by Class
1 Agricultural land on chalk 7.5 83 (8)
2 Agricultural land on permeable soils 11.5 56 (8)
3 Agricultural land on clays 15.1 69 (5)
4 Agricultural land on rock or peat 8.1 56 (8)
5 Deciduous forest on impermeable clays/rocks/peats 2.0 164 (26)
6 Deciduous forest or Agricultural land on a mixture of soils 20.3 51 (5)
7 Deciduous forest on chalk/permeable soils 1.0 375 (66)
8 Urban, suburban or bare on any soil type 4.5 19 (10)
9 Coniferous forest, grasses/heathers on any soil type 29.4 18 (5)
10 Upland or lowland bogs on any soil type 0.2 NA
11 Lakes 0.4 NA
R2 = 0.72 Model Standard Error = 36mm
∑
=
−
=
ni
i OBS
i PRED i
OBS
AARD
AARD
AARD
n
BIAS
1
1
(
)
∑
=
−
= n
i
i PRED i
OBS AARD AARD
n RMSE
1
Table 2, to the performance of three other model approaches to estimating runoff in the UK.
Model A is the steady state water balance model developed by Gustard et al. (1992) and used widely in the UK by environmental regulation agencies, Young et al. (2000). The model is based on average annual climatic variables and has the structure given by Eqn. (4). This model uses a value of average annual rainfall to define the point at which actual evaporation occurs at less than the potential rate. Below this point evaporation takes place at a fraction of the potential rate, defined by a linear relationship with rainfall. Experience has shown that this model has difficulty predicting runoff in the very low rainfall areas of the UK.
Model A: (4)
where r =1 SAAR
≥
850 mmyr–1r= 0.475 – 0.00061 × SAAR SAAR < 850 mm yr–1
where SAAR is the standard average annual rainfall for the period 1941 to 1970; and PE is the average annual potential evaporation derived from pre-MORECS data sets, mapped isolines at a scale of 1:2 000 000, based on the Penman equation (Penman, 1950) for the same period.
The second model considered is based on MORECS outputs. In addition to PE estimates MORECS estimates hydrologically effective rainfall defined as the rainfall available after soil moisture deficits and evaporation demands have been satisfied, (Hough et al., 1995). Model B simply equates runoff to this estimate of effective rainfall (Eqn. (5)). This model enables comparisons to be made between the relative success of a MORECS’s complex semi-distributed soil moisture model (calibrated to soil moisture data) and the DSMA model (calibrated against stream flow records) for predicting runoff.
Model B: AARD=ERF (5)
where ERF is the MORECS estimate of average annual
Table 2 . Comparison of the four models
A B C DSMA
Rainfall data Average annual Daily rainfall Daily rainfall interpolated from the
rainfall interpolated interpolated from dense Meteorological Office network
from the dense the reduced of raingauges.
Meteorological MORECS network
Office network of of raingauges. raingauges.
PE data PE calculated PE calculated using a modified form of PE calculated from
from the Penman the Penman-Monteith equation, including Penman-Monteith for equation for short seasonally varying resistance terms short grass.
grass for actual surface cover.
Soil moisture Not explicitly Two-layer soil moisture store, critical Simple finite soil
modelled, SAAR used SMDs defined for vegetation and soil moisture store, defined to identify catchments combinations, modelled on a daily basis. by a rooting constant,
that experience modelled on a daily
evaporation limiting basis.
SMDs.
Catchment losses AE varies linearly AE varies with PE below a critical SMD AE varies linearly
with PE below a in response to SMDs calculated daily. with PE below a
critical SAAR value. critical SMD,
calculated daily.
Spatial resolution 1 × 1km 40 × 40km Approximately 1 × 1km
of runoff estimates 1 × 1km, assuming
MORECS PE and AE at 40 × 40km.
PE
SAAR
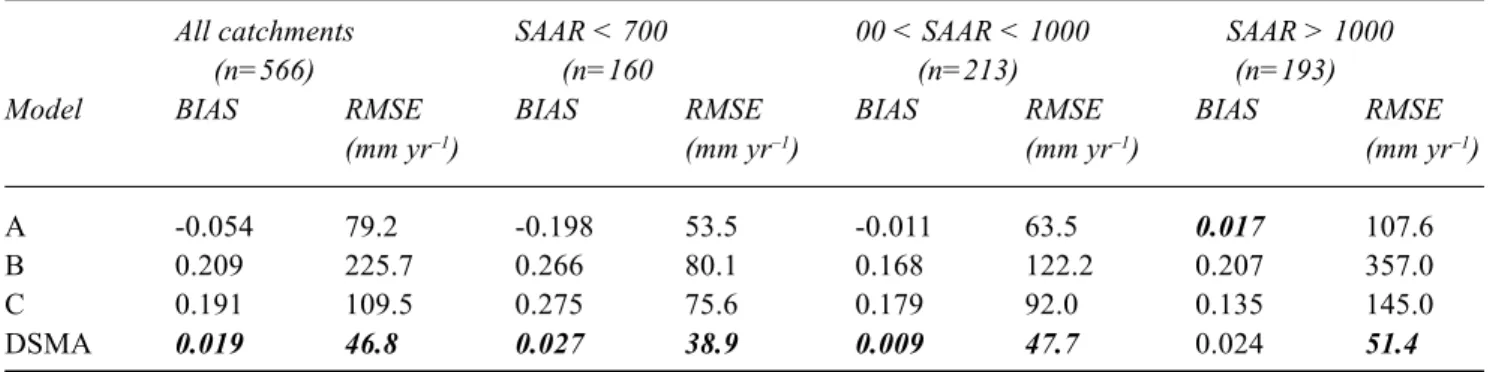
Table 3. Comparison of model performance (best performance shown in bold italics)
All catchments SAAR < 700 00 < SAAR < 1000 SAAR > 1000
(n=566) (n=160 (n=213) (n=193)
Model BIAS RMSE BIAS RMSE BIAS RMSE BIAS RMSE
(mm yr–1) (mm yr–1) (mm yr–1) (mm yr–1)
A -0.054 79.2 -0.198 53.5 -0.011 63.5 0.017 107.6
B 0.209 225.7 0.266 80.1 0.168 122.2 0.207 357.0
C 0.191 109.5 0.275 75.6 0.179 92.0 0.135 145.0
DSMA 0.019 46.8 0.027 38.9 0.009 47.7 0.024 51.4
effective rainfall (1961 to 1990), derived from a 40 × 40 km spatial grid.
One criticism of MORECS relates to the relatively coarse network of 156 raingauges used to estimate rainfall, compared to the full Meteorological Office network of more than 6000 stations. The MORECS estimates of rainfall, used to model soil moisture behaviour, are likely to be too coarse to use to estimate runoff. Model C was developed to examine the benefits of using the complex soil moisture model in MORECS while using SAAR as a better estimate of rainfall. The actual evaporation estimate from MORECS is calculated on a daily basis using the soil moisture model, which progressively reduces the rate of water loss from the potential value to zero as a function of the soil moisture conditions (Hough and Jones, 1997). The structure of Model C is shown in Eqn. (6).
Model C: AARD=SAAR−AE (6)
where AE is the average annual actual evaporation estimate from MORECS for the period 1961 to 1990, derived from a 40×40 km spatial grid. The spatial resolution of both the AE and ERF data could not readily be enhanced to a 1 × 1 km grid due to the complex nature of the controlling variables.
Table 4. Factorial Standard Error (FSE) resulting from a regression of LOG(AARD)OBS against LOG(AARD)PRED
Model All catchments SAAR < 700 700 < SAAR < 1000 SAAR > 1000
A 1.229 1.362 1.163 1.103
B 1.331 1.374 1.258 1.256
C 1.212 1.345 1.166 1.076
DSMA 1.165 1.259 1.134 1.056
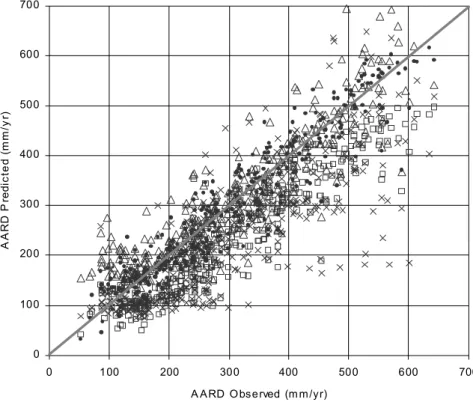
Results and discussion
A comparison of the performance of the four models is shown in Table 4. The results for catchments of low and medium rainfall are illustrated in Fig. 3 whilst Fig. 4 illustrates model performance in high rainfall catchments. The results show the importance of rainfall estimation for predicting MF in the wettest catchments. Model B uses the coarse estimates of rainfall associated with MORECS, which, although suitable for modelling soil moisture, clearly are not suitable for estimating catchment runoff in high rainfall catchments.
The remaining three models (A, C and the DSMA) use essentially the same rainfall data. In the wettest catchments Model C has a tendency to under-predict runoff, probably related to an over-estimation of actual evaporation rates due to MORECS climate stations being biased towards lowland stations. Model A and the DSMA model perform similarly in terms of systematic error and the DSMA model is considerably better in terms of random error, indicating that the sequencing of soil moisture deficits is important even in relatively wet catchments.
0 100 200 300 400 500 600 700
0 100 200 300 400 500 600 700
A A RD O bse rved (m m /yr)
AA
R
D
Pr
e
d
ic
te
d
(
m
m
/y
r)
M ode l A M odel B M o del C D S M A M
Fig. 3. Performance of models over low rainfall catchments (SAAR<1000mmyr-1)
2 00 6 00 10 00 14 00 18 00 22 00
2 00 60 0 10 00 1 400 18 00 22 00
A A RD Ob served (m m /yr)
AA
R
D
Pr
e
d
ic
te
d
(
m
m
/y
r)
M ode l A M od el B M odel C DS M AM
evaporation rates cannot be replicated. Furthermore, average annual rainfall is used to determine whether significant soil moisture deficits occur within a catchment, whereas it is the progressive daily or sub-daily development of soil moisture deficits that defines these points.
Models B and C could be expected to perform similarly in low rainfall catchments, where the differences in rainfall estimation methods will be less, and better than Model A over dry catchments due to the inclusion of the MORECS soil moisture models; however, this was not confirmed by the results. The observed consistent under-prediction of runoff in dry catchments by MORECS was also found by Jolley et al. (1996). This supports suggestions made by Gardner and Field (1983) and Ragab et al. (1997) that MORECS tends to over-estimate observed soil moisture deficits and hence would over-predict actual evaporation rates, leading to an underestimation of effective rainfall. Model A has been calibrated against the variable of interest, catchment runoff and this outweighs the benefits associated with the dynamic, daily soil moisture models within MORECS.
The DSMA model was shown to perform best over the entire data set of catchments as well as over the driest UK catchments. The benefits of adopting a daily time step model enable the impact of soil moisture deficits on runoff to be modelled successfully. The one parameter model for reducing evaporation below the potential rate in response to soil moisture conditions on a daily basis, is successful at modelling long term runoff. The DSMA model performance is superior to the MORECS based models primarily due to the fact that it has been calibrated against streamflow records rather than soil moisture data, which compensates for a more simplistic soil moisture model.
Conclusions
The topography and climatic conditions of the UK combine to create two main issues for the application of water balance models. In the wetter western and northern regions, the network of climate stations is relatively sparse and, in these mountainous areas, the rainfall is highly variable. Therefore, the estimation of precipitation inputs to the water balance equation is a significant source of uncertainty, particularly in small catchments. However, the average annual rainfall is relatively high in these areas so that significant, evaporation-limiting soil moisture deficits do not occur regularly and the estimation of actual evaporation is simplified.
In the drier southern and eastern regions of the UK, the spatial distribution of rainfall is generally more homogeneous and the climate station network is generally
more dense, hence catchment rainfall may be estimated with more certainty. However, net rainfall is less and potential evaporation rates are higher so that significant soil moisture deficits develop on a regular basis. Therefore, estimation of actual evaporation is more complex as the interaction between climatic conditions and soil moisture deficit development must be considered.
The development of a semi-distributed regionalised model for estimating MF that accounts for the impact of progressive soil moisture deficits represents a considerable advance in MF estimation in the UK. Calibration of the model with stream flow records has proved more important than a complex soil moisture model structure. The DSMA model predictions of MF were superior to existing models across all catchments, specifically in low rainfall areas. The importance of improving MF estimation in dry catchments is very real since approximately 27% of the land area of the UK receives less than 700mm of rainfall per year. Therefore, the estimation of a basic resource measure such as MF is essential for effective UK water resource management on a national basis.
The ability to quantify the impacts of climate change on water resource availability is becoming increasingly important across the globe. The dynamic modelling approach adopted in the DSMA model is well suited to this task and enables simulation of changes to the volume and spatial distribution of rainfall; changes to potential evaporation rates due to increases in solar energy input and modifications to vegetation cover as this effects soil moisture behaviour. These types of scenario analysis are not possible using traditional water balance approaches.
This study did not undertake detailed uncertainty analysis of the sensitivity of the performance of the DSMA model to variability of the RC parameter. Further research to quantify the impact of poorly represented LANDHOST classes on the overall performance of the DSMA model is required as well as studies of the impact of uncertainties in the daily climatic data.
Acknowledgements
The research described in this paper was carried out at CEH-Wallingford (formerly the Institute of Hydrology) funded by the Natural Environment Research Council and the Environment Agency (Research and Development Project W6-057, Project Manager Dr. Robert Grew).
References
Arnell, N.W., 1999. Climate change and global water resources.
Beven, K., 1989. Changing Ideas in Hydrology: The Case of Physically-Based Models. J. Hydrol., 105, 157–172. Boorman, D.B., Hollis, J.M. and Lilly, A., 1995. Hydrology of
soil types: a hydrologically-based classification of the soils of the United Kingdom. Report 126. Institute of Hydrology. Wallingford, UK.
Fuller, R.M., Groom, G.B. and Jones, A.R., 1994. The land cover map of Great Britain: An automated classification of Lansat thematic mapper data. Photogramm. Eng. Remote Sensing, 60, 553–562.
Gardner, C.M.K. and Field, M., 1983. An evaluation of the success of MORECS, a meteorological model, in estimating soil moisture deficits. Agr. Fores. Meteorol.29, 269–284. Grindley, J., 1970. Estimation and mapping of evaporation. IAHS
Publication No. 1, 200-213.
Gustard, A., Bullock, A. and Dixon, J.M., 1992. Low flow estimation in the United Kingdom. Report 108. Institute of Hydrology. Wallingford, UK.
Holmes, M.G.R., Young, A. R., Grew, R. and Gustard, A.,2002. A Region of Influence approach to predicting Flow Duration Curves within ungauged catchments. Hydrol. Earth Syst. Sci.,
6, 721–731.
Hough, M.N. and Jones, R.J.A., 1997. The United Kingdom Meteorological Office rainfall and evaporation calculation system: MORECS version 2.0 – an overview. Hydrol. Earth Syst. Sci., 1, 227–239.
Hough, M.N., Palmer, S.G., Weir, A., Lee, M.J. and Barrie, I.A., 1995. The Meteorological Office rainfall and evaporation calculation system: MORECS version 2.0. An update to Hydrological Memorandum 45. Meteorological Office, Bracknell, UK.
Institute of Hydrology, 1980. Low Flow Studies Report. Institute of Hydrology. Wallingford. UK.
Jolley, T.J. and Wheater, H.S., 1996. A large-scale grid-based hydrological model of the Severn and Thames catchments. J. CIWEM., 10, 253–262.
Jones, S.B., 1983. The estimation of catchment average point rainfall profiles. Report 87. Institute of Hydrology, Wallingford, UK.
Manley, R.E., 1978. The use of a hydrological model in water resources planning. Proc. Inst. Civil Eng., Part 2, 65, 223–235. Monteith, J.L., 1965. Evaporation and environment. 19th Symposia of the Society for Experimental Biology. Cambridge, Cambridge University Press, 19, 205–234.
Moore, R.J., 1985. The probability-distributed principle and runoff production at point and basin scales. Hydrolog. Sci. J., 30, 273– 297.
Penman, H.L., 1948. Natural evaporation from open water, bare soil and grass. Proc. R. Soc. London, Ser. A, 193, 120–145. Penman, H.L., 1949. The dependence of transpiration of weather
and soil conditions. . Soil Sci., 1, 74–89.
Penman, H.L., 1950. Evaporation over the British Isles. Quart. J. Roy. Meteorolog. Soc., 76, 372–383.
Ragab, R., Finch, J. and Harding, R., 1997. Estimation of groundwater recharge to chalk and sandstone aquifers using simple soil models. J. Hydrol., 190, 19–41.
Russell, G.L. and Miller, J.R., 1990. Global river runoff calculated from a global atmospheric general circulation model. J. Hydrol.,
155, 301–323.
Shaw, E.M., 1988. Hydrology in Practice. Ed. 2. Van Nostrand Reinhold (International), London. UK.
Thompson, N., Barrie, I.A. and Ayles, M., 1981. The Meteorological Office rainfall and evaporation calculation system: MORECS. Meteorological Office, Bracknell, UK. Thornthwaite, C.W., 1948. An approach toward a rational
classification of climate. Geogr. Rev., 38, 55–94.
Turc, L., 1954. Calcul du bilan de l’eau evaluation en fonction des precipitations et des temperatures (Calculation of the water balance: Evaluation of the function of precipitation and temperature). IAHS Rome Symposium 111, Publication No. 38, 13–49.
Turc, L., 1955. Le bilan d’eau des sols. Relations entre les precipitations, l’evaporation et l’ecoulement (The groundwater balance: Relationships between precipitation, evaporation and runoff). Ann. Agron., 6, 5–131.
Wallace, J.S., 1994. Calculating evaporation: resistance to factors.
Agr. Forest Meteorol., 73, 353–366.
Young, A.R., 2000. Regionalising a daily rainfall-runoff model within the United Kingdom. Southampton University. Unpublished Ph.D.