ISSN 2299-2634 (printed), 2300-5653 (online) http://www.jtacs.org
An augmented reality platform for wearable assisted
living systems
Rafael F. V. Saracchini, Carlos A. Catalina
Technical Institute of Castilla y Le´on, Burgos, Spain
{rafael.saracchini, carlos.catalina}@itcl.es
Abstract: Assisted Living systems aim to improve life quality of their users giving context relevant guid-ance accordingly with their location and hour of the day. Most of commercial systems depend on complex/expensive infrastructure and still their positional information is not sufficient to take advantage of modern interfacing devices such as head-up displays or pico-projectors. We describe in this paper the design of an Assisted Living system capable to offer such guidance with on-site Augmented Reality, without introducing changes in the environment and using off-the-shelf equip-ment. The system can take advantage of wearable computing devices with embedded camera by determining the user position and orientation by using Visual Odometry and SLAM techniques. With this data, advices can be exhibited automatically by merging it seamlessly to the environment using augmented reality. In order to assess the efficacy of our system, we performed pilot tests in health care centres and residences using a prototype of a low-cost wearable device which displays the information through an embedded pico-projector.
Keywords: augmented reality, assisted living systems, wearable computing
1. Introduction
Assisted Living systems aim to improve life quality of people with mental or physical disabilities, providing guidance using miniaturized or portable devices, such as PDAs, tablets, ”smart” bracelets or watches. Support from such devices may come in form of advice, warning of hazards, aid in interaction with relatives or improved supervision of caregivers.
A main characteristic of such systems is the capability to determine the user position within the environment where the user resides. Commercial Real-Time Localization Systems (RTLS) for indoor positional tracking use either Wifi [1], RFID triangulation [2], a combi-nation of several emitters [3], or inertial sensors [4, 5]. Those systems have high degree of reliability and are used in hospitals and industrial environment. Still, they demand an expen-sive and/or complex infrastructure in order to operate properly.
The elevated cost of such systems poses an obstacle for wider adoption due the relatively low purchasing power of their potential users. Another negative factor regarding the adoption of such Assisted Living systems is the inadequacy of the interfacing between the end-user and the system. Conventional RTLS systems allow only the detection of the user position in the environment, but not his/her orientation or what is in his field of view. Thus, guidance can be provided only in a simplistic manner since no extra contextual information can be determined by said systems.
nat-urally into a scene. The usage of AR-based information in Assisted Living systems was proposed by Aviles-Lopes et al. [6], which identified AR markers placed in the environment and displayed relevant information by using a mobile platform such as a phone or tablet. Experiments performed by Kurz et al. [7] showed that this form of interaction with the user is still not ideal, since tablets or mobile phones require constant interaction and a certain degree of knowledge to use it properly. They are also deemed to be too intrusive, annoying and/or complicated by elderly or mentally impaired users, leading to a increased degree of rejection. As demonstrated by Mist et al. [8], wearable computing devices such as a wearable set of camera and pico-projector or the recently developed lightweight heads-up displays are a much more promising and intuitive approach to interact with the user, and with great potential as interfacing device for Assisted Living systems.
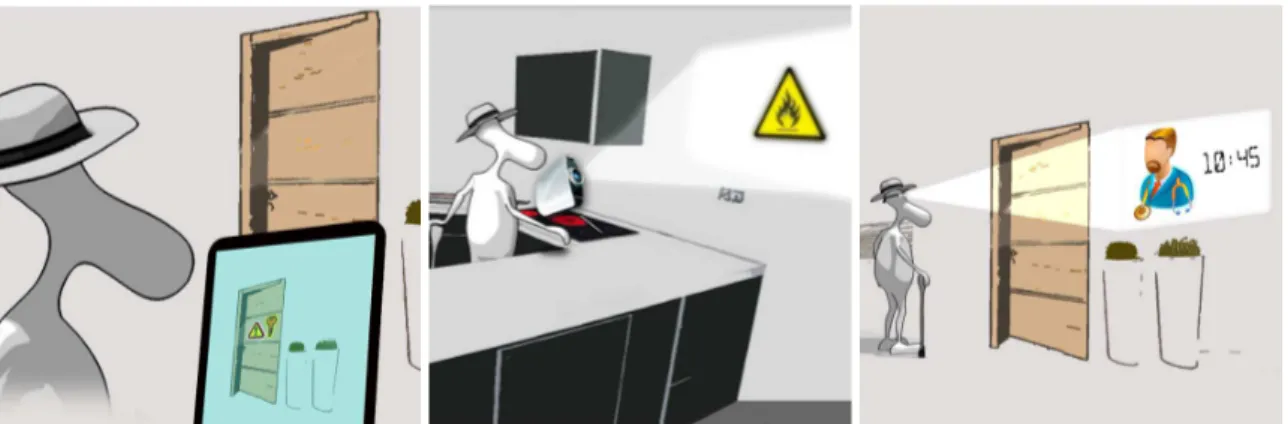
Our contribution consists in the design of a flexible platform for a mobile augmented reality system and its potential application in assisted living. The proposed system depends only on an interfacing device and infrastructure already available in most of residences and health-care centres, and is designed in a way that it can interface either with a conventional mobile/tablet device, wearable devices doted with pico-projectors, or heads-up displays. See figure 1.
Figure 1. Our concept of Assisted Living system with standard mobile devices (left),and wearable devices with pico-projectors(middle) and heads-up displays(right)
More specifically, we aim to fulfil the following requirements:
— Retrieve the 3D geometry of the environment with low-cost equipment, allowing labelling of regions of interest (rooms and hazards ) and intuitive insertion of AR content.
— Use the wearable device camera data to determine in real-time the user location and ori-entation in order to display information properly.
— Achieve scalability, allowing usage in environments such as health centres and residences. — Autonomy, that is, the end-user should not need to interact with the device in order to
operate after its initial set-up.
— Robustness to slight changes in the environment (occlusion or displacement of recognis-able features, introduction/removal of daily use objects, et.).
— Allow remote management and monitoring by the Assisted Living system managers (care-givers, medics or relatives).
but simple approach for RGB-D mapping combining the scalability of pose-graph map rep-resentations and the robustness of dense tracking approaches by a hybrid mapping approach. The computed map can be used to prepare AR content to be exhibited and used as input to monocular visual tracker which is used to compute the camera position and orientation in the environment.
To validate our platform, we developed a prototype of a wearable device which is com-posed by commodity hardware, more specifically: an embedded low-cost System-on-Chip, web-cam and pico-projector, which can be acquired in electronics retailers. The platform and the prototype were tested in residences and health-care centres with elderly volunteers.
This paper is organized as follows: in section 2 we present relevant works in the field of 3D tracking and mapping for AR. In section 3 we present the proposed Assisted Living infrastructure and hardware/software requirements and in section 4 the map structure and core procedures used by the platform. In section 5 and 6 we will detail the core modules of our system: our proposed RGBD-SLAM and Visual Tracking algorithm. In sections 7 and 8 we present results obtained in tests with the proposed platform, conclusions and future work.
2. Related work
Improvements in State-of-art AR and Simultaneous Localisation and Mapping (SLAM) methods allowed the removal of specific markers and/or complicated calibration procedures. By using rotation and scale invariant feature descriptors [9, 10, 11, 12], the surrounding loca-tion and user movement can be determined in real time without alteraloca-tions in the environment if there are enough visual cues. For AR applications, the 3D map needed to determine the camera pose and placement of informations can be obtained byVisual SLAMorRGBD-SLAM
algorithms.
2.1. Visual SLAM
Visual SLAM approaches achieves on-line 3D mapping of indoors by using only a video sequence obtained by a common camera. They can be classified in two types: feature-based
approaches, andappearance-basedapproaches.
Feature-based approaches are based in the identification and tracking offeatures, that is, regions that such as salient points, blobs or lines present in frames which can be identified even when suffering a rigid transform. Motion can be estimated by determining the correspondence of features with known 3D position between frames, and computing the camera pose through RANSAC [13] or weighted M-estimators [14]. The most notable approach of this class is the Parallel Tracking and Mapping (PTAM/PTAMM) introduced by Klein et al. [15, 16]. Their algorithm track small patches found by the FAST detector [17] and computing/refining their 3D position in a concurrent process, achieving real-time performance with very low computational costs. The approach is relatively insensitive to lighting effects and occlusions. Due their very low computation costs, it was successfully adapted to mobile phones [18] and micro-aerial vehicles [19]. A very robust approach was proposed by Minetto et al. [20] in the AFFtrack algorithm, although the computational costs of such algorithm are very hight, it allowed perform feature-based tracking robust to motion blur and lighting variations.
instead a sparse set of features, these approaches are also called ”dense”. This class of SLAM algorithms was was the introduced by the seminal work of Newcombe et al. [21], denom-inated DTAM (Dense Tracking and Mapping), which relied in GPU processing to achieve real-time performance. Due its very high computational costs, semi-dense approaches, which uses only edges corners of said models were developed by Engel et al. [22] in the LSD-SLAM algorithm [23] and Forster et al. [24]. In general these methods are much more robust than feature-based methods, but they are particularly sensitive to lighting variations and have com-paratively higher computational costs.
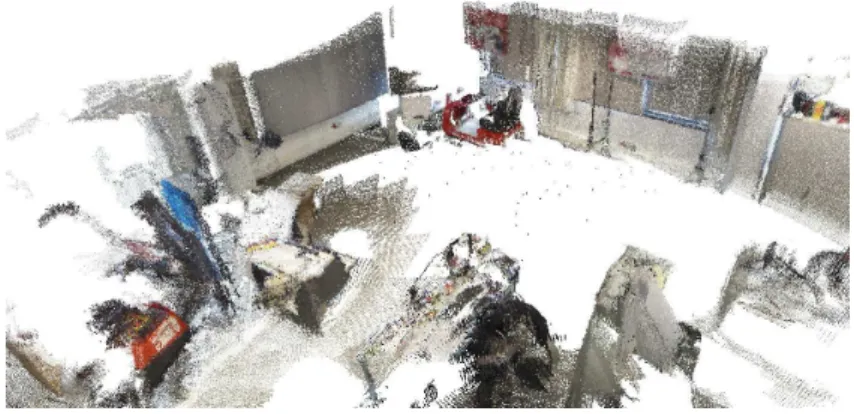
Typically Visual SLAM have very low processing times, and are suitable for real-time applications without high performance requirements. However, since they rely only in visual information, they have difficulties to map completely indoors environments since regions such as corridors and plain walls have not enough information to them work properly. Another inconvenient of such methods is that their retrieved 3D map consists on a set of reference patches or points. See figure 2.
Figure 2. Typical 3D map produced by a Visual SLAM algorithm of a research laboratory
Although enough for visual tracking, this output is difficult to an operator to interact and determine interest regions with accuracy. Finally, the map retrieved is not in metric scale, instead only the relative displacement between the points is retrieved. The usage of exter-nal information, such as known initial camera displacement or a reference object of known dimensions are required for disambiguation.
2.2. RGBD-SLAM
The introduction of low-cost RGBD cameras such as Microsoft Kinect and Asus Xtion PRO Live pushed forward a new approach for 3D mapping and tracking: the dense RGBD SLAM. Those algorithms retrieve a 3D map based in the depth data, sometimes coupled with information obtained by its embedded RGB cameras. The associated data allows overcome lack of visual correspondence between images by using geometry consistency of the scene to perform tracking, achieving reduced drifting and tracking loss when compared to pure visual methods. With few exceptions, most of RGBD-SLAM approaches uses RGB data to perform tracking in a similar way as the appearance-based approaches mentioned previously.
im-mersive AR applications were developed taking advantage of the environment geometry and appearance. Meilland et al. [26], for instance, computed a cube map from such data which could be used for very realistic AR effects. Still, the KinectFusion usage was confined only to small workspaces, and suffered of effects of large scale drift.
In order to deal with this issue, several approaches where proposed. Henry et al. [27] were able to perform reconstructions of large environments by using bundle adjustment and loop closure techniques, although not using dense tracking. Whelan et al. [28] developed the Kintinuous algorithm, which allowed the dense reconstruction of buildings without significant changes in the original KinectFusion algorithm by using sliding voxel cubes. The approach still had problems with loop-closure operations and large scale drifting effects. A posterior implementation [29] tried to cope with this issue by representing the map as a large and deformable mesh.
The output of RGB-D SLAM in general, is a 3D mesh or dense point cloud, allowing much easier manipulation. Despite their advantages over visual methods, most RGB-D cameras lack portability and require a sizeable power supply, being unsuitable to be embedded into a portable device. Only recently such sensors were miniaturized to tablets/laptops such as in Project Tango [30] and the Intel RealSense [31] sensors. There is still no low-cost or easily available devices in the market which make use of said sensors. As can be seem in Figure 3, the output of such methods is significantly superior and easier to visualize than maps computed by Visual SLAM methods.
Figure 3. 3D map of the environment from figure 2 generated by a RGBD-SLAM algorithm
3. System design
Our goal is to provide an autonomous Augmented Reality system that is able to display context-dependent information (in form of sound or projected information in walls or fur-niture) by a wearable device, such that the device and managing software can interchanged seamlessly. Also, the system should offer capabilities such as on-line monitoring by care-givers/supervisors, updating of the AR programming upon request without requiring physical presence.
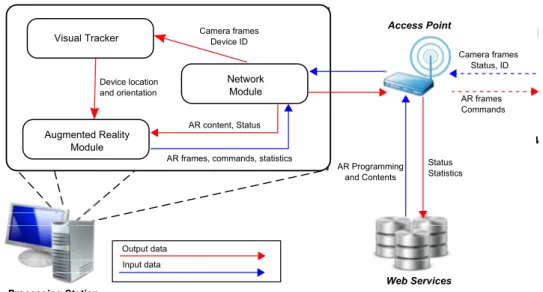
3.1. Components
Visual Tracker
Augmented Reality Module
Network Module
Camera frames Status, ID
AR frames Commands
AR frames, commands, statistics AR content, Status
Camera frames Device ID
Status Statistics AR Programming
and Contents
Access Point
Device location and orientation
Output data Input data
Wearable Device
Processing Station
Web Services
Figure 4. Proposed Assisted Living components and data work-flow
Wearable device: The wearable device acts as input/output interface only, without perform any kind of dedicated processing. This design decision is taken since such devices have limited processing capabilities and battery life. Camera and AR frames are streamed by a lightweight client application. Additionally, the device sends its identification and if applica-ble status data such as accelerometer and battery status.
Processing station: The processing station is the core of the Assisted Living system, act-ing as manager of the content to be displayed. It runs 3 concurrent modules which works asynchronously: a Visual Tracker, an Augmented Reality and a Network module.
The first determines the wearable device orientation and position in the environment by using the frames sent through the wireless network. The Visual tracker assumes that the input camera and output device (display/projector or HUD) calibrations (relative positions, resolution, etc.) are known a-priori. The system uses the wearable device identification in order to retrieve the corresponding calibration data from its database and process the frame data accordingly without interrupting the Assisted Living service.
The Network module provides an interface between the processing station and the other components, relaying input/output data from/into the wearable device and periodically com-municating with the Web Services. The communication with these services allows updating programmed AR data, schedules and monitoring by caregivers and supervisors.
The Augmented Reality module generates the images to be exhibited by the wearable device or issuing specific commands (for instance, playing an alert sound) according with the detected context given by the user/device orientation, position or hour of the day. For this functionality, an engine such as Ogre3D [32] or Unity [33] can be used to render the frames and detect/trigger events which determine the AR contents to be shown.
Note that the modules runs in parallel. The Visual Tracker may process frames in irregular frame-rates, but the AR image streaming still will be to sent to the wearable device at constant frame-rate by the Augmented Reality module, interpolating the camera movement . This avoids stuttering, jitteriness and other undesirable effects to the user.
pro-cessing station and the access point, avoiding network congestion, which will affect adversely the responsiveness of the Assisted Living system.
Web services: The web services stores previously mapped environments, AR content and programmed schedules of the Assisted Living system. They act as a content server, where the processing station will download the map data for tracking and AR assets. They also allow a caregiver/supervisor manage remotely the contents exhibited by the processing station, determine and label regions of interest and visualize the 3D map and data collected by the processing station such as user habits, positioning and device usage.
4. Map representation and operations
In our algorithms, we decided to use the feature-based method AFFTrack [20], which is very robust compared with other feature-based methods and is adaptable for large environ-ments. In this section we describe the assumptions and notations used in our algorithms, the map representation, as well procedures which are used either in the our RGB-D mapping algorithm as well the Visual Tracker module.
4.1. Camera model
Camera model. LetI denote an image in gray-scale containing lighting intensity measure-ments captured by a pin-hole camera. The imageIcan be viewed as a function of a rectangle D= [0, nx]×[0, ny]ofR2 to a color space derived from its pixel values. A 3D pointP ∈R3
can be mapped by a transformρ(P, K, E)to a pixelp∈ I, where:
P′ x P′ y P′ z
=KI3×4E
[
P 1
]
(1) ρ(P,K,E) =
[ P′ x P′ y ] 1 P′ z (2)
We will denoteρ as projection function. The matrices K and E are respectively the camera
intrinsicand extrinsic parameters. Kmaps a 3D point relative to the camera into the image plane, whetherEmaps a 3D point in world coordinates into relative camera coordinates.
K=
fx 0 cy
0 fy cy
0 0 1
(3) E =
[
R T 0 1
]
(4)
The values fx and fy are the focal length in the horizontal and vertical axis, and the point
(cy, cy) ∈ R2 theprincipal point, and are usually obtained by an off-line camera calibration
procedure. The matrixR3×3 is a rotation matrix andT3×1 a translation computed by Visual Odometry/SLAM algorithms. The matrixT=E−1
is often denoted ascamera pose.
4.2. Map representation
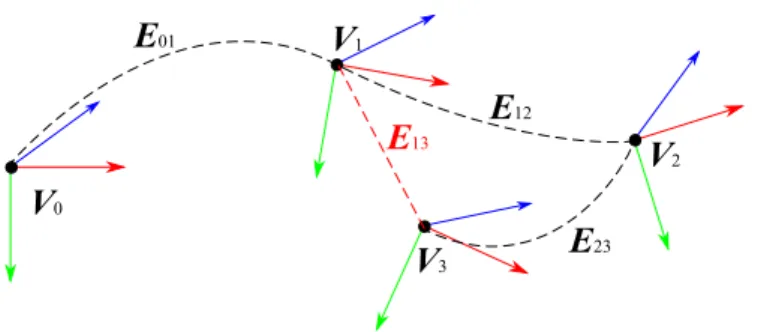
We represent an environment with pose-graph map and an associatedinverted file. The first is a lightweight representation of locations retrieved by SLAM algorithms by a graph structure. This representation of the scene geometry allows perform error minimization and loop closure operations with ease, at expense of loss of precision regarding dense mesh rep-resentations. The second is a search structure intended to be used in localization and initial-ization steps.
Pose-graph. The mapM ={V,E}is a graph with verticesV representing the key-frames (Vi = Ki), and where an edge Eij contains a rigid transform Tij such that TijTi = Tj. In
V0
V1
V3
V2
E01
E12
E23
E13
Figure 5. Visualization of a pose-graph representation of a trajectory with 4 key-frames. The edges
E01,E12,E23 were created incrementally during the mapping. The edge E13 was added during a
loop-closure operation, due the similarity betweenV1andV3.
the SLAM method which generated it, often meaning that features ofKi are visible inKj by
visual correspondence. See figure 5.
Key-frames. Key-frames are the building blocks of most Visual Odometry and SLAM al-gorithm. Our representation of a key frame is a tuple Ki = (Ii,Ti,Pi,Fi,Pi), whereIi is
a gray-scale image which belongs to an mapped frame sequence who generated the map, Ti = E
−1
i is the camera pose, P is a set of canonical patches and F is a set of feature descriptors. Additionally, a key-frameKi has aparent key-framePi, which is the key-frame
in the map was used as reference where its poseTiwas computed.
Canonical patches. A a canonical patch consists in a given 3D patch computed by a monocu-lar or RGB-D SLAM algorithm and used to compute the camera motion and detect occlusions. In general, they are derived from a two-dimensional patches extracted from a key-frame. A canonical patch p ∈ P is described by p = {P,C, ⃗n,M}, where P is a set of corners
P ={P1, . . . , Pn}|{n ≥4, Pi ∈R3}with centreC, and a normal direction⃗n∈S3. All those
components are in the global coordinate system instead relative to the camera pose. The re-gion where the patch is projected in a key-frameKican be determined by the region delimited
by the mapped corners p = {ρ(P1,K,Ei), . . . , ρ(Pn,K,Ei)}. Not all the regions within the
projection of the canonical patch can be considered reliable or belonging to the patch, thus it has an associatedweight maskM ∈ D containing values withinMxy ={w∈R|w⊂[0,1]}
which segments patch regions to be tracked. See figure 6.
(a) (b)
Figure 6. Canonical patches projected into the image(a) and their weight maskM(b)
Feature descriptors. The set F is a set of feature descriptors computed from the associ-ated image I of the key-frame. Feature descriptors are are used for image classification and initialization/re-localization purposes. Each descriptor f ∈ F is composed by a tuple f ={f2d, f3d, fdsc}, wheref2d ∈R2
is its position in the imageI,f3d ∈R3
computed in the map M andfdsc ∈ Rn its descriptor data, which is often an-dimensional
floating point array. The value off3dmay be unknown depending on its extraction procedure.
Inverted file. The inverted file is a data structure used for image classification and fast search, which contains a list ofvisual wordsand the mapping of every reference image where it ap-pears, as well its number of occurrences. A similarity search can be performed by a TF-IDF search using the histogram of visual words of a query image, returning the most similar en-tries with a computed IDF score. In this particular case, the visual words from an image are computed by indexing the key-frame features descriptors from Fi with a n-ary vocabulary
tree [34], and each entry of the inverted file maps directly into a key-frameKifrom theM.
4.3. Retrieving map data from SLAM maps
This map structure allows the representation of sparse maps computed by Visual SLAM, such as PTAMM, or a large dense map as used by the KinectFusion or our proposed RGB-D mapping. The first retrieves a sparse set of patches and associated pose-graph map, but not a well-defined geometry. The second retrieves either a computed triangle mesh, which may be coloured by some selected key-frames or a set of depth maps with associated pose-graph map.
Pose-graph map extraction. For most SLAM algorithms, M can be generated from the
computed pose-graph map. In certain cases, however, such as in the Kintinuous and Kinect-Fusion algorithm, there is no such data, but often the algorithm generates a sequence of 2D frames with known camera pose for texturing. The map can be generated by assigning edges between such key-frames by their vicinity of their computed camera posesT, connecting them by a certain radius threshold and/or a minimum number of nearby neighbours.
Feature descriptor extraction. The extraction of the set Fi is done by performing its
de-tection and extraction algorithm [9, 10, 11, 12] on each of the images Ii of the pose-graph
map. and assigning its respective values of f2d
j andfjdsc, fj ∈ Fi. The value of fj3d can be
determined by back-projecting f2d
j in the computed scene geometry. For Visual SLAM, this
depth value can be inferred if the feature falls within a computed patch, and estimatingf3d j
by intersection of the camera ray that pass in that pixel and the plane normal. For RGB-D mapping, just the depth computed in that point will suffice, if known. If the projection falls within a region with unknown depth,f3d
j is assigned a default ”unknown” value.
Canonical patch extraction. For Visual SLAM maps, patches and normals are available for the key-frames, so we can use the sameCand⃗nvalues as determined originally and compute the corners P by back-projecting its corners inI onto a plane with normal⃗n centred inC. Since no explicit scene geometry is available, we consider we consider that all pixels of its weight maskMvalid (Mxy = 1).
In the case of RGB-D maps, it is possible to extract automatically useful canonical patches by detecting candidate points with a corner detector such as FAST [17] or the Shi-Tomasi detector [35]. Since it is possible to determine a corresponding depth map D and a normal mapN to the processed key-frame. The weight mask values Mxy can be computed by the
following formula :
Mxy =
{
⃗n· Nxy, ifDxyis connected toDc
wherec=ρ(C, K,E)and⃗n=Nc. The values ofP are also computed by back-projecting its
2d positions in the depth mapD, or estimating it by extrapolating a plane centred inC with normal⃗nif they fall in a region with unknown depth. This procedure ensures that only planar components of the canonical patch will be taken into account during calibration and tracking procedures.
4.4. Core procedures
The map structure allows performing the following core procedures: theSimilarity Search,
Visual Consistency Check,Affine patch trackingand theWeighted Motion Estimation. Those core procedures are used as building blocks in our platform and used either in our proposed RGB-D SLAM method as well the Visual Tracker.
Similarity search. Thesimilarity search returns the most similar key-frame Kbest from the
map and a set of reference patches and descriptorsPbest,Fbest, which can be used for camera
calibration or detect a revisited local. Given a query image, we compute its histogram of visual words and determine a set S with theN candidates with highest score by a TF-IDF search in the inverted file. Instead merely choosing the candidate with higher score usingL1 norm [34], we cluster the candidate key-frames by their connectivity in the global map M
into clustersC, where its score is the sum of matched visual words of each vertexKi ∈ Cj.
The best clusterCbestis then the cluster with higher number of votes and the key-frameKbest
is defined as the cluster member with highest number of matched words. Fbest is composed
by each featurefksuch that{fk∈ Fi|Ki,Kj ∈Cbest}. The setPbestis assembled in a similar
way.
Visual consistency check. The visual consistency check tries to evaluate the camera pose Tcoarse of a query frameIq relative to a key-frameKi, using a set of calibration featuresFbest
which normally are determined by a similarity search. This procedure is often used to verify if a frame can be correlated with another in loop closure operations or to estimate an initial guess of the camera pose after a tracking loss. In this procedure we compute a initial guess transfor-mationTcoarse by computing the query frame descriptorsFq and performing a distance-ratio
matching with the features descriptors Fbest with known depth values f3d. Tcoarse is then
computed by minimising the re-projection error between the matched features using an it-erative Levenberg-Marquardt optimisation with RANSAC. Features with re-projection error smaller than 3.0 are considered inliers and the check fails if their number is smaller than a parameterk, otherwise it is considered successful. Note that the estimatedTcoarse may have
a degree of inaccuracy due the non-deterministic estimation due the RANSAC algorithm and measurement noise of the values of f3d, which may lead to ”jittery” estimation ofT
coarse.
NormallyTcoarse is refined by another adjustment step, depending on the context.
Affine patch tracking – AFFTrack. The AFFTrack algorithm is a patch adjustment algo-rithm developed by Mineto et al. [20]. More specifically, it allows to compute an inter-frame displacementDj =Ct
+1
j −Cjtof a fiducial planar marker (in our case, the canonical patches)
and its reliability weightwj given a previous estimation of its projection on a frameIt and
Weighted camera motion estimation. This procedure computes the camera poseTt+1 from a frameIt+1from a frameItwith known poseTt, calibrated by a reference key-frameKiwith
npatchesPi. We use the M-Estimator proposed by Klein [14], that is, the motion betweenIt
andIt+1is represented by amotion vectorµt,t+1 = (x, y, z, ρ, ω, ϕ), which is a 6-dimensional representation of the Lie groupSE[36]. The motion vector can be then computed by solving iteratively the following system:
µt,t+1 =JTWJ=JTWD (6)
WhereJis the jacobianofµ. The matricesWandD are respectively thereliability weight
matrixanddisplacement matrix, which are computed by the AFFTrack algorithm. The first is a diagonal matrixW= diag(w1, . . . , wn)such that each valuewj is the adjustment weight
of an patchpj ∈ Pi. The displacement matrix D2n×1 contains the inter-frame displacement
(x, y)of each patch. For each iteration,Wis updated by the following weighting function:
Wi = wi 1 + ri
c
(7)
whereri is the residual ofDi, andc= 2determined empirically. Once the system converges, the updated camera pose can be computed byTt+1 = (exp(µ)Et)−1.
5. RGBD SLAM
We designed a RGBD SLAM algorithm which takes advantage of the robustness of TSDF dense tracking with the low cost offered by pose-graph approaches. Its concept is based in the fact that dense tracking and a dense representation allows robust and stable tracking locally but it is still prone to large scale drifting. The cost to correct the dense representation of the scene geometry makes difficult to adapt such methods to large scale mapping. In another hand, sparse representations are much more scalable, allowing real-time correction of large maps, but mapping based solely in its data is much more jittery than dense approaches.
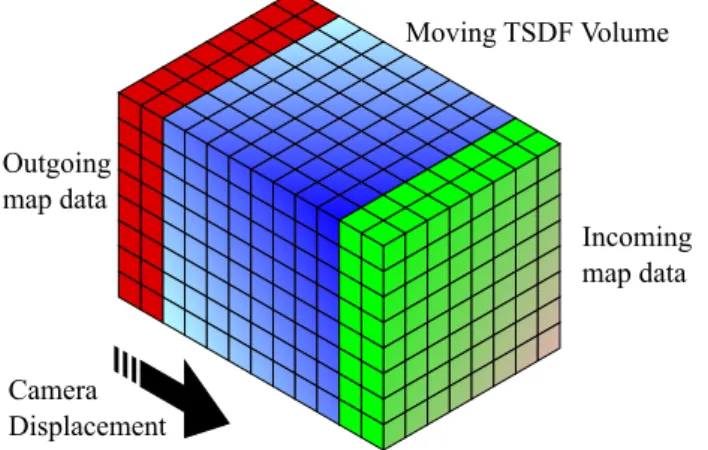
In our approach we use an hybrid map. Along the map structure described in section 4, our RGBD SLAM approach uses a dense local map. The local map is a TSDF volume such as used in KinectFusion, but adapted to larger environments by the use of a sliding voxel cube as proposed by Whelan et al. [28]. A TSDF cube is represented by a fixed volume (often a 512×512×512 voxel cube representing a3m×3m×3mvolume). By representing it by a circular buffer structure, it is possible to translate the scene geometry in a manner that the content viewed by the camera is always within the TSDF cube. See figure 7.
In general, parts of the scene which are outside the TSDF volume are stored in an external structure such as an octree, allowing reload or update the map data when the TSDF volume moves along the camera path. As mentioned previously, in our implementation this structure is used solely for local tracking since it is very expensive computationally to update the entire map when performing a loop-closure.
Our algorithm is outlined in the figure 8.
Incoming map data Moving TSDF Volume
Outgoing map data
Camera Displacement
Figure 7. ”Sliding” TSDF volume
Dense Odometry
Update status
Tracking and Mapping
Keyframe ?
Loop detection
Pose-graph optimization
Map update Revisit ? Similarity Search
Visual Cons. Check
Re-localisation
Update status No
Yes
Yes Capture frame
Compute Features
Known position ?
Capture
Yes
No
No
Figure 8. RGBD SLAM work-flow
Tracking and mapping. For each new frame, we compute a coarse motion estimateTcoarse
by the visual consistency check using features detected by ORB [11]. A refined motion es-timate Tref is then computed by the GPU-based ICP between the frame’s point cloud and
surface predicted by ray-casting the local map TSDF as described by Newcombe [25] and im-plemented by the PCL library [37]. If camera relative displacement from the previous mapped vertexVj is higher than a fixed threshold, we add this a new vertexVi and edgeEij. We also
perform a visual consistency check between it and the parent framePj, settingPi =Pj if the
test is successful, otherwise, we setPi =Kj.
Loop closure. For each new vertex Vi we perform a similarity search and choose the
can-didate Vj with highest number of votes where the conditions Pi ̸= Pj and Eij ∈/ M are
satisfied. The first condition do not allow to close loops between recently mapped frames which the consistency is already ensured by the local map. The second avoids the detection of an already existing edge as loop, instead two revisited regions still not connected in the map.
If the aforementioned condition holds forVj and a visual consistency check between Vi
and Vj is successful, a loop is detected. The closure operation is performed by adding a
new edgeEij to the global map and minimizing the error between the edges with the TORO
algorithm [38]. See figure 9.
corre-Figure 9. Loop closure operation on a circular path starting and ending in a gray cabinet: computed map before correction (left), and after correction (right). The trajectory drift effect is noticeable in the
end points of the pose-graph map.
sponding to the current camera pose. This leads to loss of the dense geometry previously computed, but since we are interested only in using the local map for consistent local tracking this is not an issue.
Re-localisation. In the event of a tracking loss, we perform a similarity search of the current frame followed by a visual consistency check between the best vertex Vbest and the current
camera frame. If test is successful we refine the estimated relative transform refined by ICP and calibrate the camera accordingly. We also add the recovered frame as a new vertex Vj
into the map, the edgeEj,best, and set itsPj as the vertexVbest. In this case, we do not perform
the loop detection step.
6. Visual Tracking
The Visual Tracker is designed to compute the wearable device orientation and position autonomously using the pose-graph mapM. Its work-flow is shown in the figure 10.
Due the mutable environment and unpredictable user movement, we use a partial mapping approach to compute more features than the available in the map M. Those features S, denominatedsupport points, are used mostly as support information when most of the original features from the map cannot be located, either because the scenery changed, occlusion, or movement outside the mapped area.
We will consider a support points∈ Sa tuples={O, c}, whereOis as set of observation points o1, . . . , on ∈ R2 which are tracked along the image after its detection. The support
Capture frame Lost ? Tracking and Mapping
AFFTrack+KLT
Keyframe ? Motion Estimation
Add support points
Enough keyframes ?
Triang. + BA No
No
Yes Yes
Similarity Search
Visual Cons. Check Re-localisation
Compute Features
Yes
No
AFFTrack refinement
point positionc∈ R3
is its triangulated 3D position, which can be unknown at certain stages of tracking.
Initialisation / Re-localisation. In the event of a system initialisation or tracking loss, the Visual Tracker estimates the camera pose by computing the current frame features and then performing a recovery step (similarity search followed by a visual consistency check) switch-ing to trackswitch-ing mode in case of success. If both succeeds, a set of patches to trackPbestfound
by the similarity search is loaded, as well the estimated camera poseTcoarse.
As mentioned in section 4, the estimated Tcoarse is often inaccurate. So we perform a
iterative refinement using the AFFTrack algorithm as follows:
Procedure AffineCalibration(Tcoarse,Pbest) returns(Tref,camera status)
1. Repeat whileTref does not converge, or untilNref iterations:
2. Compute displacementDand weightWofPbestusing AFFTrack algorithm in the
calibration frameI
3. ComputeTref by Weighted Camera Motion Estimation usingDandW
4. If there is less thankpatches whereWi> φ, thencamera status←LOST
5. Else,camera status←CALIBRATED
Figure 11. Camera calibration refinement by using the AFFTrack algorithm
Note that this procedures tries to refine the camera pose, by adjusting iteratively the projection of the patchesPbestover the calibration frame I. By verifying how much patches were
suc-cessfully adjusted, we can determine if the camera pose was sucsuc-cessfully recovered or it was a case of false matching. After the initialization, the set of support pointsSis set as empty.
Tracking. After the system is initialized, we use the AFFTrack algorithm in order to deter-mine the current tracked canonical patches displacement and corresponding reliability weights.
For every support points ∈ S we will re-project its 3D positionc on the scene if it is known, otherwise use the latest value ofoi ∈O. and compute its displacement with the KLT
algorithm [35]. For the points with unknown c, if they are not lost, we store its computed displacement value in the set O. The reliability weights of the support points with known depth are set fixed value 32φ, which should be lower than most of the weights of canonical patches successfully adjusted by AFFtrack. In this way, inaccurately tracked points by KLT wont affect the tracking quality, but the tracking stability will be kept by the support points in case of loss of most features tracked by AFFTrack.
After computing the displacement of the map features and support points, we compute the camera motion by the Weighted Motion Estimation procedure described in section 4.
Mapping. In order to perform a local mapping, we start to store key-frames by using the same criteria as in section 5 after the initial calibration. For the first added key-frame we also add new support points to the set S with unknown 3D position detected by the Shi-Tomasi detector [35]. When the tracker have enough key-frames (in order of 3 to 5), we triangulate the unknown points by using their corresponding observation pointsoi ∈O. The triangulated
Tracking loss.If the camera calibration or tracking turns out to be inconsistent or the number of tracked features and support points with computed weight w > ϕis smaller than k, we consider a case of tracking loss. We discard then the partial map constructed so far and switch back to the re-localisation stage.
7. Tests
In this section we present tests performed with several functionality aspects of our pro-posed platform with commodity hardware and a prototype wearable device. In these tests we analysed the scalability and performance of our RGB-D mapping approach and the accuracy and performance of our Visual Tracker module.
For all tests, we used a vocabulary tree with W = 106
words (6 levels, 10 leaves), performing a visual consistency checks with k = 5 inliers and ϕ = 0.01. The similarity search was performed by selecting bestN = 7candidates, and clustering them according the method described in section 4. For the F feature descriptors, we determined that that SIFT descriptors (128 bytes) achieved the best results for the similarity search and visual consis-tency check. The patch setP was generated by the extraction of 16×16patches found by the Shi-Tomasi [35] feature detector, keeping 60 features with highest corner score for maps computed by RGB-D mapping.
Since SIFT descriptors have high computational costs, we used the Wu’s SIFTGPU [40] implementation, which allows perform their computation and comparison in near real-time. Likewise, the AFFTrack algorithm has high computational cost, for which we used a GPU implementation of the algorithm in order to compute the patch displacement in real-time.
7.1. Assisted Living System infrastructure
Components. All the algorithms were tested with a standard PC as processing station , with a processor Intel I5-3470 3.2 Ghz, 4GB of RAM, a Nvidia GTX 650 graphics card, running Debian Linux ”Wheezy” 64-bit. The access point used was a D-Link WR941ND configured to assign a fixed IP address to the wearable device. Finally the wearable device used was a prototype doted of a embedded camera, pico-projector and Wifi connectivity, which will be described in details in this subsection.
Prototype wearable device. In order to aid the testing of our Assisted Living system, we designed an experimental device, the DCPAR (Device with Camera and a Pico-projector
for Augmented Reality), which can be worn with straps by the user. The device contains
a embedded Logitech C930 USB camera, a Philips PPX2340 pico-projector, loudspeakers and communicates through a “‘Wi-PI“ USB Wireless module. The DCPAR peripherals are controlled by a Raspberry Pi board model B and powered by a 4600Mah lithium-polymer battery. The device runs a lightweight client application which sends the sends images from the camera to the processing station and projects through the pico-projector AR overlays sent to it. Finally, it has an accelerometer which although not useful to aid the Visual Tracker, is used to reduce the battery consumption by switching the system to “sleep mode” when the device is stationary for prolonged periods of time. The projector’s relative “point of view” towards the device camera is known and calibrateda priori, so it can be used directly by the system’s AR module. See figure 12.
Figure 12. DCPAR prototype (left) and examples of on-site AR: the 3D “painting” of a cabinet and the wall with distinct colours (middle) and projecting an advice in a fixed position, independent of the
device rotation (right).
those frames to the processing station, receiving an corresponding AR overlay from it. Also, it may receive commands to reproduce pre-defined sounds stored internally, upon conditions determined by events programmed by the Assisted Living system manager.
Installation. For all residences, the installation of the system components was very simple, requiring only a connection of the access point to a router and its placement in a region where the Wireless signal could reach the largest amount of rooms with enough signal strength. Larger buildings, as health-care centres required the distribution of a set of access points, which was needed in order to cover all regions of interest. As expected, the responsiveness of the AR projection and data transmission was extremely dependent of the signal strength and interference noise which posed a significant hindrance in certain locations.
7.2. RGB-D Mapping
To verify the scalability of our mapping algorithm, we tested our framework in large build-ings such as residences and health-care centres. The RGB-D camera used was the Microsoft Kinect for Windows, operating in ”far” mode and capturing640×480depth and RGB frames. In order to register the RGB raw data with the depth data, we used the OpenCV’s library OpenNI back-end. With our algorithm we were able to reconstruct the interest regions of 3 residences and 5 health-care centres (from302
to215m2
) in roughly one hour and half each. In order to improve the quality of the reconstruction, we refined the pose-graph map by using the iterative camera calibration described in section 6 with a high number of iterations (Nref = 4)
in the graph edges. This refinement is done off-line since the number of iterations makes it too costly to be used in real-time scanning. The outputs produced by the system are shown in figure 13.
Our reconstructions were on par with the PCL library implementation of KinectFusion. We did not performed a precise ground-truth comparison, however we noticed the dimensions of each room was mostly correct when comparing with the building schematics (when avail-able). The reconstructions had localized errors in long hallways, more specifically rotational errors of 5 to 10 degrees between connected rooms. This error could be corrected with re-peated scans with redundant views of the same place, reducing the rotational drift, however, we considered it not needed for our application as it did not interfered with the device usage. The maps could be then used to insert triggered AR events by an user, using the web service infrastructure.
Residence-RS Health-care-LG Health-care-VI
Figure 13. Recovered 3D maps using the RGB-D scanning procedure described in section 5
acceptable speed of5−10frames per second during the capture, allowing the on-site retrieval of the map, which can be readily used by the Visual Tracker. See table 1.
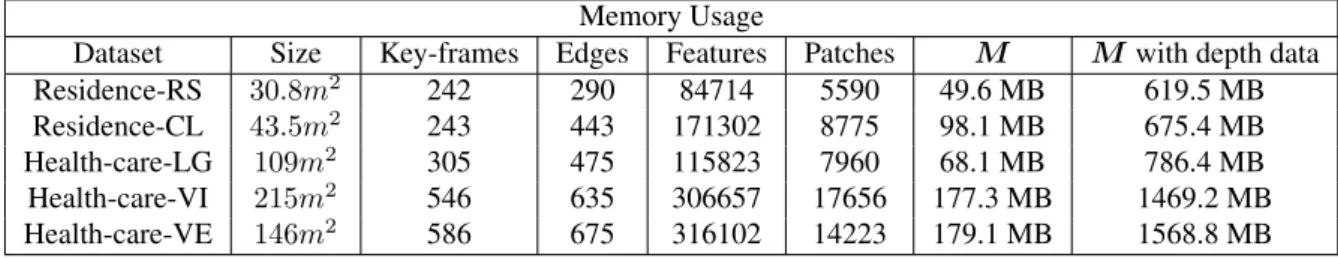
The extracted maps M scaled well, needing very little memory space to represent large environments. The table 2 shows to memory used for the mapM extracted to be used with the Visual Tracker and the space used by the associated depth data obtained by the RGB-D camera. Note that the local map usage will vary, in general taking 1GB of memory for the TSDF voxel cube (which is stored in GPU). Since it is only used to keep tracking stable, we can set a hard limit of 2 GB, which was not exceeded during the tests.
Table 1. RGBD SLAM timings of our RGB-D approach during the tests
Step time
SIFT computation 40.5 ms Tracking 102. 2ms Similarity search 5.2 ms
Loop closure 355.7 ms Avg. time 187.6 ms
Table 2. RGBD SLAM timings and memory usage of some datasets computed using our RGB-D approach
Memory Usage
Dataset Size Key-frames Edges Features Patches M M with depth data Residence-RS 30.8m2 242 290 84714 5590 49.6 MB 619.5 MB
Residence-CL 43.5m2 243 443 171302 8775 98.1 MB 675.4 MB
Health-care-LG 109m2 305 475 115823 7960 68.1 MB 786.4 MB
Health-care-VI 215m2 546 635 306657 17656 177.3 MB 1469.2 MB
7.3. Visual Tracker
For our Visual Tracker module, we tested separately the initialization/re-localization steps and the tracking accuracy.
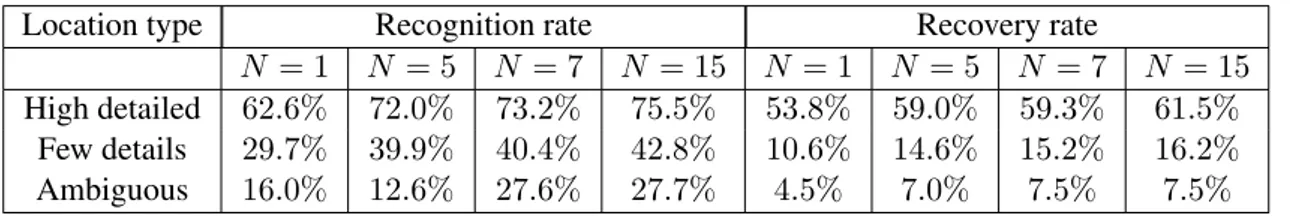
Initialization/Re-localisation. We tested our recovery step using labelled frame sequences from the moving device in the mapped environment. Each location was classified accordingly the following categories: regions with high amount of distinguishable features (300 or more), regions with low or very sparse amount of features, regions with very little distinct/ambiguous appearance such as hallways and corridors.
The graph-based approach improved significantly the recognition rates, allowing infer the user location even when not able to calibrate the camera. See table 3.
Table 3. Recognition rates of the re-localization algorithms
Location type Recognition rate Recovery rate
N = 1 N = 5 N = 7 N = 15 N = 1 N = 5 N = 7 N = 15 High detailed 62.6% 72.0% 73.2% 75.5% 53.8% 59.0% 59.3% 61.5%
Few details 29.7% 39.9% 40.4% 42.8% 10.6% 14.6% 15.2% 16.2% Ambiguous 16.0% 12.6% 27.6% 27.7% 4.5% 7.0% 7.5% 7.5%
It was noted that regions with few details are very problematic, requiring the user to look at some region with some recognizable feature like a painting or furniture. Particularly, long and featureless hallways had certain regions where the system was not able determine its position unless the user pointed the device to more detailed or not ambiguous regions (such as a doorway). This situation is problematic with purely visual approaches and is a limitation of the current implementation, which should be dealt with another kind of sensors such as IMUs or the recently developed miniaturized depth sensors, so measurements can be done in case of lack of visual data.
Tracking accuracy and performance. To verify the accuracy of our visual tracker, we per-formed tests with videos obtained from virtual and real environments under several adverse situations. For both kind of video sequences we tested our proposed algorithm with maps extracted with Visual and RGB-D SLAM approaches. More specifically, we generated a sparse map Ms computed by the popular PTAMM algorithm [16], which has support for
separated and uncoupled sparse maps for large environments, and a dense mapMd. We also,
performed a comparison of the tracking performance of the PTAMM algorithm with the same video sequences. For the tests where a ground-truth trajectory was available, we computed the computed camera pose error.
At the time of the preparation of our tests, we also tried to adapt the Forster et al. SVO algorithm [24], but tests showed that it was unable to prepare a proper map to the tested environments as PTAMM did. The most recent work of the Engel et al., the LSD-SLAM [23] was not available at the moment of development of this work, so it was not possible to evaluate their behaviour properly.
from a ”tour” video sequence that allowed recover the proper geometry of the environment using the PTAMM algorithm. The map Md was extracted directly from the environment
geometry, using key-frames extracted from positions with regular intervals. For both cases, the procedure described in section 4 was used.
Real environment. We tested also our proposed method in real world video sequences taken from two environments. The first was a laboratory corridor with sufficient amount of de-tailed features for tracking, which was denominated theCdataset. The second dataset was a small desktop table filled with several objects, which was denominated datasetM. For the first dataset, we created both a sparse and dense map using respectively the PTAMM algorithm with the DCPAR prototype and our proposed RGB-D algorithm using a Microsoft Kinect camera. Due the high degree of occlusion and amount of reflexive objects, we generated only a sparse map for the datasetM. For both datasets we tested the algorithm behaviour by changing objects of position, and under significant motion blur.
The datasets video sequences characteristics are detailed in table 4 and figure 14.
Table 4. Characteristics of the tested videos: (o) feature occlusion, (m) motion, (l) adverse lighting, (b) motion blur, (u) navigating in unmapped regions
Synthetic Real
Video Frames Notes Video Frames Notes
S0 241 [m] C0 1207 [o,b,m]
S1 241 [o,m] C1 425 [o,b,m]
S2 241 [b,m] C2 1015 [o]
S3 241 [o,b,m] C3 709 [o,m]
S4 241 [l,m] C4 666 [o,b,m,u]
S5 241 [l,o,m] M0 711 [o,m]
S6 241 [l,b,m] M1 510 [o,b,m]
S7 241 [l,b,o,m]
S C M
Figure 14. Test datasets used in the Visual Tracker tests
The performance achieved by the tracker was satisfactory. Besides the slow initialization step, which is needed for a precise initialization, the system was able to achieve real-time performance and fluid tracking in all tests. See table 5
Regarding accuracy and tracking, our Visual tracker achieved superior results than the PTAMM algorithm in all instances, using its own sparse mapMs. For all datasets, the Visual
Table 5. Timings of our Visual Tracker approach during the tests
Step time
Initialisation/Recovery 203.1 ms
Tracking 20 ms
Similarity search 2.5 ms Triang. + B.A. 32 ms Avg. time 32 ms
Table 6. Tests with computed values ofL(tracking losses),κ(successfully calibration) ande¯(RMS error)
Video Visual TrackerMs Visual TrackerMd PTAMM
L κ ¯e L κ e¯ L κ e¯ S0 0 1.00 0.048 0 1.00 0.008 0 0.98 0.042 S1 0 1.00 0.049 0 1.00 0.008 0 0.98 0.043 S2 0 1.00 0.062 0 1.00 0.055 1 0.85 1.002 S3 0 1.00 0.061 0 1.00 0.082 1 0.84 0.732 S4 0 1.00 0.042 0 1.00 0.009 3 0.79 7.679 S5 0 1.00 0.037 0 1.00 0.012 3 0.48 2.897 S6 0 1.00 0.060 0 1.00 0.046 2 0.11 1.507 S7 0 1.00 0.064 0 1.00 0.051 2 0.14 4.774 M0 0 1.00 - - - - 6 0.92 -M1 0 1.00 - - - - 13 0.67 -C0 2 0.99 - 0 1.00 - 10 0.52 -C1 1 0.97 - 0 1.00 - 2 0.88 -C2 0 1.00 - 0 1.00 - 4 0.79 -C3 0 1.00 - 0 1.00 - 3 0.81 -C4 9 0.83 - 11 0.87 - 11 0.71
-8. Conclusions and future work
Our initial results showed that the system is robust and easy to integrate in most of resi-dences and health-care centres, taking advantage of already existent infrastructure. The pro-posed RGB-D and Visual Tracker module is also precise for indoors Augmented Reality ap-plications for most class of wearable devices which are capable to stream and receive images through a Wireless connection. The installation of the system and mapping procedures are also scalable and not lengthy, allowing a easy and low cost mapping for either small and large buildings.
Validations with users in residences and health-care centres were performed in a separate study [41], evaluating degree of comfort of the tested prototype, desired applications an pos-sible undesired effects that it may bring to their routines. Initial results showed that the user feedback is mostly positive for this kind of application with strong potential to be a innovation in the field of Assisted Living.
S3 -2 0 2 4 6 8
0 50 100 150 200 250
frame
VisualTracker Traj. x
PTAMM Traj. x
Ground-truth Traj. x
Visual Tracker Error. x
PTAMM Error. x
PTAMM L
185 C0 0.6 0.8 1 1.2 1.4 1.6 1.8 2 2.2 2.4
0 200 400 600 800 1000 1200 1400
frame
Visual Tracker Traj. x
Visual Tracker L
1137 PTAMM Traj. x
PTAMM L
135 332 377429490 765 795833 917 1018 M1 -1.8 -1.6 -1.4 -1.2 -1 -0.8 -0.6 -0.4 -0.2
0 100 200 300 400 500 600
frame
Visual Tracker Traj. x
PTAMM Traj. x
PTAMM L
21326178 104 160 217 268 307 351 379 404 461
Figure 15. Computed camera pose in thexaxis (in metres) of the Visual Tracker and PTAMM algo-rithms for the video sequencesS3,C0andM1using a sparse mapMs
Visual Odometry and SLAM approaches, and should be overcome with sensorial data from other sources such as IMUs and accelerometers.
We are currently working towards the development of a lightweight version of the Visual Tracker approach, using Semi-Dense tracking and fast descriptors such as AKAZE [42], in a way that it can be feasible to be used in mobile phones and tablets, allowing perform measure-ments with aid of their accelerometers as well achieve minimal communication delay with the wearable device. Additionally, we are investigating the usage of new generation of tablets such as Project Tango, dotted of stereo cameras and depth sensors, such that all the mapping and tracking procedure can be performed only with easy to use mobile devices.
Acknowledgements
References
[1] Ekahau: Ekahau Vision. http://www.ekahau.com/real-time-location-system /technology/ekahau-vision. Accessed: 2014-02-11.
[2] Ubisense: Ubisense RTLS Hardware. http://www.ubisense.net. Accessed: 2014-05-12.
[3] Technologies, S.: Sonitor Sense RTLS. http://www.sonitor.com/. Acessed: 2014-05-12.
[4] Technologies, E. S.: MotionSTAR Wireless LITE. http://www.est-kl.com/products /motion-tracking/ascension/motionstar-wireless-lite.html. Accessed: 2014-02-11.
[5] Technologies, E. S.: PowerTRAK 360. http://www.est-kl.com/en/products /motion-tracking/polhemus/powertrak-360.html. Accessed: 2015-05-31. [6] Aviles-Lopez, E., Villanueva-Miranda, I., Garcia-Macias, J., Palafox-Maestre, L.: Taking Care of
Our Elders through Augmented Spaces. In: Web Congress, 2009. LA-WEB ’09. Latin American, pp. 16–21. 2009.
[7] Kurz, D., Fedosov, A., Diewald, S., Guttier, J., Geilhof, B., Heuberger, M.: [Poster] Towards mobile augmented reality for the elderly. In: Mixed and Augmented Reality (ISMAR), 2014 IEEE International Symposium on, pp. 275–276. 2014.
[8] Mistry, P., Maes, P.: SixthSense: A Wearable Gestural Interface. In: ACM SIGGRAPH, pp. 11:1–11:1. ACM, New York, NY, USA, 2009.
[9] Lowe, D. G.: Distinctive Image Features from Scale-Invariant Keypoints. Int. J. Comput. Vision, 60(2), pp. 91–110, 2004. ISSN 0920-5691.
[10] Bay, H., Tuytelaars, T., Van Gool, L.: SURF: Speeded Up Robust Features. In: Leonardis, A., Bischof, H., Pinz, A. (eds.), Computer Vision – ECCV 2006, volume 3951 ofLecture Notes in Computer Science, pp. 404–417. Springer Berlin / Heidelberg, 2006. ISBN 978-3-540-33832-1. [11] Rublee, E., Rabaud, V., Konolige, K., Bradski, G.: ORB: An Efficient Alternative to SIFT or
SURF. In: International Conference on Computer Vision. Barcelona, 2011.
[12] Alcantarilla, P. F., Bartoli, A., Davison, A. J.: KAZE Features. In: Computer Vision – ECCV 2012, volume 7577 ofLecture Notes in Computer Science, p. 214–227. Springer Berlin Heidel-berg, 2012. ISBN 978-3-642-33782-6.
[13] Fischler, M. A., Bolles, R. C.: Random Sample Consensus: A Paradigm for Model Fitting with Applications to Image Analysis and Automated Cartography. Commun. ACM, 24(6), pp. 381–395, 1981. ISSN 0001-0782.
[14] Klein, G.: Visual tracking for augmented reality. Ph.D. thesis, University of Cambridge, 2006. [15] Klein, G., Murray, D.: Parallel Tracking and Mapping for Small AR Workspaces. In: Proc. Sixth
IEEE and ACM International Symposium on Mixed and Augmented Reality (ISMAR’07). Nara, Japan, 2007.
[16] Castle, R., Klein, G., Murray, D.: Video-Rate Localization in Multiple Maps for Wearable Aug-mented Reality. In: IEEE International Symposium on Wearable Computers (ISWC), pp. 15–22. 2008. ISSN 1550-4816.
[17] Rosten, Drummond: Fusing points and lines for high performance tracking. In: IEEE Interna-tional Conference on Computer Vision, volume 2, pp. 1508–1511. 2005.
[18] Klein, G., Murray, D.: Parallel Tracking and Mapping on a Camera Phone. In: Proc. Eigth IEEE and ACM International Symposium on Mixed and Augmented Reality (ISMAR’09). Orlando, 2009.
[19] Weiss, S., Achtelik, M., Lynen, S., Achtelik, M., Kneip, L., Chli, M., Siegwart, R.: Monocular Vision for Long-term Micro Aerial Vehicle State Estimation: A Compendium. Journal of Field Robotics, 30(5), pp. 803–831, 2013. ISSN 1556-4967.
In: IEEE International Conference on Image Processing (ICIP), 2009 16th, pp. 4285–4288. 2009. ISSN 1522-4880.
[21] Newcombe, Lovegrove, Davison: DTAM: Dense tracking and mapping in real-time. In: IEEE Int. Conf. on Computer Vision (ICCV), pp. 2320–2327. 2011. ISSN 1550-5499.
[22] Engel, J., Sturm, J., Cremers, D.: Semi-dense Visual Odometry for a Monocular Camera. In: IEEE International Conference on Computer Vision (ICCV 2013), pp. 1449–1456. 2013. [23] Engel, J., Sch¨ops, T., Cremers, D.: LSD-SLAM: Large-Scale Direct Monocular SLAM. In:
Fleet, D., Pajdla, T., Schiele, B., Tuytelaars, T. (eds.), Computer Vision – ECCV 2014, volume 8690 of Lecture Notes in Computer Science, pp. 834–849. Springer International Publishing, 2014. ISBN 978-3-319-10604-5.
[24] Forster, C., Pizzoli, M., Scaramuzza, D.: SVO: Fast Semi-Direct Monocular Visual Odometry. In: IEEE International Conference on Robotics and Automation (ICRA), p. 15–22. 2014. [25] Izadi Hillige Molyneaux Kim Davison Kohi Shotton Hodges Fitzgibbon, N.: KinectFusion:
Real-time dense surface mapping and tracking. In: IEEE Int. Symp. on Mixed and Augmented Reality (ISMAR), pp. 127–136. 2011.
[26] Meilland, M., Barat, C., Comport, A.: 3D High Dynamic Range dense visual SLAM and its application to real-time object re-lighting. In: IEEE Int. Symposium on Mixed and Augmented Reality (ISMAR 2013), pp. 143–152. 2013.
[27] Henry, P., Krainin, M., Herbst, E., Ren, X., Fox, D.: RGB-D Mapping: Using Kinect-style Depth Cameras for Dense 3D Modeling of Indoor Environments. Int. Journal of Robotics Research, 31(5), pp. 647–663, 2012. ISSN 0278-3649.
[28] Whelan, Kaess, Fallon, Johannsson, Leonard, McDonald: Kintinuous: Spatially extended kinect-fusion. Technical Report MIT-CSAIL-TR-2012-020, Massachusetts Institute of Technology, 2012.
[29] Whelan, T., Kaess, M., Johannsson, H., Fallon, M., Leonard, J., McDonald, J.: Real-time Large Scale Dense RGB-D SLAM with Volumetric Fusion. Intl. J. of Robotics Research, IJRR, 34(4-5), pp. 598–626, 2015.
[30] Inc., G.: Project Tango. https://www.google.com/atap/project-tango. Ac-cessed: 2015-05-31.
[31] Intel: RealSense Technology. http://www.intel.com/content/www/us/en /architecture-and-technology/realsense-overview.html. Accessed: 2015-05-31.
[32] OGRE: Open Source 3D Graphics Engine. http://www.ogre3d.org. Accessed: 2015-05-31.
[33] Unity: Unity 3D Engine.http://unity3d.com. Accessed: 2015-05-31.
[34] Nister, D., Stewenius, H.: Scalable Recognition with a Vocabulary Tree. In: IEEE Computer Society Conference on Computer Vision and Pattern Recognition, volume 2, pp. 2161–2168. 2006. ISSN 1063-6919.
[35] Shi, J., Tomasi, C.: Good features to track. In: Computer Vision and Pattern Recognition, 1994. Proceedings CVPR ’94., 1994 IEEE Computer Society Conference on, pp. 593–600. 1994. ISSN 1063-6919.
[36] Varadarajan, V. S.: Lie groups, Lie algebras, and their representations, volume 102. Prentice-Hall Englewood Cliffs, NJ, 1974.
[37] Rusu, R. B., Cousins, S.: 3D is here: Point Cloud Library (PCL). In: IEEE International Confer-ence on Robotics and Automation (ICRA). Shanghai, China, 2011.
[38] Grisetti, Stachniss, Grzonka, Burgard: A tree parameterization for efficiently computing maxi-mum likelihood maps using gradient descent. In: In Proc. of Robotics: Science and Systems. 2007.
[40] Wu, C.: SiftGPU: A GPU Implementation of Scale Invariant Feature Transform (SIFT). http: //cs.unc.edu/˜ccwu/siftgpu, 2007.
[41] Saracchini, R., Catalina-Ortega, C., Bordoni, L.: A Mobile Augmented Reality Assistive Tech-nology for the Elderly. Comunicar, 23(45), pp. 65–74, 2015.
[42] Alcantarilla, P. F., Nuevo, J., Bartoli, A.: Fast Explicit Diffusion for Accelerated Features in Nonlinear Scale Spaces. In: British Machine Vision Conf. (BMVC). 2013.