Journal of Computer Science 2 (8): 612-614, 2006 ISSN 1549-3636
© 2006 Science Publications
Corresponding Author: Dr. M. Narayana Rao, Dr. MGR Deemed University, Chennai, India 612
Knowledge Based System for Visual Computing of Depth in 2D Images of
Geometric Objects Like Straight Lines, Planes and Solids
and their Applications in Engineering Graphics
1
M. Narayana Rao and
2V. VaithyaNathan
1MGR Deemed University, Chennai - 95, Tamil Nadu, South India
2Department of CSE, SASTRA, Tanjore, South India
Abstract: An attempt was made in this study, to develop a ”Knowledge Based System” for i)computing the depth (or the third dimension) of 3D objects, ii) computing the inclinations of 2D planes with predefined reference planes and iii) computing the inclinations of a straight line with predefined reference planes. The development of the proposed “Knowledge Based System” was based on the “Principle of Color Gradation”.
Key words: Color gradation, 3D, straight lines, plane figures, 3D solids
INTRODUCTION
The development of the proposed “Knowledge Based System” is based on the “Principle of Color Gradation”. This method is based on the fact that, “The gray color intensity (or the pixel value of the gray color) on the surface of an object, gets faded away, as they move farther from the observer and ultimately, gets merged with the distant background color”. The maximum variation in the pixel value is between 0 and 255, with 0 corresponding to pure black, and 255 corresponding to pure white[1].
Literature review reveals that, conventional methods based on the principles of “Orthographic Projections” are available for developing Knowledge Based System to compute the above said depth etc. However, no attempt was made to develop a Knowledge Based System, based on the principle of “Color Gradation” exclusively for applications in Engineering Graphics. Hence the paper.
The Conventional method of obtaining i),ii),iii) as given in Abstract are based on the principles of Orthographic Projections. Here more emphasis is given on the Human capabilities for computation. A Vertical Plane(VP) and a Horizontal Plane (HP) which are perpendicular to each other are used in the conventional method.
An attempt is made in this paper to make use of Computer capabilities to develop a “Knowledge Based System”, for i)computing the depth (or the third dimension of 3D objects, ii)computing the inclinations of 2D planes with Vertical and Horizontal planes and iii)computing the inclinations of a straight line with the vertical and horizontal planes.
The development of the proposed “Knowledge Based System” is based on the “Principle of Color Gradation”. This method is based on the fact that, “The gray color intensity (or the pixel value of the gray
color) on the surface of an object, gets faded away, as they move farther from the observer and ultimately, gets merged with the distant background color”. The maximum variation in the pixel value is between 0 and 255, with 0 corresponding to pure black and 255 corresponding to pure white.
Assumptions made to ensure the conditions of orthographic projection : In this proposed method a Computer acquired image of the object is obtained, making sure that the image corresponds to the one as obtained in Orthographic projection. To achieve this, the various assumptions made are: The observer looks at the object (say, a straight line of one metre length) from a fairly long distance (20 metres), in order that the visual rays are parallel to each other and are perpendicular to the plane of projection (Vertical Plane). A plane perpendicular to the Vertical plane is imagined and is termed as Horizontal Plane. Through out the period of obtaining the Computer acquired images of the objects, the light intensity (day light) is assumed to be uniform and the same conditions are used while using this Expert System for further investigations.
MATERIALS AND METHODS
J. Computer Sci., 2 (8): 612-614, 2006
613 using a high resolution Digital Camera. A detailed analysis of these lines is made, to compute the Ratio (R) between the gray color intensity variation between two points on the line and the corresponding length of the acquired line. These ratios (R) are computed for various inclinations (n) of the line and are listed in Table 2[2].
Fig. 1: Computer acquired images of a straight line parallel to ground (horizontal plane) making different angles with a vertical plane
Fig. 2: Variation of pf (pixel value) with xf (a point on the acquired line) for different values of n. Origin refers to xi = 0 and pf =140. All the lines are best fitting curves
There are slight variations in the positions of various points which could not be shown in the graph with the fear that they may hinder with the existing clarity of the graphs. The best fitting curves are drawn making use of the principles of statistics for best fitting curves.
Table 1 gives the variation of pf value with xf for a given known value of n. The average value of R for the given angle (n=25) is computed with this table.
Keeping the ambient conditions (day light etc) the same, the computer-acquired image of a line parallel to Horizontal Plane making an unknown angle with the
Table 1: (n = 25°), 18 such tables can be computed for n = 0 to 90 in steps of 5°
S.No xi pi xf Pf R=(pf-pi)/(xf-xi)
1 0 140 9 144 4/9 = 0.46
2 0 140 18 148 8/18 = 0.44
3 0 140 27 153 13/27 = 0.48
4 0 140 36 157 14/36 = 0.52
5 0 140 45 161 21/45 = 0.47
6 0 140 54 165 25/54 = 0.46
7 0 140 63 170 30/63 = 0.48
8 0 140 72 174 34/72 = 0.47
9 0 140 82 178 38/82 = 0.46
10 0 140 91 182 42/91 = 0.46
Average Ratio = R = 0.47
xi = location of initial point on the line pi = pixel value at xi
xf = location of final point on the line pf = pixel value at xf
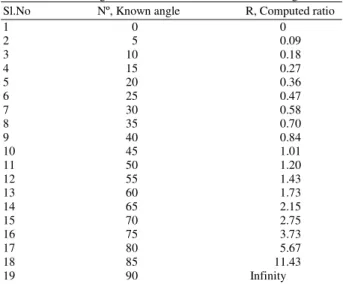
Table 2 : Indicating the variation of ratio R with known angle n
Sl.No Nº, Known angle R, Computed ratio
1 0 0
2 5 0.09
3 10 0.18
4 15 0.27
5 20 0.36
6 25 0.47
7 30 0.58
8 35 0.70
9 40 0.84
10 45 1.01
11 50 1.20
12 55 1.43
13 60 1.73
14 65 2.15
15 70 2.75
16 75 3.73
17 80 5.67
18 85 11.43
19 90 Infinity
Vertical Plane is obtained. The above-referred ratio (R) for this line is computed. Using the calibration curve, the unknown angle is determined. This computed angle is related to the depth of the other end of the line, by suitably developed Trignometrical equation, namely:
n=Tan-1( R ) (1)
J. Computer Sci., 2 (8): 612-614, 2006
614 Fig. 3: A graph between computed ratio (r ) on the x
axis and tan n on the y axis
the acquired line arrives at these values of computed ratios R. Figure 3 gives the calibration curve.
The above analysis is, for computing depth in Horizontal direction. A similar analysis is made for computing depth in Vertical direction. This time the same straight line, is considered as parallel to Vertical Plane. One end of the line is fixed and the line is rotated about the fixed point to make different angles with Horizontal Plane[4]. The same procedure is repeated. The ambient conditions are kept the same [2].
The computer acquired images are in black and white mode(Gray color mode), which will help in, easy finding of the pixel values.
Extension of this analysis for computing the depth for 2D planes and 3D solids: The analysis of a 2D plane or the 2D surface of a 3D geometric solid can be made using the above methodology. We may consider a line parallel to HP on the 2D plane or a line parallel to HP on the 2D surface of 3D solid. The inclinations made by this line with VP also correspond to the inclination of the plane or the 2D surface of a 3D solid with VP.
Finally a Data Base can be created for lines of varying length and making different known angles. An extended Data Base is also created for planes and solids. A knowledge component can be introduced to this data base, which forms the proposed “Knowledge Based System”, as envisaged in the title of the paper.
A comparison made, between the results obtained from the proposed system and those from the conventional system, reveals that the variation in the depth is with in ±2%. This is due to the limitations in the accuracy, with which the pixel values can be read.
RESULTS AND DISCUSSION
As seen above, a comparison between the values obtained from the conventional method and from the proposed method reveal that the variation is within ±2%. This variation may be attributed due to the fact that, there can be a small error in reading the pixel values at different points along the acquired straight line. Since the variation is only within ±2%, this method of computing depth etc can reasonably used for solving problems on Engineering Graphics. There is ample scope for future work in this direction, provided we can develop a method of reading the pixel values with higher degree of accuracy. This proposed method offers a good substitution for solving problems in Engineering Graphics and eliminates the tedious methods involved in Engineering Graphics like Line Rotation Method, Trapezoidal Method etc.
CONCLUSION
Apart from using this “Knowledge Based System” for analysis of 3D solids etc, its applications can be extended to the area of computer Integrated Manufacturing (CIM), Mathematical Programming, Rapid Manufacturing and Satellite Picture Reading etc. The reliability and accuracy of the proposed method for computing depth largely depends on Simulating the identical ambient conditions used while obtaining the data for preparing the calibration curve. Any variation in the ambient conditions will alter the pixel values considerably and will lead to unrealistic results.
REFERENCES
1. Xin, L., J. Deng and C. Xu, 2003. Visualization of piecewise algebraic surfaces. Proc. IEEE Intl. Conf. Acoustics, Speech and Signal Processing, 1 : 16-19.
2. Al-Jibouri, S.H. and M.J. Mawdesley, 2002. A knowledge based system for linking information to support decision making in construction. Itcon, Special Issue ICT for Knowledge Management in Construction, 7 : 83-100.
3. Wencheng, W., Y. Wu, Q. Sun and W. Enhua, 1997. Decomposing polygons into stripes for fast rendering. IEEE Trans. Engineering Management, pp : 79-90.