ISSN 1546-9239
© 2009 Science Publications
Corresponding Author: Siamak Jamshidi, School of Physics, University Sains Malaysia, 11800 USM, Penang, Malaysia Tel: 0060174645462 Fax: 00604657 9150
A Study on Concentrations of Dissolved Oxygen and Chlorophyll-a in the
Coastal Waters of Babolsar
1
Siamak Jamshidi,
1Noordin Bin Abu Bakar and
2Marzieh Yousefi
1
Department of Geophysics, School of Physics, University Sains Malaysia, Penang, Malaysia
2
Department of International
Affairs
, Iranian National Center for Oceanography,
No. 3, Etemadzadeh St., Fatemi Ave., Tehran,
P.O. Box 14155-4781, Iran
Abstract: Problem statement: Dissolved Oxygen (DO) and Chlorophyll-a (Chl-a) are two vital requirements for marine ecosystems. Nowadays, discharge of large amounts of industrial, agricultural and urban wastes threats the Caspian Sea (CS) environment. With regard to the elevation of nutrient contents, average of DO concentrations in the deeper layers of the CS is reducing. On the other hand, increased amounts of phytoplankton in water bodies in reaction to the enhancement of nutrient supply can have severely damaging effects on the marine environment. According to the importance of DO and Chl-a in marine ecosystems of the Caspian, we attempted to investigate the distributions of DO and Chl-a in the southern coastal waters of the CS in present study. Approach: DO and Chl-a concentrations were analyzed using field measurements data over the southern continental shelf near Iranian coasts. The data were collected at 13 stations along three transects down to 42 m depth in east part of the southern coasts of the CS, off Babolsar in autumn 2008. Results: In the time of measurements, the DO concentrations ranged between 8.4 and 11.2 mg L−1 in the area. Amounts of the Chl-a were varied between 1.3-4.2 mg m−3 with the maximal levels at 15 m depth. The formation and destruction of seasonal thermocline affect the DO and Chl-a concentrations in vertical direction.
Conclusion: The collected data present useful knowledge about distributions of DO and Chl-a in the coastal waters of Babolsar and near mouth of Babolrood River. Amounts of DO and Chl-a in the region were under effects of Babolrood River discharge, stratification of water column (seasonal thermocline) and atmospheric processes. The results indicate the need of serious efforts for reducing entrance of human activities wastes and pollutants into the Caspian environment.
Key words: Marine environment, nutrients, pollution, vertical structure, phytoplankton
INTRODUCTION
The Caspian Sea (CS), as the largest enclosed water body on the planet with a special marine environment and rich natural resources (biological and mineral) plays an important role in the Circum-Caspian countries and world. Fishing and oil (and gas) extraction are the most important industries in the Caspian region[1-3]. The CS is the unique water body in the world which has a large stock of sturgeon with 85% of world’s caviar production[4,5].
Nowadays the CS (especially south basin) is one of the heavily polluted seas. The Caspian environment due to extensive exploitation and discharge of large magnitudes of human wastes is under high stress[4,6]. From the main sources of the CS pollution: Industrial and agricultural wastewaters, municipal domestic sewage waters, heavy metals, oil and petroleum
products, nutrients such as phosphate and nitrate, pesticides and detergents can be mentioned[2,4,6].
Since the beginning of the twentieth century, the large river discharge into the CS was characterized by reduced concentrations of DO and increased nutrient contents. Enhancement in nutrient supply (due to increase of rivers inflow) and reduce in severity of winter are the most important factors for unfavorable ventilation of deep waters of the Southern Caspian[7].
Nowadays, the DO amounts in the CS deep-water are unsuitable to most aquatic organisms[7]. DO levels of below 3 mg L−1 are stressful to most aquatic organisms. Its levels of at least 5-6 mg L−1 are usually required for growth.
Chl-a is the main photosynthetic pigment and included in the all of phytoplankton. Chl-a concentrations are an important indicator of phytoplankton abundance and biomass in coastal waters and state of their environment[8]. The efficient measurement of primary productivity is a purpose of biological oceanographers[9].
On the other hand, high levels of phytoplankton can be harmful for marine environment and ecosystems. This phenomenon occurs, as act to entrance of nutrient reservoir (due to entrance the wastes of agricultural and industrial activities) for the plants (such as nitrates and phosphates). As an instant, due to the high growth of phytoplankton a large scale Anomalous Algal Bloom (AAB) occurred for the first time in the southern CS during August-September 2005[10].
Therefore, the investigation on distributions of DO and Chl-a are very important requirements for the water quality studies, ecological characteristics and level of safety of marine environment in the CS[11,12]. Under these conditions, it is necessary to take increasingly in ecological and environmental studies of the structure and dynamics of the CS waters[2].
The aim of this research is the analysis and characterize of DO and Chl-a concentrations and their variability over the east part of the southern continental shelf of the CS in fall. For this purpose, data collection was carried out in the coastal waters of Babolsar Port in north of Iran in autumn 2008. Furthermore, effect of Babolrood River on distributions of DO and Chl-a in the time of measurements is investigated.
DO and Chl-a in the Caspian Sea: The oxygen regime in the various parts of the CS strongly is different. Variation of oxygen in the upper layers of the southern Caspian seawater is under effects of some factors. Seawater compositions and temperature, vertical stratification, development of phytoplankton and related photosynthetic activity are some of the important effective parameters in DO variations of the Caspian seawater[7].
Based on the previous measurements and studies in the CS, distribution of DO in the South Caspian is as follow:
• In the upper layers of the southern CS, wintertime oxygen concentrations are mainly varied from 7-7.5 mg L−1. In the spring with intensive photosynthesis proceeds in the upper 20 m layer, oxygen values incensement is about 0.2-0.3 mg L−1 related to the winter. In summer, the greatest surface concentrations of DO are about 6.0-6.5 mg L−1. In the fall, with destruction of the seasonal thermocline this value is reached to 6.5-7.5 mg L−1[7]
• Climatic fields of DO concentrations in the surface layer of the eastern part of the southern coastal waters of the CS (near the study area) were reported about 7.4 and 5.8 mg L−1 in winter and summer, respectively[7]
On the large scale, the variations of Chlorophyll in the CS are under effect of North Atlantic Oscillation Index, Volga discharge, sea surface temperature and wind stress anomalies over different regions of the CS[5,12].
Owing to the geographical conditions and bottom topography, the CS can be subdivided into three parts: Northern, Middle and Southern Caspian. The deep parts of the Caspian (southern and middle) and shallow northern part are very different in hydrological ecological conditions.
The deep southern and middle parts of the CS are characterized with a clear vertical stratification and a sharp thermocline. The existed thermocline layer operates as a strong nutrient limitation of phytoplankton growth[5,12]. Here, the process of phytoplankton growth is regulated by vertical stratification of seawater column. The established summertime pycnocline works as a natural boundary separating deep layers (rich in nutrient) from upper mixed layer (well illuminated) where phytoplankton is concentrated. In the northern CS, Chl-a is under effects of Volga and Ural Rivers[12].
However, in the autumn due to wind stress and the cooling of the CS surface erode the pycnocline, resulting in an increase of nutrient flux into the upper layer, which in turn stimulates phytoplankton growth[12].
In the southern basin of the CS, the seasonal pattern of Chl-a shows a maximum rate in Chl-a concentration in August that is together with maximum Sea Surface Temperature (SST) and wind stress. It should be noted that, with regard to analyzing the seasonal Chl-a concentration, the maximum concentration of Chl-a recorded in summer 2001 that was not related to SST and wind stress. Some researcher believe that this value was due to invasion of the carnivorous ctenophore Mnemiopsis leidyi to the middle and southern CS[12].
MATERIALS AND METHODS
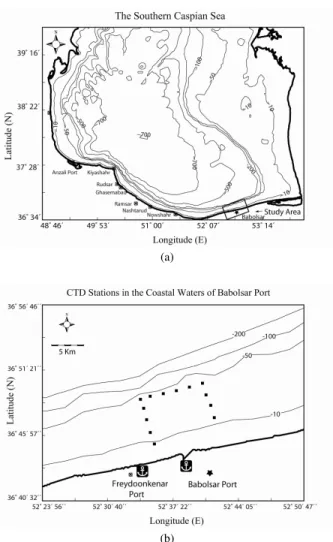
area was selected as indicator of eastern part of the southern continental shelf of the CS. Based on topographic maps in this area, slope of seabed is not very sharp and the continental shelf has a width of about 10 km. The depth from the coast increases gently to less than 50 m near the shelf break.
In the middle part of the study region, Babolrood River is located. This river is one of the important rivers along the southern coastline of the CS. It has a length of 88 km originated from the Elburs Mountain and entered to the CS. The biggest Iranian fisheries port in the eastern part of the southern coasts of the CS, Babolsar Port, was placed in the mouth of Babolrood River. In the western part of the study area, Freydoonkenar Port, which is a multi-purpose port, was established.
(a)
(b)
Fig. 1: (a) Study area in the southern CS; (b) positions of CTD stations, in the coastal waters of Babolsar port
The southern coasts of the CS are rimmed by Elburs Mountain that begins from the northwest to the northeast of Iran. Damavand mount is the highest peak in the Elburs mountain ridge with highest about 5671 m. The mountain ridge separates the southern coasts of the CS with a warm and humid subtropical climate from central areas of Iran. The maximum and minimum air temperatures are in August and January, respectively. In the winter, the air temperature ranges between 8-12°C and in summer the mean monthly air temperature over the entire sea equals 24-26°C. In the South Caspian, the mean annual wind speed is 3-4 m sec−1 with the recurrence rate of weak winds about 90%. In the southern part of the sea, there are not storms (wind speed greater than 15 m sec−1) during more than 20-30 days year−1[13].
The Caspian is an isolated sea from the World Oceans and the formation of thermohaline is under effect of atmospheric conditions over the sea and its vast drainage area[14]. The relative concentrations of Ca2+, Mg2+ and SO42– in the Caspian seawater are more
than in average world’s oceans waters[15]. The salinity of the CS is reported variable with an average of about 13 ppt[15] and about 12.28 g kg−1[16].
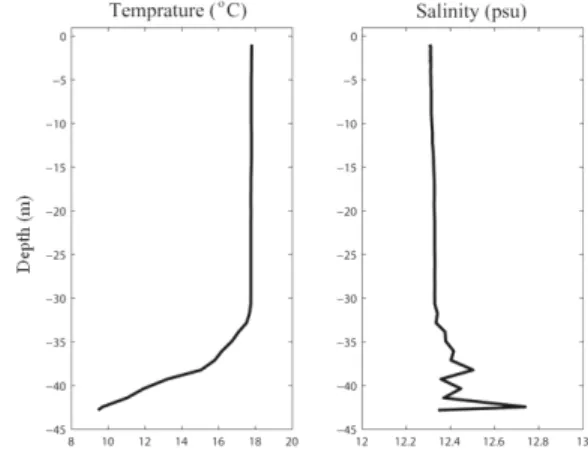
In the time of measurements, water column stratification in the study area was contained of surface mixed layer (upper 30 m depths) and thermocline (30-42 m depths). Maximum and minimum of temperature across the seasonal thermocline were 17.5 and 9.2°C, respectively[17]. The salinity (less than 12.2 psu) in the near shore stations was under the effect of Babolrood River. Salinity was found to vary between 12.06 and 12.67 psu. Processes of deepening surface mixed layer and erosion of the seasonal thermocline were occurred due to climate change and decrease of the air temperature in the region[17].
Table 1: Position and depths of stations sampled in the study area
Stations Latitude Longitude Depth (m)
St01 N36 45.123 E52 42.453 15
St02 N36 46.174 E52 42.084 22
St03 N36 47.198 E52 41.747 28
St04 N36 48.222 E52 41.411 36
St05 N36 48.087 E52 40.066 37
St06 N36 47.899 E52 38.720 40
St07 N36 47.710 E52 37.409 41
St08 N36 47.495 E52 36.131 42
St09 N36 47.171 E52 34.786 42
St10 N36 46.155 E52 35.138 32
St11 N36 45.099 E52 35.542 25
St12 N36 44.053 E52 35.905 17
St13 N36 43.008 E52 36.174 9
The distances between sampling stations were 2 km along transects. Two of transects were in perpendicular and one transect was parallel to the coastline. Table 1 shows location and depths of sampling stations in the coastal waters of Babolsar Port. Global Positioning System (GPS) and admiralty topographic map were used for identifying the positions and depths of the measurements stations. In addition, the depths of sampling stations were controlled with depth meter of vessel. After data collecting and quality controlling, in order to plotting the vertical structures of DO and Chl-a figures, Matlab software is used as the main tool.
RESULTS
Vertical profiles of temperature and salinity in one of the deepest stations (St08) in the study area were shown in Fig. 2. Mixed surface layer (between surface to 30 m depth) and thermocline (below 30 m depth) are clearly seen in the vertical profile of temperature. Range of variations of the salinity was very low. Variations of the salinity in the mixed surface layer were small.
In order to investigation on oxygen regime in the study area, vertical structures of the DO concentrations (absolute and relative DO) along three transects (western, eastern and alongshore transects) were presented in Fig. 3(a-f).
Vertical structures of DO concentration and percentage of saturation across the western transect were presented in Fig. 3a and 3b. DO concentrations through the vertical and horizontal directions were not homogenously varied in this transect. Concentrations of DO were found to range between 9.6 and 11 mg L−1 (percentage of saturation 104-126% sat).
DO structures along the eastern section over the continental shelf were presented in Fig. 3c and 3d. DO variations were between 8.4 and 11.2 mg L−1 (percentage of saturation 100-more than 126% sat).
Fig. 2: Profiles of temperature and salinity (St08)
Values of DO in the near coastline were more than offshore stations that can be under effect of local rivers.
According to the collected data, DO concentrations were gradually increased with depth. In the middle of the section, DO was found to increase from 9.8 mg L−1 (110% sat.) at the sea surface to 11.2 mg L−1 (percentage of saturation 126% sat.) at 20-25 m depth.
Figure 3e and 3f show the vertical DO structures in the alongshore transect. Concentrations of DO were found to vary from 8.4-10.8 mg L−1 (percentage of saturation 92-114% sat.). Here, values of DO near the bottom were more than upper layers. In addition, higher values of DO were observed in the western and eastern side of transect.
Away from the coastline and at the end of section, DO levels gently decrease at the sea surface with the horizontal gradient of about 0.8 mg L−1. At the beginning of the shelf with a width of about 2 km, higher values of DO (11 mg L−1) were observed. In the middle of the section, DO increased with depth and had a vertical gradient of about 1.2 mg L−1.
Totally, variations of DO in the study area were considerable. In the time of measurements, the DO concentrations in the study area ranged between 8.4 and 11.2 mg L−1 over the continental shelf. There were horizontal gradients with lower DO concentrations in the northern and eastern sides of the area. The seawaters near the coastline were highly oxygenated close to the bottom.
(a) (b)
(c) (d)
(e) (f)
(a) (b)
(c)
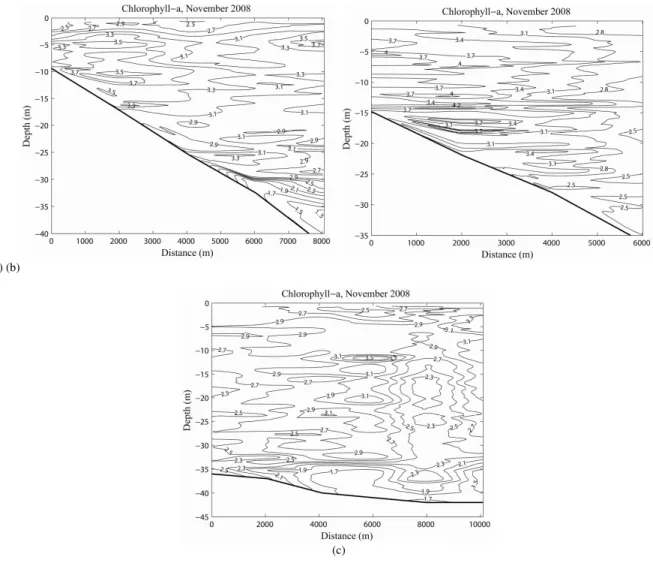
Fig. 4: Concentrations of Chl-a along western, eastern transects (the left of plots is to the south) and alongshore transects (the left of plots is to the east)
In the western transect (Fig. 4a), Chl-a variations were between 3.7 and 1.3 mg m−3. Concentrations of Chl-a in the subsurface layers were more than sea surface. At the sea surface layer Chl-a values ranged between 2.5-2.7 mg m−3. Vertical variation of Chl-a was not regular from surface to the bottom and reached to 1.3 mg m−3 at 35 m depth.
In the eastern transect (Fig. 4b), maximum values of the Chl-a concentrations, about 4.2 mg m−3 were seen at depths of 10-15 m. In comparison, the near shore stations had higher concentrations of Chl-a than onshore stations. At the end of the transect, Chl-a reached to 2.5 mg m−3 at 30-35 m depths.
Vertical variations of Chl-a in the alongshore transect were about 2.7 mg m−3 at the surface and increased to 3.1-3.5 mg m−3 below 10 m depth (Fig. 4c). Chl-a concentrations near the bottom were less than
upper layers due to less light in the depth. Concentrations of the Chl-a were mainly reached to 1.7 mg m−3 at depth of 42 m.
western and eastern transects. Horizontal gradient of Chl-a concentrations in the area were considerable.
DISCUSSION
Investigation on the DO and Chl-a concentrations is one of fundamental requirements in marine ecological, biological and environmental studies. There are not sufficient field measurement studies available to determine DO and Chl-a regime through the water column in the east part of the southern coastal area of the CS, especially near the Iranian coasts. In this study, vertical structures of DO and Chl-a concentrations over the southern continental shelf of the CS off Babolsar Port, near Iranian coasts were presented using field data collected autumn of 2008. Ranges of the observed concentrations of DO and Chl-a in this study are in agreement with previous researches[7,12]. The results of this study provide useful Knowledge on distributions of DO and Chl-a over the eastern part of the southern continental shelf of the CS in autumn.
Variability in the values of DO near the coastline can be due to the effect of Babolrood River inflow in the study area, stratification and coastal currents. The comparison between vertical structures of DO and Chl-a in the western Chl-and eChl-astern trChl-ansects shows Chl-a homogeneity in location of the maximum values of DO and Chl-a concentrations in each transect. Rivers discharges are represented main source of nutrients in the southern CS.
In the study area, Chl-a concentrations changed with the factors that effect phytoplankton growth. Some of those factors are amounts of sunlight, nutrient concentrations near coastline and amount of mixing (stratification). In addition, discharge of the Babolrood River affected the Chl-a concentrations in the study area.
Southern lagoons and coastal regions of the CS have been steadily polluted with anthropogenic sources (fertilizer and pesticides used in agriculture and increased nutrient load of river flows due to deforestation of woodland) since the early 1980s. Thus, simultaneous rises in nutrient contributed to increases in Chl-a values[18-20].
In autumn with seasonal climate changes and increase of turbulent kinetic energy, mixed layer deepens down to 30 m depth. Therefore, destruction of seasonal thermocline and pycnocline are started and nutrient flux into the surface layers. It is assumed that, due to locating of the study area near the mouth of Babolrood River, the Chl-a concentrations in the area were higher than other region of the southern coastline. However, in the autumn due to wind stress and the
cooling of the CS surface erode the pycnocline, resulting in an increase of nutrient flux into the upper layer, which in turn stimulates phytoplankton growth[12].
CONCLUSION
The study indicates necessity of the reduce entrance of the industrial, agricultural and urban wastes, which contains nutrient supply for the plants into the Caspian environment. According to the discharge of local rivers in the coastal waters, seawater in the near mouth areas has a different conditions from its open areas by the enhanced values of DO content, nutrient and Chl-a concentrations. Marine environment of the CS needs to the immediate and serious measures to prevent of entrance of the degradable wastes, nutrients and industrial pollutants.
ACKNOWLEDGEMENT
The used data in this research were measured during a research cruise in the coastal waters of Babolsar in the Southern CS, which supported by Iranian National Centre for Oceanography (INCO) and conducted by the first author of the study. Authors wish to thank the director (Dr. V. Chegini) and research deputy (Dr. H. A. Lahijani) of Iranian National Center for Oceanography (INCO) for their supports.
REFRENCES
1. Dumont, H.J., 1998. The Caspian Lake: History, biota, structure and function. Limnol. Oceanogr., 43: 44-52.
http://www.aslo.org/lo/toc/vol_43/issue_1/0044.pdf 2. Kosarev, A.N. and A.G. Kostianoy, 2005.
Introduction. In: Handbook of Environmental Chemistry, Hutzinger, O. (Ed.), Vol 2, Springer, ISBN: 9783540282815, pp: 1-3.
3. Zonn, I.S., 2005. Economic and International Legal Dimensions. In: The Caspian Sea Environment, (Handbook of Environmental Chemistry), Kostianov, A. and A.N. Kosarev (Eds.). Springer, ISBN: 9783540282815, pp: 243-256.
4. Zonn, I.S., 2005. Environmental Issues of the Caspian. In: The Caspian Sea Environment (Handbook of Environmental Chemistry), Kostianoy, A. and A.N. Kosarev (Eds.). Springer, ISBN: 9783540282815, pp: 223-242.
6. Korshenko, A.N. and A.G. Gul, 2005. Pollution of the Caspian Sea. In: The Caspian Sea Environment (Handbook of Environmental Chemistry), Kostianoy, A.G. and A.N. Kosarev (Eds.). Springer, ISBN: 9783540282815, pp: 109-142. 7. Tuzhilkin, V.S., D.N. Katunin and Y.R. Nalbandov,
2005. Natural Chemistry of Caspian Sea Waters. In: The Caspian Sea Environment, Kostianoy, A.G. and A.N. Kosarev (Eds.). Springer, ISBN: 9783540282815, pp: 83-108.
8. OzCoasts Australian Online Coastal Information, 2008. Chlorophyll a concentrations. http://www.ozcoasts.org.au/indicators/chlorophyll_ a.jsp
9. Haffman, K. and S. Intern, 1997. Chlorophyll fluorescence as a biological indicator of primary productivity.
http://www.mbari.org/education/internship/97inter ns/97internpapers/hoffman.pdf
10. Anomalous Algal Bloom, Feb. 2007. http://www.caspianenvironment.org/newsite/Caspi an-AAB.htm
11. Zaker, N.H., 2007. Characteristics and seasonal variations of dissolved oxygen. Intl. J. Environ.
Res., 1: 296-301.
http://www.sid.ir/En/VEWSSID/J_pdf/108220070 403.pdf
12. Nezlin, N.P., 2005. Patterns of Seasonal and Interannual Variability of Remotely Sensed Chlorophyll. In: Handbook of Environmental Chemistry, Kostianoy, A. and A.N. Kosarev (Eds.). Springer, ISBN: 9783540282815, pp: 143-157. 13. Kosarev, A.N., 2005. Phsico-Geographical
Conditions of the Caspian Sea. In: Handbook of Environmental Chemistry, Kostianoy, A. and A.N. Kosarev (Eds.). Springer, ISBN: 9783540282815, pp: 5-31.
14. Tuzhilkin, V.S. and A.N. Kosarev, 2005. Thermohaline Structure and General Circulation of the Caspian Sea Waters. In: Handbook of Environmental Chemistry, Kostianoy, A. and A.N. Kosarev (Eds.). Springer, ISBN: 9783540282815, pp: 33-57.
15. Millero, F.J. and P.V. Chetirkin, 1980. The density of Caspian Sea waters. J. Deep-Sea Res., 27: 265-271. DOI: 10.1016/0198-0149(80)90017-5
16. Peeters, F., R. Kipfer, D. Achermann, M. Hofer, W. Aeschbach-Hertig and K. Frohlich et al., 2000. Analysis of deep-water exchange in the caspian sea based on environmental tracers. J. Deep-Sea Res., 47: 621-654. DOI: S0967-0637(99)00066-7 17. Jamshidi, S. and N. Abu Bakar, 2009. Distribution
of temperature, salinity and density on the southern continental shelf of the Caspian Sea, off Babolsar; during the fall season. Proceeding of the 5th International Conference Asian Pacific Coastal, Oct. 2009, World Scientific Press, pp: 22-28. 18. Kideys, A.E., A. Roohi, E. Eker-Develi, F. Melin
and D. Beare, 2008. Increased Chlorophyll Levels in the Southern Caspian Sea Following an Invasion of Jellyfish. Res. Lett. Echolo., 2008: 4-4. DOI: 10.1155/2008/185642
19. Kideys, A.E. and M. Moghim, 2003. Distribution of the alien ctenophore Mnemiopsis leidyi in the Caspian Sea in August 2001. Mar. Biol., 142: 163-171. DOI: 10.1007/s00227-002-0932-4