• Nenhum resultado encontrado

Forest harvesting is associated with increased landslide activity during an extreme rainstorm on Vancouver Island, Canada

N/A
N/A
Protected

Academic year: 2017

Share "Forest harvesting is associated with increased landslide activity during an extreme rainstorm on Vancouver Island, Canada"

Copied!
50
0
0

Texto

(1)

NHESSD

2, 5525–5574, 2014

Extreme rainstorm on Vancouver Island,

Canada

J. N. Goetz et al.

Title Page

Abstract Introduction

Conclusions References

Tables Figures

◭ ◮

◭ ◮

Back Close

Full Screen / Esc

Printer-friendly Version Interactive Discussion

Discussion

P

a

per

|

Discus

sion

P

a

per

|

Discussion

P

a

per

|

Discussion

P

a

per

|

Nat. Hazards Earth Syst. Sci. Discuss., 2, 5525–5574, 2014 www.nat-hazards-earth-syst-sci-discuss.net/2/5525/2014/ doi:10.5194/nhessd-2-5525-2014

© Author(s) 2014. CC Attribution 3.0 License.

This discussion paper is/has been under review for the journal Natural Hazards and Earth System Sciences (NHESS). Please refer to the corresponding final paper in NHESS if available.

Forest harvesting is associated with

increased landslide activity during an

extreme rainstorm on Vancouver Island,

Canada

J. N. Goetz1, R. H. Guthrie2, and A. Brenning1

1

University of Waterloo, Department of Geography and Environmental Management, Waterloo, Ontario, Canada

2

SNC-Lavalin, Geohazards and Geomorphology, Calgary, Alberta, Canada

Received: 7 August 2014 – Accepted: 18 August 2014 – Published: 27 August 2014

Correspondence to: J. N. Goetz (jgoetz@uwaterloo.ca)

(2)

NHESSD

2, 5525–5574, 2014

Extreme rainstorm on Vancouver Island,

Canada

J. N. Goetz et al.

Title Page

Abstract Introduction

Conclusions References

Tables Figures

◭ ◮

◭ ◮

Back Close

Full Screen / Esc

Printer-friendly Version Interactive Discussion

Discussion

P

a

per

|

Discus

sion

P

a

per

|

Discussion

P

a

per

|

Discussion

P

a

per

|

Abstract

Safe operations of forest practices in mountainous regions require effective develop-ment planning to mitigate hazards posed by landslides. British Columbia, Canada, has for the past two decades implemented landslide risk management policies aimed at reducing the impacts of the forest industry on landslides; it is required that timber

har-5

vesting sites are evaluated for their potential or existing impacts on terrain stability. Statistical landslide susceptibility modelling can enhance this evaluation by geograph-ically highlighting potential hazardous areas. In addition, these statistical models can also improve our understanding of regional landslide controlling factors. The purpose of this research was to explore the regional effects of forest harvesting activities,

topog-10

raphy, precipitation and geology on landslides initiated during an extreme rainfall event in November 2006 on Vancouver Island, British Columbia. These effects were anal-ysed with a nonparametric statistical method, the generalized additive model (GAM). Although topography was the strongest predictor of landslide initiation, low density for-est interpreted as regrowth areas and proximity to forfor-est service roads were jointly

15

associated with a six- to nine-fold increase in the odds of landslide initiation, while ac-counting for other environmental cofounders. This result highlights the importance of continuing proper landslide risk management to control the effects of forest practices on landslide initiation.

1 Introduction

20

Landslides triggered by heavy rainfall are a common occurrence on the Pacific coast of British Columbia, Canada. The shallow soils and heavy precipitation associated with the mountainous terrain of the Pacific Northwest coast create favourable preparatory conditions for frequent landslides (Schwab, 1983; Guthrie et al., 2010a). Additionally, commercial forest management practices, including timber harvesting and forest road

25

(3)

NHESSD

2, 5525–5574, 2014

Extreme rainstorm on Vancouver Island,

Canada

J. N. Goetz et al.

Title Page

Abstract Introduction

Conclusions References

Tables Figures

◭ ◮

◭ ◮

Back Close

Full Screen / Esc

Printer-friendly Version Interactive Discussion

Discussion

P

a

per

|

Discus

sion

P

a

per

|

Discussion

P

a

per

|

Discussion

P

a

per

|

areas (Jakob, 2000; Slaymaker, 2000; Guthrie, 2002). There is also general concern about possible increase in landslide activity in response to timber harvesting and de-forestation in different areas worldwide (Rickli and Graf, 2009; Turner et al., 2010; Imaizumi and Sidle, 2012; Muenchow et al., 2012).

As regulated by the provincial government of British Columbia, those involved in

tim-5

ber harvesting must ensure that “. . . the primary forest activity does not cause a land-slide that has a material adverse effect on forest resource values” (Wise et al., 2004). Furthermore, timber harvesters are required to provide a “terrain stability hazard map”: a map outlining potentially unstable terrain where landslides may occur. This type of map is often the result of a susceptibility model that predicts the likelihood of landslide

10

occurrence for any given location (Dai et al., 2002).

There are a variety of methods for landslide susceptibility modelling available (Guzzetti et al., 1999). Traditionally in British Columbia terrain mapping approaches have been applied that classify landslide susceptibility using quantitative methods based on the presence and density of landslides in a terrain unit, i.e. in categorized

15

units of terrain with similar slope, surficial material and slope morphology (Howes and Kenk, 1997; Rollerson et al., 2002; Chatwin, 2005; Guthrie, 2005; Schwab and Geertsma, 2010). Typically, the terrain units are represented as polygons. These terrain polygons are interpreted for stability and may over- or under-estimate actual probabili-ties, particularly where the interpretation is qualitative. For a large Pacific coast island,

20

such as Vancouver Island, more detailed approaches utilizing statistical methods to susceptibility modelling for individual cells of a raster dataset have also been explored (Chung et al., 2001; Goetz et al., 2011).

The application of statistically-based models for landslide susceptibility modelling is common practice (Chung and Fabbri, 1999; Brenning, 2005; Guzzetti et al., 2006;

Frat-25

(4)

NHESSD

2, 5525–5574, 2014

Extreme rainstorm on Vancouver Island,

Canada

J. N. Goetz et al.

Title Page

Abstract Introduction

Conclusions References

Tables Figures

◭ ◮

◭ ◮

Back Close

Full Screen / Esc

Printer-friendly Version Interactive Discussion

Discussion

P

a

per

|

Discus

sion

P

a

per

|

Discussion

P

a

per

|

Discussion

P

a

per

|

of a susceptibility model relies on the quality of the landslide inventory, the modelling method, and on the selection of variables representing preparatory conditions that are used to predict landslides (Demoulin and Chung, 2007).

An advantage to using a statistical model is one’s ability to learn more about the slide controlling processes by creating a model that describes the association of

land-5

slides with the preparatory conditions (Dai and Lee, 2002). The knowledge gained can be used to improve predictions wherein the set of preparatory conditions has a well-defined relationship to landslides (Hastie and Tibshirani, 1990; Demoulin and Chung, 2007). In general, models are used to form more effective forest management prac-tices aimed at reducing damages caused by landslides. They analyse the impacts of

10

human activity, such as forest cover conditions (related to timber harvesting) and forest roads, in relationship to other physical (e.g., precipitation) and geomorphological (e.g., topography) influences on landslide occurrence (Turner et al., 2010). Ideally, the rela-tionships between landslides and highly variable temporal and spatial conditions (e.g., precipitation and forest cover) should be investigated based on event-specific models.

15

In this study, we focus on an extreme weather event on the pacific coast of British Columbia that hit Vancouver Island in mid-November 2006. This storm brought high-intensity rainfall and extreme winds that resulted in over 600 landslides. These land-slides encompassed>5 km2and generated>1.5×10⁶m3of sediment (Guthrie et al.,

2010b). In addition to the landslide inventory used by Guthrie et al. (2010b), the

avail-20

ability of a high-resolution digital elevation model (DEM) for terrain analysis, cloud-free satellite imagery to capture forest conditions, and weather station data associated with the time period leading up and including this extreme weather event, has created an opportunity to explore the controls of rainfall-induced landslides on Vancouver Island using statistical models.

25

(5)

NHESSD

2, 5525–5574, 2014

Extreme rainstorm on Vancouver Island,

Canada

J. N. Goetz et al.

Title Page

Abstract Introduction

Conclusions References

Tables Figures

◭ ◮

◭ ◮

Back Close

Full Screen / Esc

Printer-friendly Version Interactive Discussion

Discussion

P

a

per

|

Discus

sion

P

a

per

|

Discussion

P

a

per

|

Discussion

P

a

per

|

statistical techniques for modelling landslide susceptibility to provide insights into land-slide initiation patterns on a regional scale.

2 Methods

2.1 Study area

Vancouver Island (31 788 km2) is located off the west coast of mainland British

5

Columbia (BC), Canada (Fig. 1). The mountainous terrain, referred to as the Vancou-ver Island Ranges, is a sub-range of the Insular Mountains that runs along the Pacific Coast and includes the Queen Charlotte Mountains to the north. The island landscape has 2200 m of relief and has been heavily modified during the Pleistocene glaciation, with over-steepened U-shaped valleys, deep coastal fjords and ample post-glacial

sed-10

iment supply.

The pattern of precipitation is typical of west coast mountain ranges in a temperate climate. The mean annual precipitation ranges from 800–1200 mm along the east coast (mountain shadow) sides, and increases towards the west coast (windward side) to more than 3000 mm (McKenney et al., 2006). Precipitation is most abundant from early

15

autumn to midwinter.

The mountain ranges of Vancouver Island contribute to various climate conditions that affect the distribution of tree species (Meidinger and Pojar, 1991). The most com-mon tree species is the western hemlock (Tsuga heterophylla), which is predominantly located from sea level to 1050 m a.s.l. Red alder (Alnus rubra), which is known as a

pi-20

oneer species, is found in areas that have been recently been disturbed (e.g. timber harvesting; Meidinger and Pojar, 1991). Mountain hemlock (Tsuga mertensiana), ama-bilis fir (Abies amabilis) and yellow cedar (Chamaecyparis nootkatensis) are common at higher elevations from 900 to 1800 m a.s.l. The tree line associated with the high mountain peaks of the Insular Mountains is located at 1650 m a.s.l. Western and

moun-25

(6)

NHESSD

2, 5525–5574, 2014

Extreme rainstorm on Vancouver Island,

Canada

J. N. Goetz et al.

Title Page

Abstract Introduction

Conclusions References

Tables Figures

◭ ◮

◭ ◮

Back Close

Full Screen / Esc

Printer-friendly Version Interactive Discussion

Discussion

P

a

per

|

Discus

sion

P

a

per

|

Discussion

P

a

per

|

Discussion

P

a

per

|

windthrow. Uprooting is common where there is an impermeable layer in the soil or a high water table that causes trees to be shallow rooted (Ruth, 1964). Windthrow has been observed to contribute to landslide initiation in the Pacific Northwest (Johnson et al., 2000).

In addition to being located throughout most of Vancouver Island, Douglas-fir (

Pseu-5

dotsuga menziesii) is also predominantly located in relatively small segments of the rain-shadow on the southeast coast (<150 m a.s.l.). This low elevation area has expe-rienced heavy timber harvesting during the early 20th century, with old growth forests only remaining in parks (Meidinger and Pojar, 1991). Highly productive forestland has been logged since the early 20th century using various techniques. Landslide

initia-10

tion has increased as a result (Rollerson, 1992; Rollerson et al., 1998; Jakob, 2000; Guthrie, 2002, 2005; Guthrie and Evans, 2004; Chatwin; 2005; Pike et al., 2010), but precise estimates of the amount of increase on a landscape scales are still lacking.

Debris flows and debris slides are the most common type of landslides occurring on Vancouver Island. The debris slides, which are usually shallow, typically occur in till,

15

colluvium and fluvial deposited sediments (Pike et al., 2010). Debris flows are predom-inantly triggered by an initial failure of a debris slide, which can occur on a channel sidewall or headwall (Brayshaw and Hassan, 2009). Also, flow initiation is much more likely to occur in steep channels than low gradients channels (Brayshaw and Hassan, 2009). The most common triggering mechanisms for these landslides are heavy

precip-20

itation and rapid snowmelt. Seismic activity also causes landslides in the area (Rogers, 1980; VanDine and Evans, 1992).

2.2 Landslide inventory

The British Columbia Ministry of Environment mapped the landslide inventory of 638 debris flows and debris slides for the winter of 2006–2007 (Fig. 1). These landslides

25

were mapped from 5 m×5 m resolution SPOT satellite imagery using an automated

(7)

NHESSD

2, 5525–5574, 2014

Extreme rainstorm on Vancouver Island,

Canada

J. N. Goetz et al.

Title Page

Abstract Introduction

Conclusions References

Tables Figures

◭ ◮

◭ ◮

Back Close

Full Screen / Esc

Printer-friendly Version Interactive Discussion

Discussion

P

a

per

|

Discus

sion

P

a

per

|

Discussion

P

a

per

|

Discussion

P

a

per

|

(Guthrie et al., 2010b). While the mapped landslides could have occurred anywhere between these dates, it is believed that that vast majority occurred during the Novem-ber 2006 extreme rainstorm (Guthrie et al., 2010b).

Initiation points digitized from the mapped landslide polygons were used for the sub-sequent analysis (Fig. 2). The location of the initiation point was manually digitized

5

where the main scarp may be expected. These initiation points were used to approx-imate the environmental conditions that led to slope failure. The polygons were used to estimate the landslide area. Non-landslide points, which are required for the sta-tistical analysis, were determined by spatial random sampling from the entire study area, excluding the landslide polygons. Overall, 638 observed landslide points and 638

10

non-landslide points, a 1 : 1 sampling ratio, was used to conduct this study.

2.3 Geostatistically interpolating precipitation

The saturation of forest soils from antecedent precipitation has been identified as an important variable for the prediction of landslide initiation (Crozier, 1999; Jakob and Weatherly, 2003). The relationship of precipitation to the landslide inventory was

there-15

fore analysed using the antecedent precipitation leading up to and including the ex-treme storm on 15 November 2006 (Environment Canada, 2013), which is assumed to have triggered most of the landslides in the inventory (Guthrie et al., 2010). The two-week period before the storm was included in this analysis (2–15 November 2006) to account for antecedent conditions that contributed to soil saturation, which led to the

20

triggering of landslides.

The weather station data was compiled from a variety of Canadian government sources: Environment Canada (36 stations), British Columbia (BC) Ministry of Trans-portation (3 stations), and BC Ministry of Forests, Lands and Natural Resources Oper-ations (12 stOper-ations). Altogether, 51 stOper-ations ranging in elevation from 0 m to 580 m a.s.l.

25

(8)

NHESSD

2, 5525–5574, 2014

Extreme rainstorm on Vancouver Island,

Canada

J. N. Goetz et al.

Title Page

Abstract Introduction

Conclusions References

Tables Figures

◭ ◮

◭ ◮

Back Close

Full Screen / Esc

Printer-friendly Version Interactive Discussion

Discussion

P

a

per

|

Discus

sion

P

a

per

|

Discussion

P

a

per

|

Discussion

P

a

per

|

our analysis because the majority of our weather station data, which came from Envi-ronment Canada, did not have hourly measurements.

On Vancouver Island, the precipitation patterns are strongly dependent on the moun-tainous topography (Fig. 3). Therefore, we applied universal kriging (UK) to geostatis-tically interpolate precipitation based on a spatial linear model that accounts for a

re-5

lationship to elevation (Goovaerts, 1997). The association between elevation and pre-cipitation is generally dependent on the spatial scale (Daly et al., 2008). In general, an up-scaled elevation model can better capture the effects of air movements through topographic obstacles (Daly et al., 1994; Funk and Michaelsen, 2004; Sharples et al., 2005). Therefore, the spatial scale for precipitation interpolation in this study followed

10

the methods used by Daly et al. (2008), which utilized an up-scaled 800 m×800 m

resolution DEM.

The performance of the precipitation interpolation was assessed with leave-one-out cross-validation that estimated the root-mean-square error (RMSE) and mean bias (Goovaerts, 2000).

15

2.4 Representing forest harvesting activities

Forest cover was mapped by applying a supervised maximum likelihood classifier (MLC) of Landsat TM scenes from the summer of 2006 reflecting pre-landslide con-ditions (Swain and Davis, 1978). The MLC was applied to image data obtained by a Tasseled Cap transformation (Crist et al., 1986). The training data was comprised

20

of 100 (visually interpreted) observations per each desired class. The Landsat scenes were first classified and then mosaicked to cover Vancouver Island. An additional ran-dom sample of 100 points across all the classified areas was taken as test data to estimate the classification accuracy. The Landsat data was obtained from the United States Geological Survey (USGS) Global Visualization Viewer (USGS, 2011).

25

(9)

NHESSD

2, 5525–5574, 2014

Extreme rainstorm on Vancouver Island,

Canada

J. N. Goetz et al.

Title Page

Abstract Introduction

Conclusions References

Tables Figures

◭ ◮

◭ ◮

Back Close

Full Screen / Esc

Printer-friendly Version Interactive Discussion

Discussion

P

a

per

|

Discus

sion

P

a

per

|

Discussion

P

a

per

|

Discussion

P

a

per

|

specific enough to only represent “logging forests”. However, the general characteris-tics of these forest types can be used to relate to forestry practices and investigate the relationships to landslide initiation (Table 1). We based our classification of forest cover on the work of Cohen et al. (1995), who classified different forest stand structures in similar Pacific-coast temperate-forest conditions from Landsat TM data.

5

The classification of forest cover was characterized by comparing the resulting map to BC government forest inventory data. The relative stand density was estimated by crown (canopy) closure values obtained from the vegetation resources inventory (VRI): a geographic dataset that represents forest-sampling units with polygons (British Columbia Government, 2013a). The VRI represents numerous projected forest

condi-10

tions, e.g. stand age, crown closure, dominant forest species and etc. for 2013. We attempted to represent conditions associated with the year of our study (2006) by in-cluding only crown closure estimates in the analysis that had a corresponding projected stand age greater than 6 years.

A BC forestry cutblock inventory (British Columbia Government, 2013b) was also

15

compared to our forest classes to gain a sense of how well the classification repre-sents forest-harvesting activities. This inventory consists of digitized cutblock polygons across Vancouver Island for harvesting years up to 2013. The cutblock polygons have a corresponding “end of disturbance date” that was used to approximate the recovery period, in years, associated with our forest cover classes. This value was calculated

20

by subtracting the year corresponding to the “end of disturbance date” to the year our landslides occurred, 2006. Consequently, cutblocks harvested after 2006 were not in-cluded in the recovery period calculation. The proportion of samples that were located within the cutblock polygons was calculated to highlight the relative association of each forest cover class to forestry activities. Higher proportions indicate a closer association

25

to the forest cutblocks.

(10)

NHESSD

2, 5525–5574, 2014

Extreme rainstorm on Vancouver Island,

Canada

J. N. Goetz et al.

Title Page

Abstract Introduction

Conclusions References

Tables Figures

◭ ◮

◭ ◮

Back Close

Full Screen / Esc

Printer-friendly Version Interactive Discussion

Discussion

P

a

per

|

Discus

sion

P

a

per

|

Discussion

P

a

per

|

Discussion

P

a

per

|

only be conducted where the datasets overlapped with the landslide sample. Also, due to the lack of completeness and unknown quality of these government inventories, the comparisons to the forest classification only serve to assess the potential of the forest cover classes as a proxy for recovery stage, and were not considered for use as predictors for statistical modelling.

5

The Euclidean distance from forest service roads was calculated to explore the rela-tionship to landslide initiation in the statistical analysis. Only distances from roads up to 100 m were considered to have a potential influence on landslides, and consequently the distance variable was trimmed by assigning a value of 100 m to all distance ob-servations>100 m. Forest road data were obtained from the British Columbia Digital

10

Road Atlas (BCDRA), which was last updated in 2007 (British Columbia Government, 2007). Through visual inspection, it was determined that the service roads utilized for forest harvesting (forest roads) were best identified based on road surface attributes for “loose” and “rough” surfaces in the BCDRA data set. It was important to differentiate the road surface type because paved and unpaved roads have different construction

15

standards.

2.5 Geology and terrain analysis

The geologic conditions were represented with generalized formations of rock type, which included igneous (intrusive and volcanic), metamorphic and sedimentary rock. The steep slopes of the Insular Mountains are supported by mainly coarse-grained

in-20

trusive rock made of durable minerals (quartz, feldspars) that are relatively resistant to weathering, but are subject to mechanical breakdown (Pike et al., 2010). The finer-grained volcanic rocks (e.g. basalts) are highly susceptible to mechanical and chemical weathering. Landslides can occur in volcanic sequences made up of severely weath-ered rock material or clay residues (Pike et al., 2010). Landslides on Vancouver Island

25

(11)

NHESSD

2, 5525–5574, 2014

Extreme rainstorm on Vancouver Island,

Canada

J. N. Goetz et al.

Title Page

Abstract Introduction

Conclusions References

Tables Figures

◭ ◮

◭ ◮

Back Close

Full Screen / Esc

Printer-friendly Version Interactive Discussion

Discussion

P

a

per

|

Discus

sion

P

a

per

|

Discussion

P

a

per

|

Discussion

P

a

per

|

numbers of landslides on the island have been associated with silt and clay sedimen-tary complexes (Rollerson et al., 2002).

Slope angle, elevation, plan curvature, profile curvature, and upslope contributing area were used to represent topographic conditions related to landslide occurrence. These conditions were derived from a 0.75′′×0.75′′(∼20 m×20 m) resolution Canadian

5

Digital Elevation Data (CDED; Canadian Government, 2000) DEM using the standard terrain analysis module implemented in the open-source SAGA GIS (Conrad, 2006).

All of the analysis was performed at a 20 m×20 m resolution to be consistent with

resolution of the DEM that the topographic predictors are derived from. Generally in landslide susceptibility modelling the mapping unit, e.g. pixel size, is based on the

10

DEM resolution (Ayalew and Yamagishi, 2005; Schicker and Moon, 2012). The classi-fied forest cover was resampled down from 30 m×30 m using the nearest neighbour

method. Proximity to forest service roads was calculated at the 20 m pixel size, and the remaining predictors representing geology and precipitation were also resampled to this resolution in spite of their stronger spatial generalization.

15

2.6 Statistical modelling of landslide susceptibility

The statistical relationship of the potential preparatory conditions to landslide initia-tion was modelled with the generalized additive model (GAM) with multiple predictor variables. The GAM is a semiparametric extension of generalized linear models, such as logistic regression, that has the flexibility to represent the response’s dependence

20

on a predictor variable as either linear or nonlinear (Hastie and Tibshirani, 1990). The advantage of this method over logistic regression is the ability to represent nonlinear ef-fects that are known to exist in many geomorphological analyses (Phillips, 2003; Bren-ning et al., 2007; Goetz et al., 2011; Muenchow et al., 2012). These supposed nonlinear effects can be modelled with smoothing functions that fit the data without rigid

assump-25

(12)

NHESSD

2, 5525–5574, 2014

Extreme rainstorm on Vancouver Island,

Canada

J. N. Goetz et al.

Title Page

Abstract Introduction

Conclusions References

Tables Figures

◭ ◮

◭ ◮

Back Close

Full Screen / Esc

Printer-friendly Version Interactive Discussion

Discussion

P

a

per

|

Discus

sion

P

a

per

|

Discussion

P

a

per

|

Discussion

P

a

per

|

estimated with penalized thin plate regression splines with the smoothing parameters selected by generalized cross-validation (Wood, 2006). The flexibility of the smoothers was controlled with up to 3 effective degrees of freedom to allow for general modelling of nonlinear terms while also avoiding the potential to overfit.

A binomial GAM can provide a straightforward interpretation of the odds of an event

5

occurring – in our case, a landslide – conditional on different preparatory conditions. The odds of an event that occurs with probabilityp isp/(1−p). Odds ratios can be

used as a measure of effect size, i.e. the strength of a predictor. The odds ratio is defined as the odds of an event occurring in one type of condition (e.g., open forest cover) divided by the odds of an event occurring in a different type of condition (e.g.,

10

closed forest cover). In this study, we utilize the GAM to assess the effect size of the predictor variables while accounting for possible nonlinear relationships.

The association of possible preparatory conditions with landslide initiation was mod-elled with predictor variables for topography (5 variables), rock type (1 with 4 classes), forest conditions (1 with 4 classes) and antecedent precipitation accumulation (1). In

15

addition, the interaction between forest cover and precipitation accumulation was ex-plored with a separate model that also included all the other predictor variables and a linear representation of the corresponding interaction term. We included topography, rock type and precipitation accumulation in our models to account for the differences in slope mechanics and hydrology, while focussing on the association with forest

harvest-20

ing activities using forest cover and proximity to forest service roads. Odds ratios were estimated from the GAM to assess the empirical effect of these predictor variables on landslide initiation. In general, the effect of a variable was considered strong if the odds ratio was greater than 2, which is equivalent to a two-fold increase of the odds of an event occurring.

25

(13)

NHESSD

2, 5525–5574, 2014

Extreme rainstorm on Vancouver Island,

Canada

J. N. Goetz et al.

Title Page

Abstract Introduction

Conclusions References

Tables Figures

◭ ◮

◭ ◮

Back Close

Full Screen / Esc

Printer-friendly Version Interactive Discussion

Discussion

P

a

per

|

Discus

sion

P

a

per

|

Discussion

P

a

per

|

Discussion

P

a

per

|

independent resamples (with replacement) from the available dataset. Following Bren-ning et al. (2012), spatial dependencies were accounted for by resampling disjoint sub-regions or “blocks” that were obtained bym-means clustering (m=100) of the sample (landslide and non-landslide) coordinates. The bootstrap resampling of m out of m blocks was repeated 1000 times, and odds ratios were obtained from a GAM fitted

5

to each bootstrap dataset. The bootstrap results were summarized by the mean and percentile-based 95 % confidence intervals for the odds ratios.

Although predictive modelling was not the main objective of this study, we assess performance by spatial cross-validation estimation to illustrate the general quality of the susceptibility models (Brenning, 2012). This method randomly partitions the

sam-10

ples intokdisjoint spatial subsets usingk-means clustering, trains a model onk−1 of

these subsets, estimates its performance on the remaining subset, and repeats thisk times until each subset has been used once as a test set. Since the result is dependent on the particular partitioning used, this step is repeated with different random partitions. In this study, a 5-fold spatial cross-validation was repeated 20 times. In each repetition

15

the area under the receiver operating characteristic curve (AUROC; Zweig and Camp-bell, 1993) and the sensitivity of each model at a specificity of 90 % were estimated; a specificity of 90 % means that (only) 10 % of the non-landslide area is misclassified as susceptible to landslides, creating false-positive predictions. The estimation of sen-sitivity at this high specificity assesses the ability of a model to spatially predict areas

20

that are highly susceptible to landslide initiation (Brenning, 2012). The differences in model performance estimates were tested using unpairedt tests.

In addition to the statistical modelling, an analysis was conducted to characterize the landslides associated with different forest conditions and the remaining predictors. The density (number of landslides per km2) was calculated for landslides initiated within

25

(14)

NHESSD

2, 5525–5574, 2014

Extreme rainstorm on Vancouver Island,

Canada

J. N. Goetz et al.

Title Page

Abstract Introduction

Conclusions References

Tables Figures

◭ ◮

◭ ◮

Back Close

Full Screen / Esc

Printer-friendly Version Interactive Discussion

Discussion

P

a

per

|

Discus

sion

P

a

per

|

Discussion

P

a

per

|

Discussion

P

a

per

|

for landslide and non-landslide observations. This univariate analysis was simply ex-ploratory and does not account for other preparatory factors as confounders.

All analyses were performed in the open-source statistical software R (R Develop-ment Core Team, 2011) using the following packages for spatial data handling, sta-tistical modelling and error estimation: mgcv (Wood, 2006), raster (Hijmans and van

5

Etten, 2012), ROCR (Sing et al., 2005), RSAGA (Brenning, 2008), sperrorest (Bren-ning, 2012).

3 Results

3.1 Precipitation distribution

Two-week antecedent precipitation was generally higher in the southwest portions of

10

the island and in the Insular Mountains. Precipitation strongly correlated with elevation values from the smoothed DEM with Pearson’s correlation coefficient of 0.67 which implies that almost one-half of the variation in precipitation was accounted for by eleva-tion. The residual semivariogram of precipitation after accounting for elevation showed a distance of spatial autocorrelation of ∼90 km and almost no nugget effect, or

sub-15

scale variation (Fig. 4). Universal kriging predictions consequently combine the over-all elevation-related precipitation pattern with local interpolation adjustments in closer proximity to weather stations. The uncertainty of the predicted precipitation values was highest at high elevations and for areas of the island that had a low density of weather stations, which was generally in the north (Fig. 5b). Leave-one-out estimation gave an

20

(15)

NHESSD

2, 5525–5574, 2014

Extreme rainstorm on Vancouver Island,

Canada

J. N. Goetz et al.

Title Page

Abstract Introduction

Conclusions References

Tables Figures

◭ ◮

◭ ◮

Back Close

Full Screen / Esc

Printer-friendly Version Interactive Discussion

Discussion

P

a

per

|

Discus

sion

P

a

per

|

Discussion

P

a

per

|

Discussion

P

a

per

|

3.2 Forest cover

The overall accuracy of the forest cover classification was 82 % (±7 % with 95 %

con-fidence). The open and closed forest classes had the most confusion between the reference data and the classification prediction (Table 2). The “masked” class in Ta-ble 2 refers to areas of the Landsat scenes that were covered by snow or clouds. This

5

class was not included in the statistical analysis.

Overall, the forest conditions of 13 998 km2 on Vancouver Island were classified (Fig. 6). The majority (59 %) of the study area was classified as closed forest, followed by semi-open forest (20 %), open forest (15 %) and sparse forest (6 %).

The proportion of samples that were located within the forest cutblocks was highest

10

for sparse (33 %) and open forest (31 %), followed by semi-open (16 %) and closed forest (9 %), which indicates that sparse and open forest cover classes had a stronger association to forest cutblocks than the other classes (Table 3; Figs. 6c and 7). Addition-ally, the recovery period estimates for samples that were within the cutblock polygons were lowest for the sparse (2 years) and open forest (11 years) classes (Table 3; Fig. 7).

15

This result reinforces that the sparse and open forest cover types were more associated to relatively recent forest harvesting disturbances than the other classes. The sparse and open forest cover classes were also associated with the lowest crown closure es-timates, 20 % and 45 % respectively (Table 3; Figs. 6d and 7). The median estimate of crown closure was the same (55 %) for semi-open and closed forest. However, this may

20

be expected because these classes had the greatest classification confusion (Table 2).

3.3 Landslide characteristics

Closed forest, which covers a majority of the island, had the largest number of initi-ated landslides (46 %), followed by open forest (26 %), semi-open forest (23 %) and sparse forest (5 %). Although closed forest had the largest total area affected by

land-25

(16)

NHESSD

2, 5525–5574, 2014

Extreme rainstorm on Vancouver Island,

Canada

J. N. Goetz et al.

Title Page

Abstract Introduction

Conclusions References

Tables Figures

◭ ◮

◭ ◮

Back Close

Full Screen / Esc

Printer-friendly Version Interactive Discussion

Discussion

P

a

per

|

Discus

sion

P

a

per

|

Discussion

P

a

per

|

Discussion

P

a

per

|

Table 4; Fig. 8). The smallest landslide area distribution was associated semi-open forest (2981 m2). The size distributions of landslide area was very similar for closed (4734 m2) and open forest (4457 m2).

According to the univariate analysis, the landslide density in open forest conditions (0.079 landsl. km−2) was 2.3 times as great as the density in closed forest

condi-5

tions (0.035 landsl. km−2; Table 4). This was the largest difference between of land-slide density amongst the forest conditions. Semi-open forest had a landland-slide den-sity (0.052 landsl. km−2) that was almost equal to the average density found for open and closed forest. If we generalize fully regrown forest conditions as closed forest and logged conditions as the remaining classes (sparse, open, and semi-open), the

land-10

slide density was 70 % greater in areas that have had logging than natural forest. The landslide density in areas adjacent to forest roads (<20 m) was 30.5 times as high as the general density of landslides for the entire study area. However, topographic and other environmental confounders need to be accounted for in order to confirm the results of this exploratory analysis.

15

3.4 Modelled landslide initiation

3.4.1 Effect size: odds ratios

Landslide initiation was more likely in close proximity to forest service roads than fur-ther away when accounting for confounding variables in the GAM. The estimated odds ratio of landslide initiation at 10 m from the road was 2.1 times as high as at distances

20

of 50 m, all other predictors being accounted for (Fig. 9; Table 6). Thus, while consid-ering influences of topography, forest cover, rock type and precipitation, it appears the classified “forest service roads” were associated with increased landslide initiation up to 50 m from the road (Fig. 9).

While investigating the effects of forest cover on landslide initiation, we found only

25

(17)

NHESSD

2, 5525–5574, 2014

Extreme rainstorm on Vancouver Island,

Canada

J. N. Goetz et al.

Title Page

Abstract Introduction

Conclusions References

Tables Figures

◭ ◮

◭ ◮

Back Close

Full Screen / Esc

Printer-friendly Version Interactive Discussion

Discussion

P

a

per

|

Discus

sion

P

a

per

|

Discussion

P

a

per

|

Discussion

P

a

per

|

initiation compared to closed forest cover was estimated to be as high as 2.2 times in open forest, 1.1 times in sparse forest and 1.9 times in semi-open forest, when ac-counting for the other predictors in the model.

The linear effect of antecedent precipitation accumulation was weak in the model without an interaction term for forest type and precipitation. The estimated odds of

land-5

slide initiation at 1500 mm were only 1.3 times as high as the odds at 500 mm, all other predictors being accounted for. However, the model containing a forest-precipitation interaction term revealed substantial differences in the empirical effect of forest type for areas with different antecedent precipitation amounts; conversely, the effect of precip-itation depended strongly on forest cover (Fig. 10). While the estimated odds of

land-10

slide initiation increased with antecedent precipitation in semi-open and open forest, they were nearly constant in closed forest and decreased with increasing precipitation in sparse forest, while accounting for the effects of topography and rock type. At low (500 mm) antecedent precipitation accumulation, the estimated odds of landslide initi-ation in sparse forest were 5.4 times as high as closed forest cover. In contrast, at high

15

(1500 mm) antecedent precipitation accumulation, landslides were much more likely to be initiated in open or semi-open forest compared to closed forest (estimated odds ratios of 4.7 for open forest and 3.1 for open forest; Table 6). Thus, overall, semi-open, open and closed forest cover exhibited similar chances of landslide initiation at low antecedent precipitation levels, while semi-open and open forest types showed

20

substantially greater landslide activity at higher-than average precipitation levels, while accounting for the influence of topography and rock type.

The association with rock type was generally weak. Landslide initiation was more likely in metamorphic rock compared to volcanic rock, when accounting for the other predictors (estimated odds ratios of 1.9 for metamorphic rock, 1.5 for sedimentary and

25

1.1 for intrusive, each relative to volcanic rock).

(18)

NHESSD

2, 5525–5574, 2014

Extreme rainstorm on Vancouver Island,

Canada

J. N. Goetz et al.

Title Page

Abstract Introduction

Conclusions References

Tables Figures

◭ ◮

◭ ◮

Back Close

Full Screen / Esc

Printer-friendly Version Interactive Discussion

Discussion

P

a

per

|

Discus

sion

P

a

per

|

Discussion

P

a

per

|

Discussion

P

a

per

|

40◦. The estimated odds of initiation were 35.5 times as high as at a 50slope angle than at 10◦. Large upslope contributing areas also had a strong effect on landslide susceptibility (Fig. 9). The estimated odds of initiation were 7.7 times as high as slopes with an upslope contributing area size of 100 000 m2than at an area of 1000 m2.

The likelihood of initiation was substantially as high as where plan curvature, a proxy

5

for subsurface flow conditions, was convergent (Fig. 9). The estimated odds were 4.4 times as high as for convergent plan curvatures (−0.015 rad. per 20 m) than

lin-ear (no curvature; 0) surfaces. The odds of initiation at divergent surfaces (0.015 rad. per 20 m) were almost unchanged with an estimated odds ratio of 1.3 compared to linear surfaces. Landslide initiation was also more likely to occur on concave

10

(0.015 rad. (20 m)−1) than convex (−0.015) plan curvatures, which is used to

charac-terize the subsurface acceleration and deceleration of flow down a slope. The odds of initiation on concave slopes were 2.5 times as high as convex slopes.

A nonlinear effect of elevation was also noticeable above 800 m a.s.l., when account-ing for the other predictors (Fig. 9). For example, while the estimated odds of landslide

15

initiation at 300 m was only 1.4 as high as at 800 m, at 800 m a.s.l. they were 1.94 times as high as 1100 m a.s.l. and 8.53 times as high as 1600 m a.s.l.

Overall, the GAMs provided a robust estimate of the effect sizes, which was indicated by the similarity of the odds ratios for the study area sample compared to the bootstrap resamples (Table 6), and the relatively small bootstrap estimated confidence limits.

20

3.4.2 Model performance and mapping

The predictive performances of the models in this study were very good, achieving sim-ilar cross-validation AUROC values of 0.86 (Table 7). Sensitivity at 90 % specificity was 54 % in cross-validation, indicating that the models were able to concentrate around one-half of the landslide incidences in the most susceptible∼10 % of the area.

Includ-25

(19)

NHESSD

2, 5525–5574, 2014

Extreme rainstorm on Vancouver Island,

Canada

J. N. Goetz et al.

Title Page

Abstract Introduction

Conclusions References

Tables Figures

◭ ◮

◭ ◮

Back Close

Full Screen / Esc

Printer-friendly Version Interactive Discussion

Discussion

P

a

per

|

Discus

sion

P

a

per

|

Discussion

P

a

per

|

Discussion

P

a

per

|

A map of the model prediction outputs has been provided to visualize the modelling effects (Fig. 11). Consistently with the model interpretation, steep slopes, gullies and close proximity to forest roads are slope-scale features that stand out as having rela-tively high susceptibility to landslide initiation.

4 Discussion

5

4.1 The effects forest cover and service roads on landslide initiation

In this study we explored the regional-scale empirical effects of forest harvesting relat-ing activities on landslide initiation. The combined effect of open or semi-open forest cover, interpreted as regrowth areas, and proximity to forest roads was substantial with a 3–4 times increase in the odds of initiation compared to closed forest conditions and

10

distances greater than 50 m from forest service roads, without considering the inter-action between precipitation accumulation and forest cover. When this interinter-action is accounted for, this combined effect was estimated to increase the odds of initiation by 6–9 times at high precipitation accumulation (1500 mm). Considering that open and semi-open forest types in this landscape can in general be interpreted as stages of

15

forest regrowth after timber harvesting, this result clearly illustrates that forest harvest-ing related conditions were associated with an elevated likelihood of landslide initiation during the November 2006 storm.

Modelled landslides in the classified open forest type were found to be twice as a high as the odds of initiation in closed forest. These findings are similar to May (2003),

20

Guthrie (2002) and Turner et al. (2010) where mature forest had the lowest landslide densities. Although this study did not explore detailed causal mechanisms of landslide initiation, differences in forest cover are associated with different soil hydrological and mechanical conditions (Sidle, 1992) that may be responsible for the lower likelihood of initiation in closed forest cover.

(20)

NHESSD

2, 5525–5574, 2014

Extreme rainstorm on Vancouver Island,

Canada

J. N. Goetz et al.

Title Page

Abstract Introduction

Conclusions References

Tables Figures

◭ ◮

◭ ◮

Back Close

Full Screen / Esc

Printer-friendly Version Interactive Discussion

Discussion

P

a

per

|

Discus

sion

P

a

per

|

Discussion

P

a

per

|

Discussion

P

a

per

|

In particular, forest canopies may increase stability by reducing the intensity of pre-cipitation reaching the surface (Keim and Skaugset, 2003). Interception has been found to capture 30–50 % of annual precipitation in dense forest canopies (Dingman, 1994). Also, evapotranspiration in temperate climates is typically higher for closed forest with observed rates that are 5–10 times higher than in exposed soil (Jones, 1997).

Defor-5

estation can lead to reduced evapotranspiration; an increase of the amount and inten-sity precipitation reaching the soil; and as a result, a reduction in the time it takes for the groundwater table to rise, which can lead to slope failure (Johnson et al., 2000). While the protective effect of vegetation may be less pronounced during long-lasting high-intensity precipitation events as observed in this study, we suggest that these effects

10

contribute to both the overall empirical effect of forest cover type and the interaction of forest cover with precipitation in this study.

It was also found that the open forest conditions, representative of young forest, were relatively more susceptible to landslide initiation than sparse forest, representative of recently disturbed forest. This result may empirically support previous findings that

15

there is a lag period between logging activities and increased proneness to landslides (Swanston and Swanson, 1976; Wu and Mckinnel, 1979; Sidle et al., 2006). Forest harvesting can increase the frequency of landslides during heavy rainfall, with younger forests having more landslides triggered by rainfall events with relatively lower return periods than more developed forests (Imaizumi and Sidle, 2012). A possible

explana-20

tion for the mechanism involved in this lag period is the deterioration of tree roots, which can increase susceptibility of landslide initiation during high intensity rainfall events (Si-dle, 1992). Although some of the landslides initiated in sparse forest may also be re-lated to timber harvesting activities, other forest disturbances such as avalanche paths may also play a role in these areas (Guthrie et al., 2002).

25

(21)

NHESSD

2, 5525–5574, 2014

Extreme rainstorm on Vancouver Island,

Canada

J. N. Goetz et al.

Title Page

Abstract Introduction

Conclusions References

Tables Figures

◭ ◮

◭ ◮

Back Close

Full Screen / Esc

Printer-friendly Version Interactive Discussion

Discussion

P

a

per

|

Discus

sion

P

a

per

|

Discussion

P

a

per

|

Discussion

P

a

per

|

effect of forest roads on landslides, generalized across Vancouver Island, is up to 50 m from the road. This distance is relatively short compared to the findings of Larsen and Parks (1997) in humid tropical mountains of Puerto Rico, and Brenning et al. (2014) in humid Andes of southern Ecuador, who observed the effects of highways on landslides up to 100 m and 150 m respectively. An earlier study conducted in the Oregon Coast

5

Ranges, also located in the Pacific Northwest, found most of the road-related landslides initiated during severe winter storms occurred in fill material (Mills, 1997). We believe that this may also be true for road-related landslides on Vancouver Island, and would support why we observed the relatively short-distance effect on landslides. In another Coastal Western Hemlock area in the Pacific Northwest of BC, it was observed that

10

most road fill landslides were likely due to loss of strength in foundation soils of older roads built before the 1990s (VanBuskirk et al., 2005). Failure on newer roads built after 1995 were usually associated to inadequate road drainage (VanBuskirk et al., 2005). Broadly speaking, out of all of the factors related to landslide initiation explored in this study, the influence of roads is the most controllable from a forestry practice

perspec-15

tive. Adequate management aimed at improving construction and regular maintenance of road drainage structures is critical to mitigate the influence of forest service roads on landslide occurrence (Slaymaker, 2000; Wemple et al., 2001; VanBuskirk et al., 2005).

4.2 Accounting for the effects of possible confounders

We based this analysis on a statistical approach, using the GAM to account for possible

20

confounders (topography, rock type, and antecedent precipitation) and potential non-linear relationships. In general, the topographic predictors (slope, elevation, curvatures and upslope contributing area) were strong at accounting for the spatial variation in this analysis of regional landslide initiation. As usual, slope was an outstanding predictor.

Slope angle is a well established spatial predictor of landslides that is essential for

25

(22)

NHESSD

2, 5525–5574, 2014

Extreme rainstorm on Vancouver Island,

Canada

J. N. Goetz et al.

Title Page

Abstract Introduction

Conclusions References

Tables Figures

◭ ◮

◭ ◮

Back Close

Full Screen / Esc

Printer-friendly Version Interactive Discussion

Discussion

P

a

per

|

Discus

sion

P

a

per

|

Discussion

P

a

per

|

Discussion

P

a

per

|

2001; Goetz et al., 2011). The modelling also illustrates the regional importance of topographic curvature for landslide initiation. Chances of landslide occurrence were higher for convergent and concave curvatures. Their combined effect resulted in a 10-fold increase in the odd of landslide initiation. These hillslope depressions can be gen-erally described as geomorphic hollows, which have been associated with repeated

5

landslide occurrence in steep terrain (Sidle and Ochiai, 2006). Johnson et al. (2000) also observed in similar study area conditions, just north of Vancouver Island on Prince of Whale Island, that these hillslope depressions have a higher tendency to slope fail-ure.

Several mechanisms may be responsible for linking elevation and landslide initiation

10

in this study. Elevation was used as a surrogate for climatic differences and the asso-ciated biogeographic characteristics, such as tree species distribution. We observed that the likelihood of initiation gradually decreased in the subalpine and alpine regions (>800 m a.s.l.). This climate region has soils that are generally saturated throughout the year with most of the precipitation (20–70 %) falling as snow (Medinger and Pojar,

15

1991). We conjecture that the reduced likelihood of landslide initiation may be attributed to the presence of a snowpack developed before the 15 November storm. Snowfall is usually the dominant form of precipitation over 800 m a.s.l on Vancouver Island (Gutrhie et al., 2010b). However, the role of snowpack and snowmelt on landslide occurrence is not very well known; a better understanding of this relationship may help to improve

20

prediction of landslides (Guthrie et al., 2010b).

A previous study on Vancouver Island by Guthrie and Evans (2004a) found that landslides were 1–4 times more likely to occur in metamorphic complexes containing schists and amphibolites. However, they acknowledged that it was difficult to know the role logging activities had on landslide distribution. In our study, these affects and

oth-25

(23)

NHESSD

2, 5525–5574, 2014

Extreme rainstorm on Vancouver Island,

Canada

J. N. Goetz et al.

Title Page

Abstract Introduction

Conclusions References

Tables Figures

◭ ◮

◭ ◮

Back Close

Full Screen / Esc

Printer-friendly Version Interactive Discussion

Discussion

P

a

per

|

Discus

sion

P

a

per

|

Discussion

P

a

per

|

Discussion

P

a

per

|

on the island. Guthrie and Evans (2004a) suggest that the degree of metamorphism associated with complexes containing schists and amphilbolites has increased the vul-nerability to erosion.

4.3 Scope and limitations

It is important to note that we explored the regional characteristics of landslide

initi-5

ation on Vancouver Island. Thus, the results obtained represent average conditions and characteristics of landslides that occurred during the high intensity rainfall event. Specific site characteristics of landslide initiation are generally different for catchments across Vancouver Island (Guthrie, 2002). Therefore, we expect that modelled effects on landslide initiation would also vary depending on specific catchment characteristics.

10

The regional modelling approach provides an overview of the underlying effects on landslide initiation to learn more about the corresponding controlling processes, which in turn can be applied to improve model predictions for regional landslide susceptibility. The landside sampling design may pose some challenges for accurately modelling initiation conditions. The spatial prediction of landslide initiation was modelled based

15

on a single pixel per landslide,∼400 m2area, that was mapped in the main scarp;

how-ever, initiation of debris flows may also occur in non-head scarp regions. Ideally, the exact point of initiation would be modelled. Additionally, only the pixel associated with initiation was labeled with a particular forest cover type. The surrounding or coarser-scale forest cover conditions were not considered. We observed that many of the

land-20

slides in the closed forest cover type occurred at or near the boundary between the other forest types. Therefore, we believe that effect of sparse forest, open, and semi-open forest types relative to closed forest may have been underestimated.

The additive models may have underestimated the effect of antecedent precipita-tion for a two-period on landslide initiaprecipita-tion as a result of bias introduced by random

25

(24)

NHESSD

2, 5525–5574, 2014

Extreme rainstorm on Vancouver Island,

Canada

J. N. Goetz et al.

Title Page

Abstract Introduction

Conclusions References

Tables Figures

◭ ◮

◭ ◮

Back Close

Full Screen / Esc

Printer-friendly Version Interactive Discussion

Discussion

P

a

per

|

Discus

sion

P

a

per

|

Discussion

P

a

per

|

Discussion

P

a

per

|

and poorly located data; the maximum elevation of the weather stations was only 580 m a.s.l. The RMSE and kriging variance provide an indication of how much local variation we are missing in our estimate of antecedent precipitation distribution. The “true” effect in our additive models would be expected to be larger than the estimated one. The thematic coarseness associated with our representation of geology by rock

5

type may have also contributed to regression dilution.

5 Conclusion

In this study, the regional effect of forest harvesting activities, topography, antecedent precipitation and rock type on over 600 landslides initiated during a major rainstorm on Vancouver Island, coastal British Columbia, was explored. Using a statistical approach,

10

several factors with a strong effect on landslide initiation were identified.

Forest cover types, as a surrogate for forest harvesting activities, and proximity to forest service roads were found to increase the likelihood of landslide initiation during the major rainfall event. These forestry activities were collectively associated with a 6 to 9-fold increase in the odds of landslide initiation. This finding supports earlier qualitative

15

studies and univariate analysis of landslide factors in the Pacific Northwest that found forestry activities contributed to increased landslide activity. However, the statistical ap-proach in this study improves on previous analysis of landslide factors by estimating the effect of forestry activities while accounting for possible confounders such as to-pography, and by considering possible nonlinear relationships in the statistical models

20

(i.e. the GAM).

While slope angle and other topographic variables (upslope contributing area and concavities in the slope) were the strongest predictors of landslide initiation, it is an im-practical task from a landslide risk management perspective to attempt to mitigate the effects of landslides by controlling topographic conditions, such as slope angle. We

ac-25

(25)

NHESSD

2, 5525–5574, 2014

Extreme rainstorm on Vancouver Island,

Canada

J. N. Goetz et al.

Title Page

Abstract Introduction

Conclusions References

Tables Figures

◭ ◮

◭ ◮

Back Close

Full Screen / Esc

Printer-friendly Version Interactive Discussion

Discussion

P

a

per

|

Discus

sion

P

a

per

|

Discussion

P

a

per

|

Discussion

P

a

per

|

In particular, road design, construction and remediation are perhaps the forestry activi-ties that we have the most control over. Our expectation is that this analysis continues to highlight and emphasize the regional effects of forest cover type and service roads on landslide initiation to assist landslide risk management associated with forestry prac-tices.

5

Acknowledgements. Thanks to the British Columbia Ministry of Forests, Lands and Natural

Resources and the British Columbia Ministry of Environment, and Environment Canada for providing open-access to spatial data required to complete this research.

The Ontario Graduate Scholarship (OGS) and the Natural Sciences and Engineering Re-search Council (NSERC) of Canada through the Alexander Graham Bell Canada Scholarship

10

awarded to J. N. Goetz and a Discovery Grant awarded to A. Brenning supported this research.

References

Ayalew, L. and Yamagishi, H.: The application of GIS-based logistic regression for landslide susceptibility mapping in the Kakuda-Yahiko Mountains, Central Japan, Geomorphology, 65, 15–31, 2005.

15

Blahut, J., van Westen, C. J., and Sterlacchini, S.: Analysis of landslide inventories for accurate prediction of debris-flow source areas, Geomorphology, 119, 36–51, 2010.

Brayshaw, D. and Hassan, M. A.: Debris flow initiation and sediment recharge in gullies, Geo-morphology, 109, 122–131, 2009.

Brenning, A.: Spatial prediction models for landslide hazards: review, comparison and

evalua-20

tion, Nat. Hazards Earth Syst. Sci., 5, 853–862, doi:10.5194/nhess-5-853-2005, 2005. Brenning, A.: Statistical geocomputing combining R and SAGA: the example of landslide

sus-ceptibility analysis with generalized additive models, in: SAGA – Seconds Out, edited by: Böhner, J., Blaschke, T., and Montanarella, L., Hamburger Beiträge zur Physischen Geogra-phie und Landschaftsökologie, 19, 23–32, 2008.

25

(26)

NHESSD

2, 5525–5574, 2014

Extreme rainstorm on Vancouver Island,

Canada

J. N. Goetz et al.

Title Page

Abstract Introduction

Conclusions References

Tables Figures

◭ ◮

◭ ◮

Back Close

Full Screen / Esc

Printer-friendly Version Interactive Discussion

Discussion

P

a

per

|

Discus

sion

P

a

per

|

Discussion

P

a

per

|

Discussion

P

a

per

|

Brenning, A., Grasser, M., and Friend, D. A.: Statistical estimation and generalized additive modeling of rock glacier distribution in the San Juan Mountains, Colorado, United States, J. Geophys. Res.-Earth, 112, F02S15, doi:10.1029/2006JF000528, 2007.

Brenning, A., Long, S., and Fieguth, P.: Detecting rock glacier and flow structures using Gabor filters and IKONOS imagery, Remote Sens. Environ., 125, 227–237, 2012.

5

Brenning, A., Schwinn, M., Ruiz-Páez, A. P., and Muenchow, J.: Landslide susceptibility near highways is increased by one order of magnitude in the Andes of southern Ecuador, Loja province, Nat. Hazards Earth Syst. Sci. Discuss., 2, 1945–1975, doi:10.5194/nhessd-2-1945-2014, 2014.

British Columbia Government, Crown Registry and Geographic Base Branch: Digital Road

At-10

las (DRA) – Master Partially Attributed Data, available at: http://archive.ilmb.gov.bc.ca/crgb/ products/mapdata/digital_road_atlas_products.htm (last access: 26 August 2014), 2007 British Columbia Government, Forest Analysis and Inventory Branch: VRI – Forest

Vegeta-tion Composite Polygons and Rank 1 Layer, available at: http://www.for.gov.bc.ca/hts/vridata/ (last access: 26 August 2014), 2013a.

15

British Columbia Government, Forest Analysis and Inventory Branch: The Provincial Har-vest Depletion Layer, available at: ftp://ftp.for.gov.bc.ca/hts/external/!publish/consolidated_ cutblocks/ (last access: 26 August 2014), 2013b

Carroll, R. J., Rupert, D., Stefanski, L. A., and Crainiceanu, C. M.: Measurement Error in Non-linear Models: a Modern Perspective, 2nd Edn., CRC Press, New York, 2012.

20

Canadian Government: Natural Resources Canada, Canadian Digital Elevation Data, available at: http://www.geobase.ca/geobase/en/data/cded/index.html (last access: 26 August 2014), 2000.

Chatwin, S.: Managing landslide risk from forest practices in British Columbia, British Columbia For. Prac. Board Spec. Investig. Rep. 14, BC For. Prac. Board, Victoria, BC, 2005.

25

Chung, C. J. F. and Fabbri, A. G.: Probabilistic prediction models for landslide hazard mapping, Photogramm. Eng. Rem. S., 65, 1389–1399, 1999.

Chung, C. J. F., Bobrowsky, P., and Guthrie, R. H.: Quantitative prediction model for landslide hazard mapping, Tsitika and Schmidt Creek Watersheds, Northern Vancouver Island, British Columbia, Canada, in: Geoenvironmental Mapping – Method, Theory and Practice, edited

30

by: Bobrowsky, P., A. A. Balkema Publishers, Lisse, the Netherlands, 697–716, 2001. Cohen, W. B., Spies, T. A., and Fiorella, M.: Estimating the age and structure of forests in

(27)

NHESSD

2, 5525–5574, 2014

Extreme rainstorm on Vancouver Island,

Canada

J. N. Goetz et al.

Title Page

Abstract Introduction

Conclusions References

Tables Figures

◭ ◮

◭ ◮

Back Close

Full Screen / Esc

Printer-friendly Version Interactive Discussion

Discussion

P

a

per

|

Discus

sion

P

a

per

|

Discussion

P

a

per

|

Discussion

P

a

per

|

Conrad, O.: SAGA – Program Structure and Current State of Implementation, edited by: Böh-ner, J., McCloy, K., and Strobl, J., Göttinger Geographische Abhandlungen, 115, 39–52, 2006.

Crist, E. P., Laurin, R., and Cicone, R. C.: Vegetation and soils information contained in trans-formed Thematic Mapper data, in proceedings, IGARSS’86 Symposium, Zürich, Switzerland,

5

8–11 September 1986, ESA Publ. Division, SP-254: 1465–1470, 1986

Crozier, M. J.: Prediction of rainfall-triggered landslides: a test of the antecedent water status model, Earth Surf. Proc. Land., 24, 825–833, 1999.

Dai, F. C. and Lee, C. F.: Landslide characteristics and slope instability modeling using GIS, Lantau Island, Hong Kong, Geomorphology, 42, 213–228, 2002.

10

Dai, F. C., Lee, C. F., and Ngai, Y. Y.: Landslide risk assessment and management: an overview, Eng. Geol., 64, 65–87, 2002.

Daly, C., Neilson, R. P., and Phillips, D. L.: A statistical–topographic model for mapping clima-tological precipitation over mountainous terrain, J. Appl. Meteorol., 33, 140–158, 1994.. Daly, C., Halbleib, M., Smith, J. I., Gibson, W. P., Doggett, M. K., Taylor, G. H., and Pasteris, P. P.:

15

Physiographically sensitive mapping of climatological temperature and precipitation across the conterminous United States, Int. J. Climatol., 2064, 2031–2064, 2008.

Davis, S. M., Landgrebe, D. A., Phillips, T. L., Swain, P. H., Hoffer, R. M., Lindenlaub, J. C., and Silva, L. F.: Remote Sensing: the Quantitative Approach, McGraw-Hill International Book Co., New York, 1978.

20

Demoulin, A. and Chung, C. J. F.: Mapping landslide susceptibility from small datasets: a case study in the Pays de Herve (E Belgium), Geomorphology, 89, 391–404, 2007.

Dhakal, A. S. and Sidle, R. C.: Long-term modelling of landslides for different forest manage-ment practices, Earth Surf. Proc. Land., 28, 853–868, 2003.

Dingman, S. L.: Physical Hydrology, Macmillan, New York, 1994.

25

Environment Canada: BC Weather Woes Part I: So Much Rain, So Little Water, available at: http://ec.gc.ca/meteo-weather/default.asp?lang=En&n=E578B454-1 (last access: 26 Au-gust 2014), 2013.

Foody, G. M.: Thematic map comparison: evaluating the statistical significance of differences in classification accuracy, Photogramm. Eng. Rem. S., 70, 627–634, 2004.

30

Imagem

Table 2. Confusion matrix for forest cover classification.
Table 3. Forest cover classification characteristics related to forest cutblock and crown closure inventories.
Table 4. Characteristics of landslides initiation sites with respect to forest cover and forest service roads.
Table 5. Statistical summary of predictor variables for landslide and non-landslide observations within the study area.
+7

Referências

Documentos relacionados

Os resultados incluem os valores do preço mínimo, médio e máximo diário de energia elétrica transacionada, bem como a amplitude de preços, a energia total de

For this purpose, optimum culture medium conditions for bacterial cellulose (BC) production by Gluconacetobacter sp.. were studied, namely inoculum density, pH, temperature,

Tabela 4.4: Método Iterativo, Abordagem 2: Resultados obtidos para o valor do raio ponderado inicial e melhor raio ponderado (mais baixo) para cada um dos 3 testes efetuados a 5

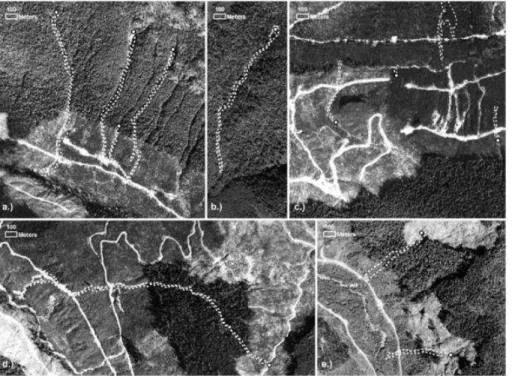
The view of the landslide from the back (B) shows landslide activity structures that are present in the aerial photography correlated with the InSAR signal in Fig. (C) and (D)

Based on two projects of environmental education in landslide risk areas in Brazil, this paper discusses the social and environmental vulnerability as historically established

On the left, under the label Polygons, the main characteristics of the Polygons are reported: the Polygon number (N), the name of the Polygon, the area of the Polygon, the

ABSTRACT: The abiotic disturbance of urban wastewater discharge and its effects in the population structure, plant morphology, leaf nutrient content, epiphyte load and

To our knowledge, this is the first longitudinal and prospective study involving Brazilian chil- dren that demonstrated the practice of NEBF to be associated with an increased risk