Rodolfo Hoffmann
Summary: 1. Introduction; 2. The data; 3. Decomposition of the Gini index; 4. Distribution in 10 income classes; 5. Results of the decomposition of the Gini index; 6. Conclusions.
Keywords: inequality; Brazil; pensions; Gini index.
JEL codes: D31; D63.
This paper analyzes the contribution of components of per capita
household income to total inequality of the income distribution in Brazil and its regions, using the corresponding decomposition of the Gini index. The income components considered are: income from the main job (activity), income from other jobs, pensions, donations, rent, interest, and other incomes. Only income from the main job and donations have a concentration ratio that is lower than the overall Gini index. One of the main results is that income from pensions contributes to increase overall inequality in Brazil, particularly in the metropolitan regions. Given the aging of the population, without change in the pension rules, the contribution of pensions in increasing inequality will be even stronger in the future.
Este artigo analisa a contribui¸c˜ao de parcelas do rendimento do-miciliarper capita para a desigualdade da distribui¸c˜ao da renda no Brasil e nas suas regi˜oes, usando a correspondente decomposi¸c˜ao do ´ındice de Gini. S˜ao consideradas as seguintes parcelas do rendi-mento: rendimento do trabalho principal, rendimento de outros trabalhos, aposentadorias e pens˜oes, doa¸c˜oes, rendimento de alu-guel e juros e outros rendimentos. Apenas os rendimentos do tra-balho principal e as doa¸c˜oes tˆem raz˜oes de concentra¸c˜ao menores do que o ´ındice de Gini do rendimento domiciliarper capita. Verifica-se que apoVerifica-sentadorias e pens˜oes contribuem para aumentar a de-sigualdade da distribui¸c˜ao da renda no Brasil, especialmente nas regi˜oes metropolitanas. Devido ao crescimento da participa¸c˜ao dos idosos na popula¸c˜ao, se n˜ao houver mudan¸cas no sistema de pre-vidˆencia, a contribui¸c˜ao das aposentadorias e pens˜oes para refor¸car a desigualdade ser´a ainda maior no futuro.
*This paper was received in Feb. 2002 and approved in Oct. 2002. The study presented here
was supported by CNPq and Fapesp. The author is grateful to Helga Hoffmann for her most valuable contribution in writing this paper.
1.
Introduction
This paper analyzes how the components of household income contribute to the inequality of the distribution of per capita household income in Brazil, using data of 1999. The components analyzed are: income from the main occupation, income from other occupations, retirement pensions and other pensions, rents, and other incomes (interest, dividends, etc.).
A striking result is that retirement pensions contribute considerably to the inequality of income distribution in the majority of the metropolitan regions of the country.
Several authors noted already that expenditures with retirement pensions and other pensions are not well focused if they are to be considered as social expendi-tures with the aim of fighting poverty (Amsberg et al., 2000, Barros and Foguel, 2000). Other researches examined the relationship between pensions, age and poverty (Barros et al., 1999, 2000, Delgado and Cardoso Jr., 2000).
The next section presents the data; section 3 contains a summary of the methodology for decomposition of the Gini index; section 4 analyzes tables with the distribution of population, of family income, and of its components in 10 classes ofper capitahousehold income; section 5 presents the results of the decomposition of the Gini index for Brazil, in six Brazilian regions and in the metropolitan areas; and section 6 is a summary of the main conclusions.
2.
The Data
The data used here are from the Brazilian National Sample Survey of House-holds of 1999, which will be referred to by the acronym Pnad (for its Brazilian title,Pesquisa Nacional por Amostra de Domic´ılios).
sample, corresponding to 41,861,683 households in the population as a whole, or 155.6 million people in the category being examined.
One should bear in mind the limitations of the income data resulting from the Pnad questionnaire. Total declared income underestimates considerably the national income. The main reason for this is, probably, that families avoided declaring all their income, in particular those with the highest incomes. Another reason, however, is that the Pnad does not capture the value of production for self-consumption. The income of those producing agricultural goods is hard to measure precisely and a significant part of incomes derived from the ownership of capital is certainly not declared.
It should be noted that the category ‘income from work’ (rendimento do tra-balho), for the Brazilian National Statistics Office, includes incomes obtained from any activity that an individual had (and declared), and is not limited to wages. ‘Income from work’ comprehends the income of self-employed and employers. We prefer thus to use here the expressions ‘income from all occupations’ (income from the main occupation and income from other occupations).
A final reminder on the data: Pnad does not collect data for the rural areas of the former North Region (states of Rondonia, Acre, Amazonas, Roraima, Par´a and Amap´a).
3.
Decomposition of the Gini Index
Pyatt et al. (1980) have shown very clearly how the Gini index may be decom-posed, when one wants to analyze incomes divided in their various components.1
Let yi be the income of the ith person. This paper deals with the per capita household income, assuming that this income is the sum ofkparts
yi = k
X
h=1
yhi (1)
Suppose those incomes yi are ordered so that y1 ≤y2 ≤. . .≤ yn, where nis
the size of the population. Thus,i is the rank of incomeyi.
It can be shown that the Gini index (G) of the distribution of yi is
G= 2
nµ cov(yi, i) (2)
1See also Shorrocks (1982, 1983). In Brazil this methodology was already used by Neder
whereµ is the average ofyi.
Pyatt et al. (1980) define the concentration ratio of the component yhi as
Ch = 2
nµh
cov(yhi, i) (3)
where µh is the average of yhi. For non-negative incomes the Gini index varies from zero to (n−1)/n and the concentration ratio varies from −(n−1)/n to (n−1)/n The participation of thehth component in the total income is
φh =
µh
µ (4)
It can be deduced that
G=
k
X
h=1
φhCh (5)
Let us indicate by ih the ranks associated to the values ofyhi if they were in increasing order. The values ofih, the same asi, vary from 1 to n. Note, however, that for a given yhi, the respective value of i (the rank of the corresponding yi) will not coincide, in general, with ih (the rank of this yhi in the ordering of the values of that component). Analogous to (2), the Gini index of yhi is
Gh = 2
nµh
cov(yhi, ih) (6)
From (3) and (6), we obtain
Rh =
Ch
Gh
= cov(yhi, i) cov(yhi, ih)
(7)
Pyatt et al. (1980) call Rh ‘rank correlation ratio’, stressing that it is not a rank correlation coefficient. It can be shown that
−1≤Rh ≤1
Hence −Gh≤Ch ≤Gh
From (5) and (7), it follows that
G=
k
X
h=1
This expression shows how the Gini index of yi is associated with the Gini indices of each component.
Note, in expression (5), that if all the concentration rations Ch had the same value, this would be also the value of G. Thus, it is reasonable to admit that a component yhi contributes to increase inequality (measured by the Gini index) when Ch > G. When Ch < G, the component yhi will be contributing to reduce inequality compared to that hypothetical situation in which all Ch are the same.
Obviously one item of the sum in the right-hand member of expression (8) will be negative only if the respective Rh is negative. This, on its turn, can only happen if cov(yhi, i)<0, as shown in expression (7).
All calculations in this paper were made considering the weight or expansion factor for each household in the Pnad sample as supplied by IBGE.
4.
Distribution in 10 Income Classes
In this section we analyze tables classifying households in 10 classes of per capita household income. Table 1 shows the distribution of permanent private households and of the corresponding people in these 10 classes. The first class includes those households that declared their income to be zero. It should be recalled that households where any person did not declare his/her income were excluded from this analysis.
Table 1 also presents the per capita income in each class and its share in the total income declared.
Table 2 presents the distribution, in these 10 classes, of four components of household income: income from the main occupation of the occupied persons in the household, income from other occupations, retirement pensions and other pensions, and other incomes. Here ‘retirement’ includes retirement caused by disability.
Those households with per capita income up to R$150 represent 50.5% of the total number of households and 56.8% of all people, and absorb 16.5% of the total income. At the other end, the households with per capita incomes above R$500 constitute 14.6% of the total, comprising 11.3% of the people, and receive 49.7% of the total income. This group of the relatively rich absorbs 48.5% of the total income derived from an occupation, 51.6% of all the income that comes from re-tirement pensions and other pensions, and 53.2% of the income that results from ‘official’ retirement pensions. It is striking that the income derived from pensions is more concentrated among the relatively rich households than the income ob-tained from all sources altogether. Such concentration is even heavier for ‘official’ retirement pensions.
Table 1
Distribution of households and persons in 10 classes ofper capita household income (Brazil, 1999)
Class of
per capita Households Persons Averageper capita % of total household No. (103
) % No. (103
) % income (R$) income
income (R$)
0 609.6 1.5 1,937 1.2 0 0
Over 0 to 50 5,500.3 13.1 28,009 18.0 32.2 2.3
Over 50 to 100 7,983.9 19.1 34,057 21.9 75.5 6.5
Over 100 to 150 7,041.1 16.8 24,387 15.7 126.5 7.8
Over 150 to 200 4,368.2 10.4 15,822 10.2 176.4 7.0
Over 200 to 300 5,421.4 13.0 18,270 11.7 248.4 11.4
Over 300 to 500 4,831.8 11.5 15,582 10.0 389.4 15.3
Over 500 to 1000 3,722.5 8.9 11,272 7.2 702.1 20.0
Over 1000 to 2000 1,659.3 4.0 4,597 3.0 1,393.4 16.1
Over 2000 723.6 1.7 1,640 1.1 3,283.7 13.6
Total 41,861.7 100.0 155,575 100.0 254.9 100.0
Table 2
Distribution of components of household income in classes ofper capita household income (Brazil, 1999)
Retirement
Class ofper capita Main Other All and other Other
household income (R$) occupation occupations occupations pensions incomes*
0 0 0 0 0 0
Over 0 to 50 2.4 2.0 2.4 1.8 2.7
Over 50 to 100 6.8 3.4 6.6 6.1 4.8
Over 100 to 150 7.8 3.5 7.6 9.2 4.5
Over 150 to 200 7.6 3.2 7.4 6.0 4.3
Over 200 to 300 12.0 6.1 11.7 10.9 7.7
Over 300 to 500 15.9 10.7 15.7 14.5 11.1
Over 500 to 1000 19.8 21.2 19.9 20.6 18.9
Over 1000 to 2000 15.6 24.8 15.9 16.6 18.7
Over 2000 12.3 25.0 12.8 14.4 27.3
Total 100.0 100.0 100.0 100.0 100.0
* Including donations, rents, interest, dividends etc.
Table 3
Distribution of components of pensions and other incomes in classes ofper capita
household income (Brazil, 1999)
Class ofper ‘Official’ Other Other Interest,
capitahousehold retirement ‘official’ retirement and Donations Rents dividends
income (R$) pensions pensions other pensions etc.
0 0 0 0 0 0 0
Over 0 to 50 1.6 2.5 2.2 9.9 0.3 2.8
Over 50 to 100 5.8 7.4 6.1 12.9 1.8 6.0
Over 100 to 150 8.9 11.0 7.7 9.0 2.6 6.0
Over 150 to 200 5.7 6.6 6.8 8.2 3.2 3.7
Over 200 to 300 10.5 13.0 9.8 11.1 7.3 6.0
Over 300 to 500 14.4 15.4 13.5 15.7 11.2 7.0
Over 500 to 1,000 20.6 20.0 22.9 18.8 20.7 14.0 Over 1,000 to 2,000 17.5 13.6 15.7 9.0 22.8 16.5
Over 2,000 15.2 10.6 15.3 5.4 30.2 38.2
Total 100.0 100.0 100.0 100.0 100.0 100.0
Table 4
Share of the components of household income according to classes ofper capita
household income (Brazil, 1999)
Class of Share (%) of income
per capita Retirement ‘Official’ Other Other household Main Other and other retirement ‘official’ incomes* Rents income (R$) occupation occupation pensions pensions pensions
Over 0 to 50 79.1 2.7 13.9 9.0 3.6 4.4 0.3
Over 50 to 100 78.8 1.5 16.9 11.9 3.8 2.8 0.6
Over 100 to 150 75.5 1.3 21.0 15.1 4.7 2.2 0.7
Over 150 to 200 81.3 1.4 15.1 10.7 3.1 2.3 1.0
Over 200 to 300 79.0 1.6 17.0 12.1 3.8 2.5 1.4
Over 300 to 500 78.4 2.1 16.9 12.4 3.4 2.7 1.6
Over 500 to 1,000 74.9 3.2 18.4 13.6 3.4 3.5 2.3
Over 1,000 to 2,000 72.8 4.6 18.3 14.3 2.8 4.3 3.1
Over 2,000 68.2 5.5 18.8 14.8 2.6 7.4 4.8
Total 75.5 3.0 17.8 13.2 3.3 3.7 2.2
* Including donations, rents, interest, dividends etc.
Note, in table 4, that the participation of retirement and other pensions is relatively high in the income class ‘over 100 to 150’, because into this class comes the value of the minimum wage (R$136 in September 1999), which is a very com-mon amount for retirement and other pensions. All the households that have only retirees, each receiving a minimum wage, appear in this income class.
Taken together, the income from all occupations, plus pensions, reaches 96.3% of the total income. All other incomes (including donations, rents, interest, and dividends) constitute only 3.7% of the total. To some extent such a small share is due to the fact that these incomes are particularly understated.
Tables 5 to 9 show the distribution, in the same classes, of the households, the persons, the total income and four of its components for the metropolitan areas of Brazil, the urban non-metropolitan areas, the rural non-metropolitan areas, the metropolitan areas of the Northeast region of Brazil, and the metropolitan area of S˜ao Paulo. Metropolitan areas include 47.2 million people, 30.4% of the population analyzed (155.6 million people).
Observe, in the metropolitan areas of Brazil (table 5), that households with
Table 5
Distribution of households, persons and various components of income in 10 classes of
per capita household income (metropolitan Brazil, 1999)
Class of Income Income ‘Official’
per capita Households Persons Total from from Pensions retirement
household (%) (%) income main all (%) pensions
income (%) occupation occupations (%)
(R$) (%) (%)
0 1.7 1.4 0 0 0 0 0
Over 0 to 50 6.4 9.0 0.9 0.9 0.9 0.8 0.5
Over 50 to 100 13.9 16.8 3.6 4.0 3.9 2.7 2.2 Over 100 to 150 14.8 15.5 5.5 5.9 5.7 5.0 4.2 Over 150 to 200 11.0 11.6 5.7 6.3 6.1 4.6 4.2 200 to 300 15.0 14.5 10.0 10.5 10.3 9.8 9.7 Over 300 to 500 14.6 13.2 14.4 14.9 14.7 14.4 14.6 Over 500 to 1,000 13.0 11.0 21.4 21.3 21.3 22.6 22.7 Over 1,000 to 2,000 6.4 4.9 19.2 18.8 19.0 19.8 20.5 Over 2,000 3.3 2.1 19.3 17.5 18.1 20.4 21.3 Total 100.0 100.0 100.0 100.0 100.0 100.0 100.0
The same concentration is present in the non-metropolitan urban areas (table 6). Households with per capita income above R$500 are 13.6% of the total, con-stitute 10.8% of the people, take 45.6% of the total income, 44.5% of the income of all occupations, 47.5% of the sum of pensions and 50.2% of ‘official’ retirement pensions.
Table 6
Distribution of households, persons and various components of income in 10 classes of
per capita household income (urban non-metropolitan Brazil, 1999)
Class of Income Income ‘Official’
per capita Households Persons Total from from Pensions retirement
household (%) (%) income main all (%) pensions
income (%) occupation occupations (%)
(R$) (%) (%)
0 1.3 1.2 0 0 0 0 0
Over 0 to 50 10.9 14.9 2.0 2.1 2.0 1.8 1.6 Over 50 to 100 19.3 22.4 6.8 7.1 6.9 6.7 6.1 Over 100 to 150 17.7 16.4 8.3 8.3 8.1 10.4 9.8 Over 150 to 200 11.0 10.9 7.8 8.4 8.2 6.4 6.1 Over 200 to 300 13.8 12.7 12.7 13.3 13.1 11.7 10.9 Over 300 to 500 12.3 10.8 16.8 17.4 17.2 15.6 15.3 Over 500 to 1,000 8.7 7.2 20.5 20.3 20.4 20.7 20.8 Over 1,000 to 2,000 3.6 2.7 15.2 14.3 14.8 15.9 17.3
Over 2,000 1.3 0.8 9.9 8.8 9.3 10.9 12.2
In the rural areas (table 7), the concentration of retirement pensions in favor of the rich is apparently not stronger than that for income taken as a whole. On the contrary, the participation of the richest households in the income from pensions is significantly lower than their participation in the income from all occupations. In these areas, households withper capita income above R$500 constitute 2.8% of the total, comprise 2.0% of the people, receive 20.1% of the total income, 21.0% of the income from all occupations and only 13.9% of the income coming from pensions.
Nevertheless, a higher concentration of pensions can be detected if a different aggregation of income classes is used. Households with per capita income above R$100 are 39.4% of the total, have 29.8% of all persons, take 68.9% of the total income, 68.3% of the income of all occupation, 70.6% of pensions and 71.1% of all ‘official’ retirement pensions. Note that in this aggregation of income classes the limit used to define the ‘relatively rich’ is lower than one minimum wage (R$136 in 1999). The apparent stronger concentration of pensions than of all income in all likelihood is due to the fact that incomes from farming are understated and that the value of production for self-consumption is omitted.2
Table 7
Distribution of households, persons and various components of income in 10 classes of
per capita household income (rural non-metropolitan Brazil, 1999)
Class of Income Income ‘Official’
per capita Households Persons Total from from Pensions retirement
household (%) (%) income main all (%) pensions
income (%) occupation occupations (%)
(R$) (%) (%)
0 1.4 1.2 0 0 0 0 0
Over 0 to 50 31.5 40.4 11.4 12.2 12.3 7.1 6.5 Over 50 to 100 27.7 28.6 19.8 19.6 19.4 22.3 22.4 Over 100 to 150 18.0 14.0 16.6 15.0 14.8 25.5 26.6 Over 150 to 200 7.7 5.9 9.7 9.6 9.5 11.1 11.2 Over 200 to 300 6.9 4.9 11.5 11.5 11.5 11.8 11.4 Over 300 to 500 3.9 3.0 10.9 11.4 11.5 8.2 8.0 Over 500 to 1,000 2.0 1.4 9.0 8.8 8.9 9.0 8.9 Over 1000 to 2,000 0.7 0.4 6.0 6.3 6.6 3.3 3.1
Over 2,000 0.2 0.1 5.1 5.6 5.5 1.6 2.0
Total 100.0 100.0 100.0 100.0 100.0 100.0 100.0
2See Delgado and Cardoso Jr. (2000) for an analysis of the beneficial impact of rural social
The evidence presented up to now reveals a stronger concentration of pensions in favor of the relatively rich in the urban areas. We will examine in particular the metropolitan areas of the Northeast (table 8) and the metropolitan area of S˜ao Paulo (table 9).
In the metropolitan areas of the Northeast that concentration is striking. Households with per capita income above R$500 are 13.1% of the total, shel-ter 9.9% of the people, and receive 51.9% of the total income, 50.2% of the income from all occupations, 56.9% of pensions, and 60.0 of ‘official’ retirement pensions.
Table 8
Distribution of households, persons and various components of income in 10 classes of
per capita household income (metropolitan Northeast of Brazil, 1999)
Class of Income Income ‘Official’
per capita Households Persons Total from from Pensions retirement
household (%) (%) income main all (%) pensions
income (%) occupation occupations (%)
(R$) (%) (%)
0 1.8 1.4 0 0 0 0 0
Over 0 to 50 16.2 21.2 3.1 3.3 3.2 2.3 1.8 Over 50 to 100 24.3 27.3 8.8 9.8 9.4 6.9 6.0 Over 100 to 150 16.7 15.6 8.4 9.0 8.7 7.7 7.2 Over 150 to 200 9.5 8.9 6.7 7.4 7.2 5.2 4.7 Over 200 to 300 10.0 8.6 9.2 9.5 9.3 9.1 8.9 Over 300 to 500 8.4 7.2 12.0 12.2 12.0 11.8 11.4 Over 500 to 1,000 7.1 5.7 17.3 16.5 16.5 20.4 20.0 Over 1,000 to 2,000 4.2 3.0 18.3 17.5 18.0 18.9 19.2 Over 2,000 1.8 1.2 16.3 14.7 15.6 17.6 20.8 Total 100.0 100.0 100.0 100.0 100.0 100.0 100.0
Table 9 shows that in the metropolitan region of S˜ao Paulo the concentration of pensions we have been examining is not present. Households with per capita
Table 9
Distribution of households, persons and various components of income in 10 classes of
per capita household income (metropolitan region of S˜ao Paulo, 1999)
Class of Income Income ‘Official’
per capita Households Persons Total from from Pensions retirement
household (%) (%) income main all (%) pensions
income (%) occupation occupations (%)
(R$) (%) (%)
0 2.3 2.0 0 0 0 0 0
Over 0 to 50 3.8 5.4 0.5 0.5 0.5 0.5 0.3
Over 50 to 100 10.5 13.1 2.6 2.7 2.6 2.3 1.9 Over 100 to 150 13.2 14.3 4.5 4.7 4.6 5.1 4.3 Over 150 to 200 10.7 11.7 5.2 5.4 5.3 5.3 5.0 Over 200 to 300 15.5 15.9 9.8 10.0 9.8 11.1 11.6 Over 300 to 500 17.3 16.2 15.6 15.8 15.6 18.6 19.5 Over 500 to 1,000 15.7 13.4 23.0 22.4 22.5 27.1 28.5 Over 1,000 to 2,000 7.2 5.7 19.7 20.2 20.3 16.5 17.7 Over 2,000 3.7 2.4 19.1 18.4 18.8 13.4 11.2 Total 100.0 100.0 100.0 100.0 100.0 100.0 100.0
In the next section, we apply the methodology for the decomposition of the Gini index according to the different components of household income, in order to reach a more synthetic analysis of the contribution of pensions to income inequality in Brazil.
5.
Results of the Decomposition of the Gini Index
Table 10 shows the results of the decomposition of the Gini index of the per capita household income in Brazil, considering six components: income from the main occupation of those persons who are occupied, income from other occupa-tions, pensions, donaoccupa-tions, rents, and an item that includes interest, dividends and other incomes. Of these components, only income from the main occupation and donations have a concentration ratio lower than the global Gini index. Although the concentration ratio of donations is the lowest, it is still positive, indicating that the value of per capita donations received tends to increase with the rise of theper capita household income.
Table 10
Decomposition of the Gini index for theper capita household income (Brazil, 1999)
Components of Average value Gini index Share % Concentration ratio
income (R$) (Gh) (φh) (Ch) φhCh
Main occupation 192.4 0.628 75.5 0.579 0.437
Other occupations 7.6 0.978 3.0 0.745 0.022
Pensions 45.4 0.876 17.8 0.603 0.107
Donations 1.8 0.990 0.7 0.354 0.002
Rents 5.6 0.986 2.2 0.803 0.018
Interest etc. 2.1 0.991 0.8 0.695 0.006
Total 254.9 0.592 100.0 0.592 0.592
Table 10 shows that, due to its large share in the total income (75.5%), income from the main occupation is responsible for the highest part of the Gini index (almost 74% of the total).
Among the remaining components, pensions play an important role, as they are 17.8% of the total income and generate 18.1% of the Gini index.
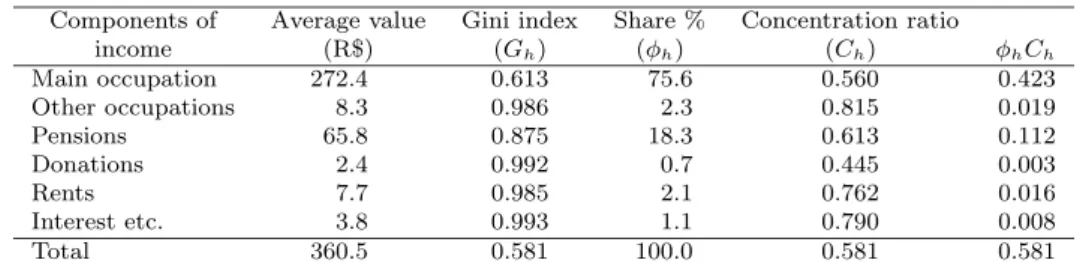
The role of pensions is more striking in the metropolitan areas (table 11), where they represent 18.3% of the total income and are responsible for 19.3% of the Gini index.
Table 11
Decomposition of the Gini index for theper capita household income (metropolitan Brazil, 1999)
Components of Average value Gini index Share % Concentration ratio
income (R$) (Gh) (φh) (Ch) φhCh
Main occupation 272.4 0.613 75.6 0.560 0.423
Other occupations 8.3 0.986 2.3 0.815 0.019
Pensions 65.8 0.875 18.3 0.613 0.112
Donations 2.4 0.992 0.7 0.445 0.003
Rents 7.7 0.985 2.1 0.762 0.016
Interest etc. 3.8 0.993 1.1 0.790 0.008
Total 360.5 0.581 100.0 0.581 0.581
In the urban non-metropolitan areas (table 12) the impact of pensions on the Gini index is ‘neutral’: those incomes represent 17.5% of the total income and originate 17.5% of the Gini index. This happens because the concentration ratio of pensions (0.562) is practically the same as the Gini index (0.560).
Table 12
Decomposition of the Gini index for theper capita household income (urban non-metropolitan Brazil, 1999)
Components of Average value Gini index Share % Concentration ratio
income (R$) (Gh) (φh) (Ch) φhCh
Main occupation 187.5 0.598 75.4 0.545 0.411
Other occupations 8.3 0.976 3.3 0.774 0.026
Pensions 43.5 0.868 17.5 0.562 0.098
Donations 1.8 0.986 0.7 0.242 0.002
Rents 5.9 0.983 2.4 0.796 0.019
Interest etc. 1.5 0.989 0.6 0.610 0.004
Total 248.5 0.560 100.0 0.560 0.560
Table 13
Decomposition of the Gini index for theper capita household income (rural non-metropolitan Brazil, 1999)
Components of Average value Gini index Share % Concentration ratio
income (R$) (Gh) (φh) (Ch) φhCh
Main occupation 79.3 0.595 75.4 0.535 0.403
Other occupations 4.5 0.952 4.3 0.543 0.023
Pensions 18.3 0.845 17.4 0.542 0.094
Donations 0.7 0.987 0.7 0.171 0.001
Rents 1.4 0.993 1.4 0.851 0.012
Interest etc. 1.0 0.986 1.0 0.507 0.005
Total 105.3 0.538 100.0 0.538 0.538
Tables 14a and 14b show summary results of the decomposition of the Gini index for theper capita household income for six Brazilian regions.
The portion of the Gini index associated to pensions is particularly large in the Northeast and in the grouping MG+ES+RJ (the three states - Minas Gerais, Espirito Santo and Rio de Janeiro), as in these regions one observes a high value of the concentration ratio (Ch) as well as a high share of these incomes in the total income (φh).
Table 14a
Decomposition of the Gini index of theper capita household income in regions of Brazil, 1999: participation of the component in the total income (φh), concentration ratio (Ch)
and share of the component in the general Gini index (φhCh)
Components of income North Northeast MG + ES + RJ
φh Ch φhCh φh Ch φhCh φh Ch φhCh
Main occupation 81.9 0.559 0.458 70.2 0.589 0.413 71.8 0.537 0.385 Other occupations 3.3 0.792 0.026 5.0 0.705 0.035 2.8 0.802 0.023
Pensions 12.2 0.541 0.066 21.4 0.630 0.135 22.4 0.628 0.140
Donations 0.9 0.338 0.003 1.3 0.335 0.004 0.6 0.406 0.002
Rents 1.3 0.735 0.010 1.4 0.856 0.012 1.8 0.770 0.014
Interest etc. 0.4 0.758 0.003 0.7 0.524 0.004 0.6 0.577 0.004
Total 100.0 0.566 0.566 100.0 0.604 0.604 100.0 0.568 0.568
Comparing the Northeast and the South, it is easy to observe that almost all the difference in the Gini index of the two regions is associated to the portion regarding pensions.
Table 14b
Decomposition of the Gini index of theper capita household income in regions of Brazil, 1999: participation of the component in the total income (φh), concentration ratio (Ch)
and share of the component in the general Gini index (φhCh)
Components of income S˜ao Paulo South Center-West
φh Ch φhCh φh Ch φhCh φh Ch φhCh
Main occupation 79.0 0.525 0.415 75.6 0.539 0.407 79.5 0.566 0.450 Other occupations 1.8 0.791 0.014 3.5 0.793 0.027 2.9 0.777 0.022
Pensions 15.0 0.524 0.078 16.8 0.568 0.096 13.9 0.661 0.092
Donations 0.5 0.399 0.002 0.6 0.426 0.003 0.6 0.335 0.002
Rents 2.7 0.758 0.020 2.5 0.791 0.020 2.4 0.740 0.018
Interest etc. 1.0 0.789 0.008 1.0 0.683 0.007 0.7 0.676 0.004
Total 100.0 0.538 0.538 100.0 0.560 0.560 100.0 0.589 0.589
Tables 15a, 15b and 15c summarize the results of the decomposition of the Gini index in nine Brazilian metropolitan regions.
Regarding the portion of the Gini index associated to pensions, our attention is drawn to the higher values in Rio de Janeiro, Fortaleza and Recife. The share of pensions in the total income reaches 25.5% in Rio de Janeiro, 23.1% in the metropolitan region of Recife and is nearly 20% in Fortaleza, Salvador, Belo Hor-izonte and Porto Alegre, 18.6% in Brasilia, 14.3% in Curitiba and 13.1% in S˜ao Paulo.
from the main occupation is higher in S˜ao Paulo than the corresponding value in Rio de Janeiro. Also the portions corresponding to rents, as well as to dividends, interest and other incomes are higher in S Paulo. There are also differences in the concentration ratios. However, the main difference between Rio and S˜ao Paulo lies in the composition of income: while in Rio the share of income from the main occupation and the share of pensions in the total income are respectively 70.4% and 25.5%, the corresponding shares in S˜ao Paulo are 80.6% and 13.1%.
Table 15a
Decomposition of the Gini index of theper capita household income in metropolitan areas of Brazil, 1999: participation of the component in the total income (φh), concentration ratio (Ch) and share of the component in the general Gini index (φhCh)
Components of income Fortaleza Recife Salvador
φh Ch φhCh φh Ch φhCh φh Ch φhCh
Main occupation 72.1 0.579 0.417 69.7 0.601 0.419 72.6 0.600 0.436 Other occupations 3.3 0.857 0.028 3.7 0.837 0.031 4.1 0.834 0.034
Pensions 20.5 0.702 0.144 23.1 0.655 0.151 19.3 0.650 0.125
Donations 1.6 0.396 0.006 1.2 0.349 0.004 1.2 0.552 0.007
Rents 1.4 0.828 0.012 1.7 0.764 0.013 2.3 0.793 0.018
Interest etc. 1.1 0.809 0.009 0.6 0.559 0.003 0.6 0.776 0.005
Total 100.0 0.616 0.616 100.0 0.622 0.622 100.0 0.624 0.624
Table 15b
Decomposition of the Gini index of theper capita household income in metropolitan areas of Brazil, 1999: participation of the component in the total income (φh), concentration ratio (Ch) and share of the component in the general Gini index (φhCh)
Components of income Belo Horizonte Rio de Janeiro S˜ao Paulo
φh Ch φhCh φh Ch φhCh φh Ch φhCh
Main occupation 73.6 0.543 0.400 70.4 0.516 0.363 80.6 0.547 0.441 Other occupations 2.8 0.842 0.024 1.9 0.842 0.016 1.8 0.795 0.014
Pensions 19.5 0.641 0.125 25.5 0.625 0.160 13.1 0.509 0.067
Donations 0.6 0.585 0.003 0.7 0.425 0.003 0.5 0.505 0.003
Rents 2.5 0.743 0.018 1.1 0.766 0.009 2.5 0.716 0.018
Interest etc. 1.1 0.783 0.008 0.4 0.769 0.003 1.5 0.831 0.012
Table 15c
Decomposition of the Gini index of the per capita household income in metropolitan areas of Brazil, 1999: participation of the component in the total income (φh), concentration ratio (Ch) and share of the component in the general Gini index (φhCh)
Components of income Curitiba Porto Alegre Brasilia (DF)
φh Ch φhCh φh Ch φhCh φh Ch φhCh
Main occupation 77.2 0.530 0.410 71.4 0.528 0.377 76.6 0.595 0.456 Other occupations 3.0 0.834 0.025 3.2 0.801 0.025 2.2 0.836 0.018
Pensions 14.3 0.632 0.091 20.6 0.641 0.132 18.6 0.739 0.138
Donations 0.6 0.515 0.003 0.6 0.617 0.004 0.4 0.134 0.001
Rents 3.5 0.839 0.030 2.7 0.867 0.023 1.6 0.621 0.010
Interest etc. 1.3 0.809 0.010 1.5 0.759 0.011 0.6 0.234 0.001
Total 100.0 0.569 0.569 100.0 0.573 0.573 100.0 0.624 0.624
6.
Conclusions
The decomposition of the household income in its various components allows us to examine how each of them contributes to the strong inequality observed in Brazil.
According to the 1999 Pnad data, 75.5% of the average household income in Brazil results from the main occupation and 78.5% come from all occupations taken together (including own-account work and of employers’ work). Pensions represent the next important component (17.8%) of the total income.
The income from the main occupation is always less concentrated in favor of the rich than the total income, when people are classified according to their
per capita household income. But this difference is small in rural areas. Income from other occupations (that is, excluded the main occupation) is always more concentrated than the total income. Once more, the difference is small in rural areas.
Pensions are, in general, more concentrated than the total income. This con-centration is present also in rural areas, although the distribution of pensions in rural areas is in general very different from the one observed in urban areas.
In the metropolitan areas, pensions (and especially ‘official’ pensions) con-tribute substantially to increase inequality in the distribution of the per capita
household income. This phenomenon is more accentuated in the cases of For-taleza, Recife and Rio de Janeiro. The metropolitan area of S˜ao Paulo is the exception here: pensions are less concentrated in favor of the relatively rich than the total income.
pre-cisely one component of income very much subject to laws and regulations, such as ‘official’ retirement pensions, is contributing to worsen inequality.
References
Amsberg, J. v., Lanjouw, P., & Nead, K. (2000). A focaliza¸c˜ao do gasto social sobre a pobreza no Brasil. In Henriques, R., editor, Desigualdade e Pobreza No Brasil. Ipea, Rio de Janeiro.
Barros, R., Firpo, S., Mendon¸ca, R., & Santos, D. (2000). Aposentadoria e pobreza no Brasil. In Encontro Nacional de Economia, 28. Anais...Campinas.
Barros, R. & Foguel, M. N. (2000). A focaliza¸c˜ao dos gastos p´ublicos sociais e erradica¸c˜ao da pobreza no Brasil. In Henriques, R., editor, Desigualdade e Pobreza No Brasil. Ipea, Rio de Janeiro.
Barros, R., Mendon¸ca, R., & Santos, D. (1999). Incidˆencia e natureza da pobreza entre idosos no Brasil. In Camarano, A. A., editor, Muito Al´em Dos 60: Os Novos Idosos Brasileiros. Ipea, Rio de Janeiro.
Bourguignon, F., Ferreira, F. H. G., & Leite, P. G. (2001). Prices, preferences or endowments? accounting for excess inequality in Brazil. In Delgado, G. & Cardoso Jr., J. C. O., editors, Encontro Brasileiro de Econometria, 23. Anais, Salvador.
Delgado, G. & Cardoso Jr., J. C. O. (2000). A Universaliza¸c˜ao de Direitos Sociais No Brasil: A Previdˆencia Rural Nos Anos 90. Ipea, Bras´ılia.
IBGE (2000). Pesquisa Nacional Por Amostra de Domic´ılios, volume 21. Brasil.
Mariano, J. L. & Lima, R. C. (1998). A desigualdade da renda rural no nordeste: An´alise da desagrega¸c˜ao do coeficiente de Gini e da sensibilidade do ´ındice de bem-estar de Sen. An´alise Econˆomica, 16(29):103–18.
Neder, H. D. (2001). Os efeitos das atividades n˜ao-agr´ıcolas na distribui¸c˜ao de renda no meio rural. In Congresso Brasileiro de Economia e Sociologia Rural, 39. Anais. Sober, Recife. CD-ROM.
Pyatt, G., Chen, C.-N., & Fei, J. (1980). The distribution of income by factor components. The Quarterly Journal of Economics, 95(3):451–73.
Ramos, C. A. (2000). Impacto distributivo do gasto p´ublico: Uma an´alise a partir da PCV/1998. Rio de Janeiro, Ipea. Texto para Discuss˜ao, 732.
Shorrocks, A. F. (1982). Inequality decomposition by factor components. Econo-metrica, 50(1):193–211.