A comparison of metrics for estimating phylogenetic signal under alternative
evolutionary models
José Alexandre F. Diniz-Filho
1, Thiago Santos
2, Thiago Fernando Rangel
1and Luis Mauricio Bini
1 1Departamento de Ecologia, Instituto de Ciências Biológicas, Universidade Federal de Goiás, Goiânia,
GO, Brazil.
2
Programa de Pós-Graduação em Ecologia e Evolução, Instituto de Ciências Biológicas,
Universidade Federal de Goiás, Goiânia, GO, Brazil.
Abstract
Several metrics have been developed for estimating phylogenetic signal in comparative data. These may be impor-tant both in guiding future studies on correlated evolution and for inferring broad-scale evolutionary and ecological processes (e.g., phylogenetic niche conservatism). Notwithstanding, the validity of some of these metrics is under debate, especially after the development of more sophisticated model-based approaches that estimate departure from particular evolutionary models (i.e., Brownian motion). Here, two of these model-based metrics (Blomberg’s K-statistics and Pagel’sl) are compared with three statistical approaches [Moran’sI autocorrelation coefficient, co-efficients of determination from the autoregressive method (ARM), and phylogenetic eigenvector regression (PVR)]. Based on simulations of a trait evolving under Brownian motion for a phylogeny with 209 species, we showed that all metrics are strongly, although non-linearly, correlated to each other. Our analyses revealed that statistical ap-proaches provide valid results and may be still particularly useful when detailed phylogenies are unavailable or when trait variation among species is difficult to describe by more standard Brownian or O-U evolutionary models.
Key words:autocorrelation, Blomberg’sK, Pagel’s lambda, autoregressive method, Moran’sI, phylogenetic eigenvector regression. Received: November 30, 2011; Accepted: April 18, 2012.
Introduction
Phylogenetic signal was defined by Blomberg and Garland (2002) “...as a tendency for related species to re-semble each other more than they rere-semble species drawn at random from a tree”. The lack of statistical independ-ence among species implied by a phylogenetic signal pre-cludes the use of traditional statistical tests in studies of correlated evolution (Felsenstein, 1985). However, it is im-portant to note that the lack of independence should first be tested, and not simply assumed a priori, before using phylogenetically-based statistical methods (Gittleman and Kot, 1990). Thus, one initial motivation for estimating phylogenetic signal was to establish which (in any) correc-tion must be made to take the phylogenetic relacorrec-tionships among species into account (see Martins and Garland 1991; Martinset al., 2002).
In addition to this methodological issue, there has been a growing interest on how phylogenetic signal can be used to infer broad-scale evolutionary and ecological pro-cesses (Martins, 2000; Diniz-Filho, 2001; Cooper et al.
2010; Hof et al., 2010; but also see Revell et al., 2008; Losos, 2008). For instance, when a trait is positively auto-correlated across the phylogeny, the most common expla-nation involves inheritance from a common ancestor or phylogenetic niche conservatism. Negative phylogenetic autocorrelations (i.e., when close relatives are more differ-ent in a given trait than randomly chosen pairs of taxa), al-though not so common, may arise due to recent events of evolutionary divergence induced by character displace-ment.
Currently, there are several ways to quantify phylo-genetic signal in comparative data (see Blomberg and Garland, 2002). The earliest techniques were based on sta-tistical methods (e.g., phylogenetic autocorrelation coeffi-cients, phylogenetic correlograms and autoregressive mod-els), that quantify the level of phylogenetic autocorrelation for a given trait of interest throughout the phylogeny (see Cheverud et al., 1985; Gittleman and Kot, 1990; Diniz-Filho et al., 1998), or under non-stationary processes (Diniz-Filhoet al., 2010). When more detailed and accurate phylogenies are available, it is also possible to ascertain the expected divergence between species by assuming a theo-retical model of trait evolution, and thus derive model-based metrics to compare expected and observed
diver-www.sbg.org.br
Send correspondence José Alexandre F. Diniz-Filho, Diniz-Filho. Departamento de Ecologia, Instituto de Ciências Biológicas, Uni-versidade Federal de Goiás, Caixa Postal 131, 74001-970 Goiânia, GO, Brazil. E-mail: [email protected].
gences (e.g., Pagel, 1999; Freckleton et al., 2002; Blomberget al., 2003). In this case, Brownian motion is the most commonly used reference model for inferring changes in quantitative traits. Under Brownian motion, phenotypic divergence (covariance) among species increases linearly with time (Felsenstein, 1985, 1988; Hansen and Martins, 1996), and this can be interpreted as resulting from a pure neutral evolutionary model or from rapid and independent responses of species traits to randomly changing environ-ments (e.g., see Hansenet al., 2008).
In spite of the debate on the relative merits of statisti-cal and model-based approaches (e.g., Martinset al., 2002), they usually produce similar results when evaluating evolu-tionary correlations between traits (see Martinset al., 2002; Diniz-Filho and Tôrres, 2002). Thus, it is likely that these approaches would also provide similar results when esti-mating phylogenetic signal (for a theoretical evaluation of the metrics underlying phylogenetic autocorrelation analy-sis see Pavoineet al., 2007; Diniz-Filhoet al., 2012a). Here we use simulated data and show that, for a constant phylog-eny, all metrics are comparable and provide similar results, despite their different statistical and conceptual back-grounds. Focus was not placed on the statistical perfor-mance of well-established methods (Martins 1996; Diniz-Filhoet al., 2012a), but rather on the correlations among estimates across evolutionary models.
Materials and Methods
Simulations
We performed simulations for a trait with zero mean and unity variance evolving under Brownian motion. We also generated simulations for Ornstein-Uhlenbeck (O-U) processes witha-parameter equal to 2, 4, 6, 8 and 10, which tend to progressively eliminate phylogenetic signal (see Diniz-Filho, 2001). For each parameter, 200 simulations were performed using the routine PDSIMUL of “Pheno-typic Diversity Analysis Program” (PDAP) (Garlandet al., 1993).
In all simulations, the phylogenetic relationships among the 209 species were based on the terrestrial Carnivora supertree (Bininda-Emondset al., 2008). This phylogeny was used only as a reference for Brownian-motion evolution and to represent a real topology and ob-served distribution of branch lengths. The phylogenetic dis-tances among species were expressed as patristic disdis-tances, forming the matrix D, or conversely as phylogenetic covariances (matrix C), the proportion of shared branch length from root to tip between pairs of species (in this case with an ultrametric tree, the main diagonal was set to 1.0, so that thisCmatrix can also be viewed as a pairwise matrix of phylogenetic correlations between species - see Helmuset al., 2007). This C matrix is the expectation correlation among phenotypes under Brownian motion (Hansen and Martins, 1996).
Metrics for phylogenetic signal
Five methods for measuring phylogenetic signal were used for each simulation, which can be broadly divided into “statistical” and “model-based” approaches. A detailed de-scription of these metrics can be found elsewhere (Cheverud et al., 1985; Gittleman and Kot, 1990, Diniz-Filho et al. 1998; Pagel, 1999; Freckleton et al., 2002; Blomberg et al., 2003). First, for statistical-based metrics, we used the Moran’sIautocorrelation coefficient, which is given by
I n S
y y y y w
y y
i j ij
j n i n i i n =æ è çç öø÷÷
- -= = =
å
å
å
0 1 1 2 1 ( )( ) ( ) é ë ê ê ê ê ù û ú ú ú úwherenis the number of species,yiandyjare the trait
val-ues in a vectorYfor speciesiandj(i.e., in this case the val-ues of species is simulated under a given process - see above), with average y, and wij are the elements of the
weighting matrixWwith the pairwise phylogenetic rela-tionship between species. Here the matrixWwas replaced by the phylogenetic covariance (matrixC). We also esti-mated Moran’s I in the first class of a phylogenetic correlogram, by using a binary weighting matrixW, with values of one indicating pairs of species that are separated by less than 12 million years (about 0.8 of phylogenetic cor-relation) (see Diniz-Filho, 2001; see also Diniz-Filhoet al.
2009 for details of the phylogeny).
The second metric was given by the coefficient of de-termination (R2) estimated by the Cheverud et al.(1985) autoregressive model (ARM), which can be written as
Y=rWY+e.
whereris an autoregressive coefficient estimated by maxi-mum likelihood, W is the weighting matrix (as defined above, and equals to covariance among speciesVhere in this application), andeare the model residuals.
The third metric was based on the coefficient of deter-mination (R2) derived from a multiple regression model called Phylogenetic eigenVector Regression (PVR; Diniz-Filhoet al., 1998; see Desdeviseset al., 2003; Kuhnet al., 2009; Staggemeieret al., 2010; Diniz-Filhoet al., 2011 and Safi and Pettorelli, 2010 for recent applications and expan-sions). The PVR model is given byY=Xb+e, wherebis a vector with regression coefficients,Xis a matrix with k
Legendre, 2010). For PVR, we usedk= 90 eigenvectors which explained 95% of the variability in the phylogenetic distance matrix (D) because of computational constraints. Diniz-Filho et al. (2012a) showed that, under Brownian motion, the amount of variation explained by PVR (the co-efficient of determination R2) must be correlated to the amount of variation explained by the eigenvectors. Because here we are using the same set of eigenvectors for all com-parisons, theR2can be directly comparable among simula-tions and can be correlated with other metrics. Thus, the coefficients of determination (R2) of both models (ARM and PVR) were used to quantify the amount of phylogen-etic signal in the simulated data sets for the so-called “parti-tion methods”.
The other two metrics we used to quantify phylogen-etic signal explicitly assume a Brownian motion model of trait evolution as a reference for estimating the phylogen-etic signal. Thus, the first “model-based” statistic was the (Pagel, 1999)l, which is equal to 0 when the trait is evolv-ing independently of the phylogeny, while a value of 1.0 in-dicates that the trait under study is evolving according to Brownian motion. Details on how to estimate Pagel’slcan be found in Freckletonet al.(2002). Blomberget al.(2003)
Kwas the second model-based metric used in this study. Values ofK-statistics lower than 1.0 indicate that related species resemble each other less than expected under the Brownian motion model of trait evolution, while values greater than 1.0 signify that more related species are more similar, for the trait under study, than predicted by this model. BecauseKhas a right-skewed distribution (see re-sults), we used a logarithmic transformation (base 10) to normalize this metric, so that the neutral expectation (i.e., evolution under Brownian motion) can be inferred when
K= zero.
The final dataset used for analyses was then com-prised by the 200 simulated values of the five metrics (Moran’sI,R2ARM,R2PVR,landK). A stochastic variation
in the magnitude of phylogenetic signal is expected under Brownian motion, so that the convergence among the met-rics can be evaluated in terms of the amount of phylogen-etic structure observed in each simulation. We used Spearman’s rank correlation to measure to level of associa-tion between pairs of metrics because it is robust against outliers and can also measure nonlinear relationships. We also calculated correlation among mean estimates of phylo-genetic signal among the different methods when increas-inglya-parameter along O-U simulations.
Moran’sIcoefficients, ARM’s and PVR’s R2were calculated with the use of a software written in the Basic and Delphi programming languages, available from the au-thors upon request.Kandlwere calculated by using the packagepicante(Kembelet al., 2010) andgeiger(Harmon
et al., 2008) respectively, both implemented in the R soft-ware environment (R Development Core Team, 2009).
Results
Pagel’slwas equal to 1.0 in 97% of the simulations performed, thus revealing high statistical power and ability to correctly detect Brownian motion. However, this metric was not sensitive to stochastic variation in species values generated under Brownian motion and disturbing the mag-nitude of phylogenetic signals, being not correlated with the other metrics.
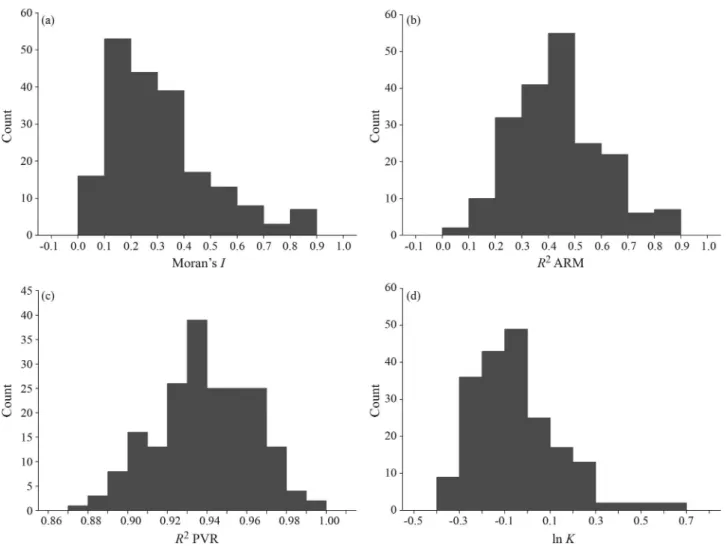
Moran’sIvaried between 0.03 and 0.89, with a mean of 0.31± 0.19, with a slightly right-skewed distribution (median = 0.27) (Figure 1a). TheR2from ARM also varied widely (Figure 1b), ranging from 0.07 to 0.89 (mean = 0.43±0.17), whereas values ofR2from PVR (Figure 1c) were higher (mean = 0.94 ± 0.02) and varied much less (0.88 and 0.99) than those estimated from ARM. Compara-tively, the distributions of bothR2tended to be more sym-metric (Figure 1).K-statistics varied from 0.41 to 4.44, with a mean of 0.99 (as expected under Brownian motion), but the values were strongly right-skewed, and this remained even after logarithm transformation (Figure 1d).
Under Brownian motion, all metrics (Moran’sI,R2
from PVR and ARM andK-statistics) were highly corre-lated to each other, with Spearman correlation higher than 0.70 (Table 1). The lowest correlation (rS= 0.728) was
be-tween Moran’s I and PVR’s R2. Because Moran’s I and ARM’s and PVR’sR2are all empirical (statistical) metrics and K-statistics was explicitly designed to work under Brownian motion, we show the relationships betweenK -statistics and each one of these metrics in Figure 2. In general, as indicated by the Spearman’s correlations, these empirical metrics were clearly associated toK, but the rela-tionships were curvilinear.
Increasing the value of thea-parameter in the O-U process caused, as expected, a monotonic decrease in all metrics (all Spearman’s correlation among metrics higher than 0.95), and thus the mean phylogenetic signals esti-mated using different methods are also strongly correlated across simulations, with decreasing signal when increasing O-U parameter (Table 2). However, the rate of decrease varied among them. Forl, the best indicator of deviation from Brownian motion was not the mean, but the frequency with whichldiffered from 1.0. For PVR, even when signal was nearly absent, the mean R2 was still very high (0.724±0.048). However, these coefficients of determina-tion were usually not significant due to the small degrees of freedom left after using 90 eigenvectors. Thus, the adjusted
R2, ranging from 0.027 (a= 10) to 0.785 (a= 0), provided a more standardized metrics for the decrease in phylogenetic signal.
Discussion
non-linearly, associated to each other. Thus, criticisms to some of these metrics, including PVR and ARM (e.g., Rohlf, 2001), although referring to more detailed behavior of these methods under specific evolutionary processes, do not invalidate results of empirical analyses if phylogenetic structures are well defined and distance/weighting matrices reflect evolutionary dynamics and expectations for trait variation among taxa, as done here.
High Moran’sI coefficients and R2 values derived from PVR and ARM are consistent with the expected struc-ture in data generated under Brownian motion process, in which closely related species will tend to be similar and this similarity decreases with phylogenetic distance (see Han-sen and Martins, 1996). However, on average, both global Moran’sIandR2from ARM were low, indicating that these metrics have a low statistical power in detecting signal, by considering the wide range of values observed under Brownian motion (which is expected to generate strong and linear relationship between species divergence and time, especially with large,i.e.,n> 50, sample sizes). Note that we estimated a single (global) Moran’sIstatistics, instead of a phylogenetic correlogram composed by several Mo-ran’sI(see Gittleman and Kot, 1990; Diniz-Filho, 2001), so that it was directly comparable with the other metrics. Be-cause of random process at larger phylogenetic distances, global Moran’s I cannot be so high, even under Brownian motion. However, Moran’sIin the first distance class was closer to 1.0 under Brownian motion and also decreased
Figure 1- Frequency distributions of metrics measuring phylogenetic signal in a trait evolving under a Brownian motion model (a - Moran’sI; b -R2from an Autoregressive Model; c -R2from a Phylogenetic Eigenvector Regression; d - Blomberget al., 2003K-statistics). All metrics were derived from 200 simulations of a Brownian motion model of trait evolution.
Table 1- Spearman correlations under Brownian motion (below diagonal) among estimates of phylogenetic signals, when using different metrics, such asR2from PVR and ARM, Moran’sIautocorrelation coefficient (global, MORAN), Moran’s I for the first distance class (MORAN(1) and Blomberg’sKstatistics, at log-scale.
PVR ARM MORAN MORAN(1) K
PVR 1.000
ARM 0.796 1.000
MORAN 0.728 0.816 1.000
MORAN(1) 0.438 0.557 0.431 1.000
with the increase of thea-parameter in the O-U process, al-though at a much lower rate (because, even under strong O-U, similarity between closely related taxa persists - see Hansen and Martins, 1996). Thus, using only first distance class is more effective in taking into account more com-plex, non-linear, models of evolution. Also, Moran’sI co-efficients tend to be more independent of errors in the phylogeny in general, being only affected by errors at a par-ticular distance class (see Diniz-Filho and Nabout, 2009).
On the other hand, coefficients of determination de-rived from PVR were usually very high and close to 1.0 un-der Brownian motion (see Diniz-Filhoet al., 2012b). More importantly, they were highly correlated withK-statistics, so PVR can be considered a powerful way to estimate the relative amount of phylogenetic signal. Rohlf (2001) criti-cized PVR as producing a trivial result when all eigen-vectors are used to fully represent the phylogeny. Indeed, when all eigenvectors are used, a trivialR2 of 1.0 is ob-tained. Thus, although all eigenvectors are indeed neces-sary to fully summarize the original phylogenetic distance matrix (as in any Principal Coordinate Analysis), our re-sults indicate that not all of them are necessary to correctly estimate phylogenetic signal. Also, it is important to re-member that a phylogenetic distance matrix is not
error-free and, therefore, some of the (residual) variation in this matrix, summarized by eigenvectors associated to very low (absolute) eigenvalues can be discarded (as in any multi-variate analysis). In terms of scaling, we realize that using the adjustedR2offers a more appropriate range of values, being closer to zero under strong O-U processes that mini-mizes phylogenetic structure in data.
The main advantage of the model-based approaches, such asK-statistics or l, is that they provide a reference value for departure from Brownian motion, whereas the pure statistical methods only indicate whether a small or large amount of signal is present in data. Even so, the simi-larity among the metrics suggests that they all must be someway related to this evolutionary model and thus must be calibrated according to neutral expectations. Indeed, Diniz-Filho (2001) showed that, under Brownian motion, phylogenetic correlograms were better described by a lin-ear model (i.e., large positive Moran’sIcoefficients in the first distance classes, followed by non-significant cients and afterward by negative and significant coeffi-cients at high phylogenetic distances). Here there is also a conspicuous change in the correlogram profile and the elimination of the phylogenetic signal with the increase of the alpha parameter (which controls the strength of
stabiliz-Figure 2- Bivariate relationships between Blomberget al.(2003)K-statistics and global Moran’sI(a),R2from an Autoregressive Model (b) and from a Phylogenetic Eigenvector Regression (c).
Table 2- Results from the alternative metrics for phylogenetic signals analyzed here, includingR2from PVR and ARM, Moran’sIautocorrelation coeffi-cient (global and in the first phylogenetic distance class), Blomberg’sKstatistics and Pagel’s lambda, under the Ornstein-Uhlenbeck (O-U) process, with distinct levels of restraining forces (alphas). Freq for lambda is the frequency with which values lower than 1.0 appeared in the 200 simulations.
O-U alpha PVR ARM MORAN K Lambda
Mean sd R2adj Mean sd Mean sd 1st class Mean sd Mean sd Freq
0 0.939 0.024 0.785 0.431 0.166 0.312 0.193 0.796 0.994 0.585 1.000 0.009 0.030
2 0.894 0.034 0.626 0.307 0.148 0.216 0.142 0.663 0.571 0.178 0.999 0.016 0.050
4 0.857 0.032 0.496 0.195 0.099 0.131 0.085 0.558 0.392 0.092 0.999 0.004 0.135
6 0.804 0.038 0.309 0.133 0.074 0.091 0.063 0.459 0.301 0.055 0.994 0.016 0.270
8 0.760 0.039 0.154 0.084 0.059 0.062 0.052 0.382 0.245 0.037 0.976 0.038 0.585
ing selection) of the O-U process. This reference value for O-U is not available, however, for global Moran’sI coeffi-cients, and also not for coefficients of determination from PVR and ARM.
However, the distribution of Moran’sIand PVR’sR2
under Brownian motion obtained here can give some clues on the expected values under Brownian motion. If Moran’s
Iis interpreted as a ratio between evolutionary covariance and total variance of a trait, it should be inversely related to phylogenetic species variability (PSV) (Helmus et al., 2007), which is actually the denominator of theK-statistics of Blomberget al.(2003). For the phylogeny used here, the PSV was equal to 0.781, whose complement (1 - PSV) is then equal to 0.219 and thus close to median Moran’sI
(= 0.278) from the simulations. This value of PSV indicates that, due to the shape of the tree, a trait evolving under Brownian motion would not attain a strong phylogenetic signal, if measured by ratios of variances. Notice thatK -sta-tistics takes this possibility of different expectation due to shape of the phylogeny into account by dividing the ob-served by expected (under Brownian motion) ratio of vari-ances.
For the PVR’sR2the interpretation of Brownian mo-tion expectamo-tion is even more obvious after the compari-sons between metrics (i.e., PVR’sR2andK), and follows the reasoning of Rohlf (2001)for criticizing the PVR. If all eigenvectors are needed to describe the full structure of the phylogeny, and if using them will produce (by definition) anR2equal to 1.0, then not using all of them would produce a drop in the R2 proportional to the importance of the eigenvalues not used. Thus, if the eigenvectors used ex-plain 95%, this value would be the expectedR2if a trait is evolving linearly along the phylogeny. Indeed, the meanR2
from PVR was equal to 0.94, and it is possible to observe in Figure 2c that this value corresponds to aK-statistics close to zero (see Diniz-Filhoet al., 2012b).
Notice that all these comparisons between PVR, ARM and Moran’sIwithK-statistics were performed using simulated data on the same phylogeny, and thus the denom-inator ofK-statistics is constant throughout the compari-sons. Thus, the quantity being compared is actually the ratio between observed and phylogenetic mean squares, the “absolute” magnitude of the phylogenetic effect in data (see Blomberget al., 2003). Further comparisons in which several phylogenies are used are still necessary, and in this case both the magnitude of the phylogenetic effect and the shape of the phylogeny (the denominator ofK-statistics) would be taken into account.
Therefore, criticisms about these methods should be re-examined by considering the phylogenetic relationships used (e.g.Pavoineet al., 2007). Further analyses address-ing more complex scenarios, includaddress-ing different tree shapes, sample sizes and evolutionary models, can validate their robustness and better establish their statistical power under more variable situations. Also, now that theoretical
issues require the measurement of phylogenetic signal as deviations (both positive and negative) from neutral expec-tation of species divergence modeled by Brownian motion (e.g., Cooperet al., 2010), it should be important to derive neutral (not null) expectation for these statistics. However, our analyses reveal that old metrics based on auto-correlation analyses may still be valid and useful especially when detailed phylogenies are unavailable or when trait variation among species is difficult to describe by more standard Brownian or O-U evolutionary models.
Acknowledgments
We thank Leandro Duarte and an anonymous re-viewer for suggestions that improved earlier versions of the manuscript. Work by JAFDF, LMB and TFR has been con-tinuously supported by many fellowships from the Brazil-ian Agency CNPq. Work by TS is supported by a CAPES doctoral fellowship.
References
Bininda-Emonds ORP, Cardillo M, Jones KE, MacPhee RDE, Beck RMD, Grenyer R, Price SA, Vos RA, Gittleman JL and Purvis A (2008) The delayed rise of present-day mam-mals. Nature 456:274.
Blomberg SP and Garland Jr T (2002) Tempo and model in evolu-tion: Phylogenetic inertia, adaptation and comparative methods. J Evol Biol 15:899-910.
Blomberg SP, Garland T and Ives AR (2003) Testing for phylo-genetic signal in comparative data: Behavioral traits are more labile. Evolution 57:717-745.
Cheverud JM, Dow MM and Leutenegger W (1985) The quantita-tive assessment of phylogenetic constraints in comparaquantita-tive analyses - Sexual dimorphism in body-weight among pri-mates. Evolution 39:1335-1351.
Cooper N, Jetz W and Freckleton RP (2010) Phylogenetic com-parative approaches for studying niche conservatism. J Evol Biol 23:2529-2539.
Desdevises Y, Legendre P, Azouzi L and Morand S (2003) Quan-tifying phylogenetically structured environmental variation. Evolution 57:2647-2652.
Diniz-Filho JAF (2001) Phylogenetic autocorrelation under dis-tinct evolutionary processes. Evolution 55:1104-1109. Diniz-Filho JAF and Torres NM (2002) Phylogenetic
compara-tive methods and the geographic range size - Body size rela-tionship in new world terrestrial Carnivora. Evol Ecol 16:351-367.
Diniz-Filho JAF, Sant’Ana CER and Bini LM (1998) An eigen-vector method for estimating phylogenetic inertia. Evolu-tion 52:1247-1262.
Diniz-Filho JAF and Nabout JC (2009) Modeling body size evo-lution in Felidae under alternative phylogenetic hypotheses. Genet Mol Biol 32:170-176.
Diniz-Filho JAF, Terribile LC, Da Cruz MJR and Vieira LCG (2010) Hidden patterns of phylogenetic non-stationarity overwhelm comparative analyses of niche conservatism and divergence. Glob Ecol Biogeogr 19:916-926.
Diniz-Filho JAF, Cianciaruso MV, Rangel TF and Bini LM (2011) Eigenvector estimating of phylogenetic and func-tional diversity. Funct Ecol 25:735-744.
Diniz-Filho JAF, Bini LM, Rangel TF, Morales-Castilla I, Ol-lala-Tarraga MA, Rodríguez MA and Hawkins BA (2012a) On the selection of phylogenetic eigenvectors for ecological analyses. Ecography 35:239-249.
Diniz-Filho JAF, Rangel TF, Santos T and Bini LM (2012b) Ex-ploring patterns of interspecific variation in quantitative traits using sequential phylogenetic eigenvector regression. Evolution 66:1079-1090.
Felsenstein J (1985) Phylogenies and the comparative method. Am Nat 125:1-15.
Felsenstein J (1988) Phylogenies and quantitative characters. Annu Rev Ecol Syst 19:445-471.
Freckleton RP, Harvey PH and Pagel M (2002) Phylogenetic analysis and comparative data: A test and review of evi-dence. Am Nat 160:712-726.
Garland T, Dickerman AW, Janis CM and Jones JA (1993) Phylo-genetic analysis of covariance by computer-simulation. Syst Biol 42:265-292.
Gittleman JL and Kot M (1990) Adaptation: Statistics and a null model for estimating phylogenetic effects. Syst Zool 39:227-241.
Hansen TF and Martins EP (1996) Translating between micro-evolutionary process and macromicro-evolutionary patterns: The correlation structure of interspecific data. Evolution 50:1404-1417.
Hansen TF, Piennar J and Orzack SH (2008) A comparative method for studying adaptation to a randomly evolving en-vironment. Evolution 62:1965-1977.
Harmon LJ, Weir J, Brock CD, Glor RE and Challenger W (2008) GEIGER: Investigating evolutionary radiations. Bioinfor-matics 24:129-131.
Helmus MR, Bland TJ, Williams CK and Ives AR (2007) Phylo-genetic measures of biodiversity. Am Nat 169:E68-E83. Hof C, Rahbek C and Araújo MB (2010) Phylogenetic signals in
the climatic niches of the world’s amphibians. Ecography 33:242-250.
Kembel SW, Cowan PD, Helmus MR, Cornwell WK, Morlon H, Ackerly DD, Blomberg SP and Webb CO (2010) Picante: R tools for integrating phylogenies and ecology. Bioinfor-matics 26:1463-1464.
Kuhn I, Nobis MP and Durka W (2009) Combining spatial and phylogenetic eigenvector filtering in trait analysis. Glob Ecol Biogeogr 18:745-758.
Losos JB (2008) Phylogenetic niche conservatism, phylogenetic signal and the relationship between phylogenetic relatedness and ecological similarity among species. Ecol Lett 11:995-1003.
Martins EP (1996) Phylogenies, spatial autoregression and the comparative method: A computer simulation test. Evolution 50:1750-1765.
Martins EP (2000) Adaptation and the comparative method. Trends Ecol Evol 15:296-299.
Martins EP and Garland T (1991) Phylogenetic analyses of the correlated evolution of continuous characters: A simulation study. Evolution 45:534-557.
Martins EP, Diniz JAF and Housworth EA (2002) Adaptive con-straints and the phylogenetic comparative method: A com-puter simulation test. Evolution 56:1-13.
Pagel M (1999) Inferring the historical patterns of biological evo-lution. Nature 401:877-84.
Pavoine S, Ollier S, Pontier D and Chessel D (2007) Testing for phylogenetic signal in phenotypic traits: New matrices of phylogenetic proximities. Theor Pop Biol 73:79-91. Peres-Neto PR (2006) A unified strategy for estimating and
con-trolling spatial, temporal and phylogenetic autocorrelation in ecological models. Oecologia Brasiliensis 10:105-119. Peres-Neto PR and Legendre P (2010) Estimating and controlling
for spatial autocorrelation in the study of ecological commu-nities. Glob Ecol Biogeogr 19:174-184.
Revell LJ, Harmon LJ and Collar DC (2008) Phylogenetic signal, evolutionary process, and rate. Syst Biol 57:591-601. Rohlf FJ (2001) Comparative methods for the analysis of
continu-ous variables: Geometric interpretations. Evolution 55:2143-2160.
Safi K and Pettorelli N (2010) Phylogenetic, spatial and environ-mental components of extinction risk in carnivores. Glob Ecol Biogeogr 19:352-362.
Staggemeier VG, Diniz-Filho JAF and Morellato LPC (2010) The shared influence of ecology and phylogeny on the reproduc-tive patterns of Myrtaea (Myrtaceae). J Ecol 98:1409-1421.
Associate Editor: Antonio Matteo Solé-Cava