Dispersal Patterns of the Red Swamp Crayfish
Procambarus Clarkii
in China
Yanhe Li1,2, Xianwu Guo3, Xiaojuan Cao1, Wei Deng1, Wei Luo1, Weimin Wang1*
1College of Fisheries, Key Laboratory of Agricultural Animal Genetics, Breeding and Reproduction of Ministry of Education, Huazhong Agricultural University, Wuhan, People’s Republic of China,2Institute of Fisheries, Anhui Academy of Agricultural Sciences, Hefei, People’s Republic of China,3Laboratorio de Biomedicina Molecular, Centro de Biotecnologı´a Geno´mica, Instituto Polite´cnico Nacional, Boulevard del Maestro esquina Elı´as Pin˜a, Colonia Narciso Mendoza, Tamaulipas, Mexico
Abstract
The red swamp crayfish (Procambarus clarkii) was introduced to China in the early 20thcentury. It has been spread to almost all forms of fresh water bodies including lakes, rivers and even paddyfields in most provinces of China. To clarify issues such as the initial entry point(s), dispersal pattern, genetic diversity and genetic structure ofProcambarus clarkiiin China, the genetic structure and diversity ofP. clarkiipopulations at 37 sampling sites (35 from China, one from the USA and one from Japan) were analyzed using both mitochondrial gene sequences (COI and 16S rRNA) and 12 nuclear microsatellites. Multiple tests including phylogenetic analyses, Bayesian assignment and analysis of isolation by distance showed that (i) the population from Japan and those collected from China, particularly from NanJing (BGt and XG) and its some neighboring sites (CJr, NT and NB), have similar genetic composition, (ii) relatively high genetic diversity was detected in Chinese populations, (iii) theP. clarkiipopulations in China did not experience significant population expansions. Taken together, Nanjing, Jiangsu province is the presumed initial entry point, and human-mediated dispersal and adaptive variation are likely responsible for the observed genetic pattern ofP. clarkiiin China.
Citation:Li Y, Guo X, Cao X, Deng W, Luo W, et al. (2012) Population Genetic Structure and Post-Establishment Dispersal Patterns of the Red Swamp Crayfish Procambarus Clarkiiin China. PLoS ONE 7(7): e40652. doi:10.1371/journal.pone.0040652
Editor:Zhanjiang Liu, Auburn University, United States of America
ReceivedApril 11, 2012;AcceptedJune 11, 2012;PublishedJuly 10, 2012
Copyright:ß2012 Li et al. This is an open-access article distributed under the terms of the Creative Commons Attribution License, which permits unrestricted use, distribution, and reproduction in any medium, provided the original author and source are credited.
Funding:This study is a component of the Aquafish-ACRSP (Aquaculture Collaborative Research Support Program), supported by the US Agency for International Development (USAID). The funders had no role in study design, data collcetion and analysis,decision to publish,or preparation of the manuscript.
Competing Interests:The authors have declared that no competing interests exist.
* E-mail: [email protected]
Introduction
Successful biological invasions require that non-indigenous species pass through a series of filtering stages including transport, release, population establishment, and in many cases, dispersal. A successful invader is characterized by a number of biological and ecological features for its dispersal and establishment in a new habitat [1]. The red swamp crayfish (Procambarus clarkii), native to south central USA and northeastern Mexico, is one of the most notorious invasive species in the world [2,3]. Compared to some invasive animals such as insects, the natural dispersal capacity ofP. clarkiiis relatively weak [4]. However, anthropogenic activities are considered to play a crucial role in translocation of the red swamp crayfish [5]. Furthermore, high fecundity, short development time and flexible feeding habits provide this species a high adaptability to various ecosystems. A well documented example of rapid expansion is the dispersal of this crayfish in the southern Portugal and Mediterranean wetlands [4,6]. Since this crayfish was introduced into two aquaculture installations located in Sevilla and Badajoz in Spain [7] in 1973, it has become a widespread species throughout southern Portugal, the Mediterranean wetlands and some other places in Europe only for three decades [4,6,8].
P. clarkiiwas introduced to Nanjing, China from Japan in 1929 [9]. Nowadays this species has been found in almost all forms of fresh water bodies including lakes, rivers and even paddyfields in most provinces of China [10]. Because of its high commercial
value [10],P. clarkiiaquaculture has been developed rapidly, and this species has become one of the most important aquatic products in China [11]. Presently, much attention is being paid to technologies of culture, reproduction and breeding of this species, but less attention is being given to its invasions and related ecological and ecological effects, let alone the invasion genetics of P. clarkii. In general, the red swamp crayfish threatens local biodiversity in freshwater ecosystems, and their burrows result in dam damages and a huge loss of irrigation water, causing significant economic loss [12,13]. In addition, P. clarkii is considered as an important pest of wet-seeded rice (Oryza sativa) fields [14].
Information on the population structure changes would help to understand the biological invasions of this alien species, and in some cases, would be useful for the establishment of possible methodologies for prevention and control of its invasions [15]. A study of the species population structure and genetic diversity would provide valuable data to clarify issues such as the initial entry point(s) and dispersal pattern ofP. clarkii in China. A few articles have touched upon these topics to date [5,9,10], however, no systematic genetic data from microsatellite loci and mitochon-drial DNA sequences have yet been generated to address such issues.
diversity, which would likely facilitate its invasion success to some extent, (ii) whether Nanjing was the initial point of entry of P. clarkiiin China, (iii) whether the introduction ofP. clarkiiin China was derived from a single or multiple event(s). Here we used both mitochondrial gene sequences (COI and 16S rRNA) and 12 nuclear microsatellites to clarify dispersal pattern, genetic diversity and genetic structure ofProcambarus clarkiiin China.
Results
Genetic Diversity
The number of alleles ranged from three to 27 across all 12 microsatellite loci in 37 populations (N= 1776). The mean observed heterozygosity (Ho), the mean expected heterozygosity (He), and the polymorphism information content (PIC) were 0.6723, 0.7913 and 0.7551, respectively. The Lo (Louisiana) and Sa (Saitama) population exhibited the highest genetic diversity among the 37 populations, while the ZX population showed the lowest (Table S1). All theP. clarkiipopulations in China showed relatively high genetic diversity: number of alleles (Na) = 6.4–11.8, and expected heterozygosity (He) = 0.7002–0.8214. Deviations from HWE were observed at multiple loci in multiple populations. Most of the deviated cases showed significant heterozygote deficiency.
Of the 313 individuals examined using the COI gene, the nucleotide diversity was 0.0022. Only six haplotypes (GenBank accession numbers: JX120103-JX120108) were found. There were some base substitutions but no insertion or deletion was found. Twelve parsimony informative sites and three singleton variable sites were detected (Figure S1A). The haplotype diversity of the partial COI sequence (Hd) was 0.403. The variance and the standard deviation of haplotype diversity was 0.00072 and 0.027, respectively. Under the Maximum Composite Likelihood model, the overall mean pairwise genetic distance of the six haplotypes was 0.011. Most individuals (231/313) had Hap_C2, which was mainly distributed among the P. clarkii populations collected in China and Japan. The haplotypes Hap_C3, Hap_C4, Hap_C5 and Hap_C6 were only detected in the population collected in the USA (Figure S2A).
Based on the data of partial 16S rRNA sequences (284 individuals), the nucleotide diversity was 0.00083. Only three haplotypes (GenBank accession numbers: JX120109- JX120111) were found. Two parsimony informative sites and one base deletion were detected (Figure S1B). The haplotype diversity (Hd) was 0.390, while the variance of haplotype diversity was 0.00077 and its standard deviation was 0.028. Under the Maximum Composite Likelihood model, the overall mean pairwise genetic distance of the three haplotypes was 0.003. Seventy-five percent of the examined individuals (212/284) had Hap_S2, which was mainly distributed among the populations collected in China and Japan. The Hap_S3 was only detected in the population collected from the USA, whereas the Hap_S1 was shared among in the populations collected in China, Japan and the USA (Figure S2B).
Analyses of Population Structure and Assignment Tests Based on the microsatellite genotype data, the Nei’s genetic distance (0.145) between the populations XYw and XYc was the lowest, while the Nei’s genetic distance (0.999) between the populations ZX and Sa was the highest. The gene flow parameter among populations ranged from 1.284 between the populations DY and PYL to 10.595 between the populations XYw and XYc. The gene flow between the populations XYw and XYc occurred very frequently and its parameter value was far greater than those among other populations (range from 1.284 to 6.968). The
coefficient of genetic differentiation (Fst) in 37 populations ofP. clarkiiranged from 0.023 between the populations XYw and XYc to 0.157 between the populations DY and YJ, NX (details not presented).
The neighbour-joining tree consisted of two major clades. One major clade included the populations ofP. clarkiicollected in Japan and the USA (Lo and Sa), and some Chinese populations. The other big clade included all the remaining P. clarkiipopulations collected in China (Figure 1).
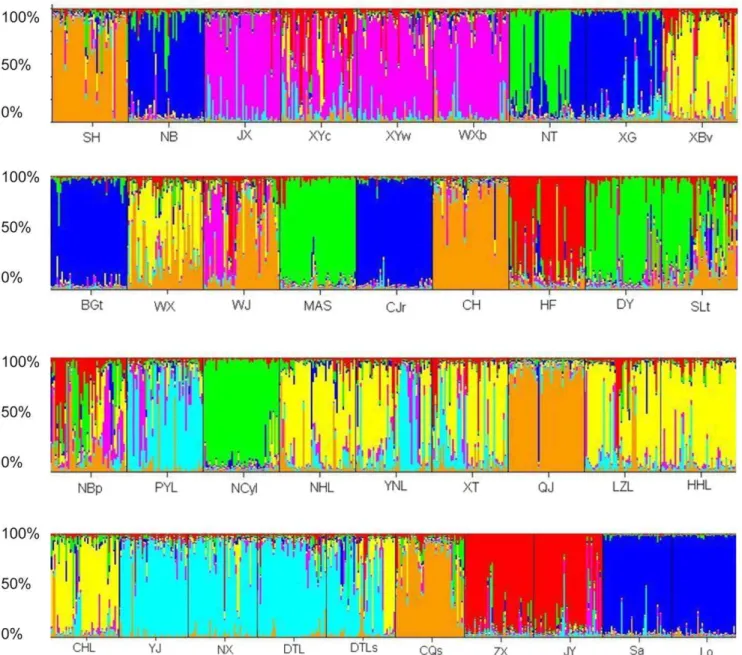
Genetic clustering analysis using Structure program [16,17] indicated that the number of genetic clusters was seven (K= 7; Figure 2). Most individuals from four Chinese populations (XG, BGt, NB and CJr) and two foreign populations (Sa and Lo) were assigned to the same genetic cluster, suggesting that they might share the same origin (represented by dark blue in Fig. 2), while some individuals of sampling sites in China tended to be more admixed (such as XYc, WX, WJ, HF, SLT, Fig. 2).
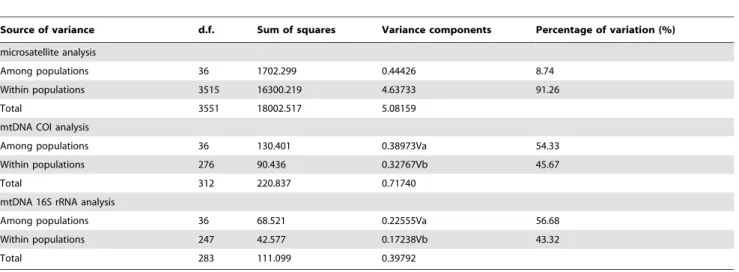
Population Differentiation and Spatial Genetic Structure The Analysis of molecular variance (AMOVA) of microsatellite genotype data revealed that 91.26% of genetic variation could be explained by the variation within populations, whereas the remaining (8.74%) came from variation among populations (Table 1). However, the AMOVA of mitochondrial COI sequences analysis revealed that 45.67% of genetic variation could be explained by the variation within populations, whereas the remaining (54.33%) came from variation among populations. Meanwhile, the AMOVA of mitochondrial 16S rRNA sequences analysis revealed that 43.32% of genetic variation could be explained by the variation within populations, whereas the remaining (56.68%) came from variation among populations.
Regressions of genetic distances against geographical distances were not significant (Mantel test: microsatellite genotype, r = 0.052, P= 0.710; mitochondrial COI sequences, r = 0.036, P= 0.688; mitochondrial 16S rRNA sequences, r = 0.043, P= 0.631). Thus, the crayfish in China did not show isolation by distance.
Analyses of Population Expansion
The detection of population expansion was performed usingFu andLi’sTests. The positiveFsvalues were 1.861 (P = 0.256.0.05), derived from mitochondrial COI sequences analysis and 0.860 (P = 0.567.0.05) from mitochondrial 16S rRNA sequences analysis, indicating that the P. clarkii did not significantly experience the population expansion.
Discussion
populations were not significantly correlated with geographic distances forP. clarkiipopulations. Collectively, human mediated-dispersal, especially aquaculture transfers, could be responsible for the observed genetic patterns. Dispersal of aquatic exotic species in nature ecological systems has often been influenced by human mediated vectors [18,19,20], especially in fresh water ecological systems [15,21]. AsP. clarkiiis an economic aquaculture species in China, frequent aquaculture-related transfers could mediate dispersal among different locations [9]. Thus the population genetic structure presented here likely resulted from a combination of natural expansion and human-mediated jump dispersal.
Human activities such as commercial shipping or unintentional carry have probably facilitated communication among populations ofP. clarkii, and have influenced their population genetic structure and diversity [9].
Presumable Initial Entry Points
It has been reported that red swamp crayfish were introduced to Nanjing, China from Japan in 1929 [9,22]. Our data showed that P. clarkii populations collected around Nanjing have a closer relationship with the Japanese one, and that Nanjing was probably the initial entry point of introduction ofP. clarkii. First, the data on
Figure 1. Sampling locations ofP. clarkiiand their populations cluster analysis.Red solid dots on the maps indicated the sampling locations. The blue line in China maps denoted the Changjiang River. XY includes XYw and XYc population. NJ includes XG, BGt and XBv population. WX includes WX and WXb populations. What the sampling location codes in the figure indicated sees Table S1.
doi:10.1371/journal.pone.0040652.g001
Figure 2. Structure version 2.3.1 analysis ofP. clarkiipopulations using microsatellite genotype data from twelve microsatellite loci (the inferred clusters, K = 7).The sampling location codes (see Table S1) are indicated along the X-axis. Each vertical line represents one individual, and Y-coordinate denotes each individual’s percentage assignment to each of these seven genetic clusters.
haplotype frequency showed that Hap_C1 and Hap_C2 were mainly distributed amongP. clarkiipopulations collected in China and Japan, but Hap_C3, Hap_C4, Hap_C5 and Hap_C6 were only detected in P. clarkii population in the USA (Figure S1A, S2A). Similarly, Hap_S1 and Hap_S2 were mainly distributed among P. clarkiipopulations collected in China and Japan while the haplotype 3 (Hap_S3) was only detected in the P. clarkii population in the USA (Figure S1B, S2B). Second, microsatellite data showed that the population from Baguazhou township, Nanjing, had the highest genetic diversity among the populations analyzed in China (Table S1). Third, the phylogenetic tree showed that populations in NanJing (BGt and XG), or around Nanjing (CJr, NT and NB,), were clustered first with the foreign populations ((Figure 1, Figure S3). Fourth, the Bayesian assign-ment also indicated that most individuals from populations in Nanjing or around Nanjing (XG, BGt, NB and CJr) and foreign populations (Sa and Lo) were assigned to the same genetic cluster (Figure 2). Therefore, the results of this study further demonstrated thatP. clarkiiwere introduced from Japan, Nanjing was probably the intial place of introduction ofP. clarkii, and suburbs of Nanjing (such as Xiaguan District and Baguazhou township) were the presumable initial entry points. And then, they started dispersing in the vicinity of Jiangsu province and along the Changjiang river basin. Nevertheless, of course more genetic data from source area need to be collected for investigating the initial entry point forP. clarkiiinvasion.
Single or Multiple Introductions?
It is believed thatP. clarkiimay have been introduced only once from Japan to Nanjing in 1929 [9,22]. However, our genetic analyses supported that P. clarkii was likely introduced from multiple events. So, we speculated that unobserved multiple introduction events or cryptic invasions might exist.
The high diversity of invasive species population could be caused by multiple introductions from one or more places [23,24], or a single introduction of a large number of individuals from different populations [24,25]. However, the genetic diversity of invasive species populations was lower than that of the origin population after experiencing bottleneck and founder effect if the invaders were introduced only once from origin place [26,27]. If the invasion species were derived from multiple introductions,
their population genetic diversity would not necessarily be lower than that of the origin place. This is because multiple introductions could help the invasive population to maintain enough variations, even new genotypes occurring which are owed to inbreeding among populations derived from reproductive isolation in the origin place [28,29]. For example, the genetic diversity and heritable phenotypic variation of the exotic grass, Phalaris arundinacea, in North America were higher than those in the place of origin in Europe [30]. In this study, theP. clarkiipopulations in China generally showed high genetic diversity. However, it was found that even if Baguazhou township, Nanjing, showed the highest allelic and gene diversity among the populations investi-gated in China by analysis of microsatellites, mitochondrial COI and 16S rRNA sequences. Thus, some unobserved multiple introduction events and cryptic invasions could not be excluded, although some documents reported thatP. clarkiimay have been introduced only once from Japan. As the Bayesian assignment showed, surprisingly, that populations NB, XG, BGt and CJr, and two more populations from Japan and the USA, were clustered together with extremely high membership coefficients. However, the other populations from China were grouped into another six genetic clusters. If Nanjing was the only initial entry point and only one introduction event occurred in the 1920s, all or almost all genetic variation should be detected in the area surrounding Nanjing. Here, there might be two explanations for the results of assignment: (i) multiple introductions which might generate divergent invasive populations [19], and/or other unintentional introductions in China might exist; (ii) this species might have experienced rapid evolutionary and/or genetic changes [20] associated with novel environments and/or aquaculture breeding.
High Genetic Diversity and the Implications for Invasion Success
Some exotic invasions succeed despite founder effects, and consequent low genetic diversity was often due to the invasive populations experiencing bottlenecks and genetic drift [31]. However, the P. clarkii populations in China had very high diversity as shown in the present study. Other studies onP. clarkii in China have also showed similar results [5,10]. Moreover, similar cases of high diversity and structure of introduced populations in Europe have been documented [23].
Table 1.Analysis of molecular variance within and amongP. clarkiipopulations by microsatellite, mtDNA COI and 16S rRNA analysis.
Source of variance d.f. Sum of squares Variance components Percentage of variation (%)
microsatellite analysis
Among populations 36 1702.299 0.44426 8.74
Within populations 3515 16300.219 4.63733 91.26
Total 3551 18002.517 5.08159
mtDNA COI analysis
Among populations 36 130.401 0.38973Va 54.33
Within populations 276 90.436 0.32767Vb 45.67
Total 312 220.837 0.71740
mtDNA 16S rRNA analysis
Among populations 36 68.521 0.22555Va 56.68
Within populations 247 42.577 0.17238Vb 43.32
Total 283 111.099 0.39792
Generally, the idea that increased genetic diversity contributes to invasion success presupposes that evolution enhances invasions, and bottlenecks during invasion limit the adaptive evolution of fitness-related traits [32]. Evolutionary biologists postulated that genetic variation and evolution might play an important role in the success of invading species [33]. However, the high genetic diversity of invasive species may be caused by hybridization and variation after successfully invading a new environment [30]. Some studies have shown that putatively adaptive traits have evolved in introduced populations, and sometimes quite rapidly [34,35]. A hypothesis of increased genetic diversity with some successful invaders putatively retaining adaptive variation is not necessarily inconsistent with the presence of genetic bottlenecks; this is because founding events were not only to be expected to eliminate all variation, but also because many fitness-related traits do not lose variation as quickly as do individual loci [32,36]. In this study, AMOVA showed that a lot of genetic variation occurred among and within theP. clarkiipopulations (Table 1).
Multiple introductions or donors can rescue invaders from losses in diversity [32]. Intra-specific admixture from multiple native source regions could help introduced populations overcome founder effects and generate novel genetic substrates for selection in introduced ranges [37,38]. In some cases, admixture from multiple sources has been shown to lead to significant variation in morphology and life-history traits between introduced populations, with potentially important implications for invasion success [38,39]. Some novel differentiation could arise even in the case where it seems highly unlikely that it favored the genetic diversity of the species which has a potential global distribution [1].
In conclusion, theP. clarkiifounder population in China might have been derived from Japan.P. clarkiipopulations in China have relatively high genetic diversity. Numerous factors likely facilitated invasion success of P. clarkii, such as high genetic diversity, adaptive variation, aquaculture activity and some ecological factors, and the absence of predators in China.
Materials and Methods
Sampling, DNA Isolation and Microsatellite Genotyping We focused on the alleged initial places of introduction, and areas of major cultivation and major river basins whereP. clarkii were distributed in China. A total of 35 sites were selected from China and one site each from the USA and Japan (Figure 1, Table S1). The sites in China are located in an open, abandoned field and no specific permit is required for the described field studies. The sites from Japan and the USA were kindly provided by Dr. Jian Gao from the Kagoshima University and Dr. Dan Wang from the Ohio State University South Centers.
Muscle cuts of 48 individuals were sampled at each site and were stored in 95% ethanol at 220uC for DNA extraction. Genomic DNA was isolated using the ammonium acetate method [40], and was stored at220uC for subsequent experiments. Each sample was genotyped using methods as described by Liet al.[40] at 12 microsatellite loci: PcLG-03, PcLG-04, PcLG-07, PcLG-09, PcLG-10, PcLG-13, PcLG-15, PcLG-17, PcLG-29, PcLG-32 and PcLG-48 [41] and PcL24 [3].
Mitochondrial COI and 16S rRNA Amplification
Six to ten DNA samples were randomly selected from each sampling site to amplify the partial mitochondrial COI and 16S rRNA fragments (Table S1). The partial COI gene fragments were amplified using primers LCO 1490 and HCO 2198 [42] under thermocycling conditions: 94uC for 5 min followed by 35 cycles of 94uC for 30 s, 50uC for 45 s and 72uC for 1 min with a final
extension at 72uC for 10 min. The 16S rRNA fragments were amplified with the primers 1471 and 1472 [43], and the thermocycling conditions comprised 35 cycles of 30 s at 94uC, 1 min at 48uC and 1 min at 72uC. PCR products were directly sent to Invitrogen Biotech (Shanghai, China) Co., Ltd or Sangon Biotech (Shanghai, China) Co., Ltd. for sequencing.
Data Analysis
Based on microsatellite data, the number of alleles (Na), number of effective alleles (Ne), the observed heterozygosity (HO) and the
expected heterozygosity (He) were calculated using the program POPGENE version 1.31 [44]. Deviations from Hardy-Weinberg Equilibrium (HWE) using Markov chain reaction were performed by Genepop 4.0.10 [45,46]. To analyze clusters of 37 P. clakii populations, the Neighbour-Joining and UPGMA dendrograms for populations based on the Nei’s genetic distance matrix were constructed using the software MEGA 5.05 [47].
Structure version 2.3.1 [15,48] was used to assign individuals to populations by a Bayesian approach using microsatellite genotype data, with the power to acknowledge that a sample site does not necessarily represent a true genetic population. Structure 2.3.1 was run using the correlated allele frequencies model with a burn-in period of 100,000 MCMC (Markov Chain Monte Carlo) steps followed by 1,000,000 iterations, with eight independent runs conducted to assess the consistency of the results across runs. All iterations were run with the admixture model, using a Bayesian approach with prior distributions of model parameters. Bayesian methods assume that observations are randomly drawn from each cluster and that all potential source populations are predefined [49]. We used an ad hoc method for estimating the number of genetic clusters [16,17]. ARLEQUIN v3.5.1.2 [50] was applied for analysis of molecular variance (AMOVA). Ratios of the variance components could be then used to define population structure.
Correlation between genetic distance and geographic distance was assessed using IBDWS version 3.21 [51]. Significance of the analysis was examined using Mantel tests as implanted in software IBDWS.
Moreover, based on mitochondrial COI and 16S rRNA sequences, the variation sites, parsimony informative sites, number of haplotype, and nucleotide diversity were determined by using the soft DnaSP 5.10 [52]. The neutral test (Fu’Fsand Li’s tests) was also considered by DnaSP 5.10. Analysis of molecular variance (AMOVA) was conducted in ARLEQUIN v3.5.1.2 to calculate the variance components and significance levels of variation within a population and among populations. Relationships among mtDNA COI and 16S rRNA haplotypes were examined respectively using a statistical parsimony haplotype network generated at the 95% connection limit with TCS version 1.21 [53].
Supporting Information
Figure S1 One sequence of haplotypes and distribution of all haplotypes obtained from mtDNA COI and 16S rRNA sequences.
(PDF)
Figure S2 Statistical parsimony networks of mtDNA COI (A) and 16S rRNA (B) sequences for P. clarkii
samples. (PDF)
Figure S3 UPGMA dendrogram of 37P. clarkii
popula-tions based on Nei’s (1972) genetic distance (D).
Table S1 List of the populations of P. clarkii studied
indicating the location, their country of origin, geo-graphical position of sampling sites, genetic diversity at 12 microsatellite loci, and haplotype diversity at mtDNA COI and 16S rRNA sequences.
(PDF)
Acknowledgments
We thank Dr. Jian Gao from the Kagoshima University, and Dr. Dan Wang from the Ohio State University South Centers, for kindly providing samples from Japan and the USA; Prof. Lizhi Zhou and his student
Lingliang Cao, from the School of Life Science, Anhui University, for assistance to data analyses; and many friends who are not listed in detail here for helping collect samples and offering some technical assistance. Prof. Peter Edwards from the Asian Institute Technology, Thailand commented on early versions of the manuscript.
Author Contributions
Conceived and designed the experiments: YL XC WW. Performed the experiments: YL WD WL. Analyzed the data: YL XG WD. Contributed reagents/materials/analysis tools: YL XG WW. Wrote the paper: YL XG WW.
References
1. Larson ER, Olden JD (2012) Using avater species to model the potential distribution of emerging invaders. Global Ecology and Biogeography DOI: 10.1111/j.1466-8238.2012.00758.x.
2. Huner JV (1988) Procambarus in North America and elsewhere. In: Freshwater Crayfish: Biology, Management and Exploitation (eds Holdich, D. M., R. S. Lowery), Timber Press, Portland, Oregon. 239–261.
3. Zhu ZY, Yue GH (2008) Eleven polymorphic microsatellites isolated from red swamp crayfish,Procambarus clarkii. Molecular Ecology Resources 8: 796–798. 4. Geiger W, Alcorlo P, Baltana´s A, Montes C (2005) Impact of an introduced
Crustacean on the trophic webs of Mediterranean wetlands. Biological Invasions 7: 49–73.
5. Cao LL, Zhou LZ, Zhang BW (2010) Genetic patterns of invasiveProcambarus clarkii population in the three river basins of Anhui Province. Biodiversity Science 18: 398–407.
6. Adao H, Marques JC (1993) Population biology of the red swamp crayfish Procambarus clarkii(Girard 1852) in southern Portugal. Crustaceana 63: 336–345. 7. Habsburgo-Lorena AS (1983) Socioeconomic aspects of the crawfish industry in
Spain. Freshwater Crayfish 5: 552–554.
8. Arrignon JC, Ge9rard P, Krier A, Laurent PJ (1999) The situation in Belgium, France and Luxembourg. In: Crayfish in Europe as Alien Species. How to Make the Best of a Bad Situation? (eds Gherardi, F., D. M. Holdich), A. A. Balkema, Rotterdam, The Netherlands. 129–140.
9. Yue GH, Li J, Bai Z, Wang CM, Feng F (2010) Genetic diversity and population structure of the invasive alien red swamp crayfish. Biological Invasions 12: 2697– 2706.
10. Wang CZ, Li Z, Liang HW, Hu GF, Wu QC, et al. (2009) Genetic diversity in fourProcambarus clarkiipopulations in the lower reaches of the Yangtze River. Biodiversity Science 17: 518–523.
11. Bi K, Gu W, Wang W (2008) Sensitive and rapid detection of freshwater crustacean Spiroplasmas by ISRs-sequence-targeted species-specific primers. European Food Research and Technology 227: 1733–1737.
12. Li SC, Xu YX, Du LQ, Yi XL, Men XD, et al. (2005) Investigation on and analysis of alien invasions in Chinese farming industry. Chinese Agricultural Science Bulletin 21: 156–159.
13. Li ZY, Xie Y (2002) Invasive alien species in China. Forestry Press, Beijing. 14. Anastacio PM, Parente VS, Correia AM (2005) Crayfish effects on seeds and
seedlings: identification and quantification of damage. Freshwater Biology 50: 697–704.
15. Zhan A, Perepelizin PV, Ghabooli S, Paolucci E, Sylvester F, et al. (2012) Scale-dependent post-establishment spread and genetic diversity in an invading mollusk in South America. Biodiversity and Distributions DOI: 10.1111/j.1472-4642.2012.00894.x.
16. Pritchard JK, Stephens M, Donnelly P (2000) Inference of population structure using multilocus genotype data. Genetics 155: 945–959.
17. Evanno G, Regnaut S, Goudet J (2005) Detecting the number of clusters of individuals using the software STRUCTURE: a simulation study. Molecular Ecology 14: 2611–2620.
18. Zhan A, Darling JA, Bock D G, Lacoursie`re-Roussel A, MacIsaac HJ, Cristescu M E (2012) Complex genetic patterns in closely related colonizing invasive species. Ecology and Evolution doi: 10.1002/ece3.258.
19. Roman J, Darling JA (2007) Paradox lost: genetic diversity and the success of aquatic invasions. Trends in Ecology and Evolution 22: 454–464.
20. Zhan A, MacIsaac HJ, Cristescu ME (2010) Invasion genetics of theCiona intestinalisspecies complex: from regional endemism to global homogeneity. Molecular Ecology 19: 4678–4694.
21. Maria JC, Rebelo R (2007) Colonization of freshwater habitats by an introduced crayfish,Procambarus clarkii, in Southwest Iberian Peninsula. Hydrobiologia 575: 191–201.
22. Li JL, Dong ZG, Li YS, Wang CH (2007) Invasive aquatic species in China. Shanghai Science and Technology Publisher, Shanghai.
23. Barbaresi S, Fani R, Gherardi F, Mengoni A, Souty-Grosset C (2003) Genetic variability of European populations of an invasive American crayfish: preliminary results. Biological Invasions 5: 269–274.
24. Barbaresi S, Gherardi F, Mengoni A, Souty-Grosset C (2007) Genetics and invasion biology in fresh waters: a pilot study ofProcambarus clarkiiin Europe. In:
Biological Invaders in Inland Waters: Profile, Distribution and Threats (ed. Gherardi F). 381–400.
25. Herborg LM, Weetman D, Oosterhout C, Ha¨nfling B (2007) Genetic population structure and contemporary dispersal patterns of a recent European invader, the Chinese mitten crab,Eriocheir sinensis. Molecular Ecology 16: 231–242. 26. Amsellem L, Noyer JL, Le Bourgeois T, Hossaert-McKey M (2000) Comparison
of genetic diversity of the invasive weedRubus alceifolius Poir. (Rosaceae) in its native range and in areas of introduction, using amplified fragment length polymorphism (AFLP) markers. Molecular Ecology 9: 443–455.
27. Dlugosch KM, Parker IM (2008a) Invading populations of an ornamental shrub show rapid life history evolution despite genetic bottlenecks. Ecology Letters 11: 701–709.
28. Maron JL, Vila` M, Bommarco R, Elmendorf S, Beardsley P (2004) Rapid evolution of an invasive plant. Ecological Monographs 74: 261–280. 29. Keller SR, Taylor DR (2008) History, chance and adaptation during biological
invasion: separating stochastic phenotypic evolution from response to selection. Ecology Letters 11: 852–866.
30. Lavergne S, Molofsky J (2007) Increased genetic variation and evolutionary potential drive the success of an invasive grass. Proceedings of the National Academy of Sciences 104: 3883–3888.
31. Friar EA, Ladoux TA, Roalson EH, Robichaux RH (2000) Microsatellite analysis of a population crash and bottleneck in the Mauna Kea silverword, Argyroxiphium sandwicense ssp.Sandwicense(Asteraceae), and its implications for reintroduction. Molecular Ecology 9: 2027–2034.
32. Dlugosch KM, Parker IM (2008b) Founding events in species invasions: genetic variation, adaptive evolution, and the role of multiple introductions. Molecular Ecology 17: 431–449.
33. Mayr E (1965) The nature of colonizations in birds. In: The Genetics of Colonizing Species (eds Baker HG, Stebbins GL), Academic Press, London. 29– 43.
34. Huey RB, Gilchrist GW, Carlson ML, Berrigan D, Serra L (2000) Rapid evolution of a geographic cline in size in an introduced fly. Science 287: 308– 309.
35. Reznick DN, Ghalambor CK (2001) The population ecology of contemporary adaptations: what empirical studies reveal about the conditions that promote adaptive evolution. Genetica 112: 183–198.
36. Nei M, Maruyama T, Chakraborty R (1975) The bottleneck effect and genetic variability in populations. Evolution 29: 1–10.
37. Vellend M, Harmon LJ, Lockwood JL, Mayfield MM, Hughes AR, et al. (2007) Effects of exotic species on evolutionary diversification. Trends in Ecology & Evolution 22: 481–488.
38. Darling JA, Bagley MJ, Roman J, Tepolt CK, Geller JB (2008) Genetic patterns across multiple introductions of the globally invasive crab genus Carcinus. Molecular Ecology 17: 4992–5007.
39. Kolbe JJ, Larson A, Losos JB (2007) Differential admixture shapes morpholog-ical variation among invasive populations of the lizardAnolis sagrei. Molecular Ecology 16: 1579–1591.
40. Li YH, Wang WM, Liu XL, Luo W, Zhang J, et al. (2011) DNA extraction from crayfish exoskeleton. Indian Journal of Experimental Biology 49: 953–957. 41. Belfiore NM, May B (2000) Variable microsatellite loci in red swamp crayfish,
Procambarus clarkii, and their characterization in other crayfish taxa. Molecular Ecology 9: 2231–2234.
42. Folmer OM, Black M, Hoeh R, Lutz R, Vrijehoek R (1994) DNA primers for amplication of mitochondrial cytochrome c oxidase subunit I from diverse metazoan invertebrates. Molecular Marine Biology and Biotechnology 5: 304– 313.
43. Crandall KA, Lawler SH, Austin CM (1995) A preliminary examination of the molecular phylogenetic relationships of some crayfish genera from Australia (Decapoda: Parastacidae). Freshwater Crayfish 10: 18–30.
44. Yeh FC, Yang RC, Boyle T (1999) POPGENE version 1.31, Microsoft window-bases freeware for population genetic analysis, University of Alberta and the Centre for International Forestry Research, http://www.ualberta.ca/˜fyeh/. 45. Raymond M, Rousset F (1995) GENEPOP (version 1.2): population genetics
software for exact tests and ecumenicism. Journal of Heredity 86: 248–249. 46. Rousset F (2008) Genepop’007: a complete reimplementation of the Genepop
47. Tamura K, Peterson D, Peterson N, Stecher G, Ne M, et al. (2011) MEGA5: Molecular Evolutionary Genetics Analysis using Maximum Likelihood, Evolutionary Distance, and Maximum Parsimony Methods. Molecular Biology and Evolution 28: 2731–2739.
48. Hubisz M, Falush D, Stephens M, Pritchard J (2009) Inferring weak population structure with the assistance of sample group information. Molecular Ecology Resources 9: 1322–1332.
49. Manel S, Gaggiotti OE, Waples RS (2005) Assignment methods: matching biological questions with appropriate techniques. Trends in Ecology & Evolution 20: 136–142.
50. Excoffier L, Laval G, Schneider S (2005) Arlequin ver. 3.0: An integrated software package for population genetics data analysis. Evolutionary Bioinfor-matics Online 1: 47–50.
51. Jensen JL, Bohonak AJ, Kelley ST (2005) Isolation by distance. BMC Genetics 6: 13. v.3.21 http://ibdws.sdsu.edu/.
52. Librado P, Rozas J (2009) DnaSP v5: A software for comprehensive analysis of DNA polymorphism data. Bioinformatics 25: 1451–1452.