A Work Project, presented as part of the requirements for the Award of a Masters Degree in Management from the NOVA – School of Business and Economics.
OVERCONFIDENCE & CAREER DEVELOPMENT
EVIDENCE FROM AN ONLINE EXPERIMENT
JULIUS HOLSCHNEIDER #3038
A Project carried out on the
Behavioral Decision Making course, under the supervision of: Prof. Luis F. Martinez
2
Abstract
This paper studies the influence of work-experience and professionalism on general overconfidence. An online experiment has been conducted to compare the level of overconfidence between 5 different subject groups of a total sample of 270 individuals from 35 different countries. Socioeconomic control variables have been used to better clarify the unique influence of experience on the overconfidence level. The findings of this quantitative study suggest that even high levels of work experience do not significantly reduce overconfidence. This generates some major implications and tasks for businesses and organizations to be able to reduce the most damaging of existing heuristics.
3
Introduction
Self-confidence is a crucial tool to be successful at the job, in sports or in life in general. It helps to be perceived by others as competent, attractive and successful. Individuals in high positions at the job or in politics would probably not be in such a position if they had a lack of confidence in their own abilities. People may not vote for a politician who appears not confident and thus, unsecure. However, behavioral economists and psychologists show that overconfidence is far more common than underconfidence, a natural human bias that leads to overestimations of
one’s own abilities (De Bondt & Thaler, 1995). Overconfidence has been blamed as most damaging
heuristic, leading to speculative bubbles, decision failures, bankruptcies and even wars (Johnson & Fowler, 2011). The role of work experience and its influence on overconfidence in the financial world has been heavily discussed (Korniotis & Kumar, 2011; Menkhoff et al., 2013; Deaves et al., 2010). This paper aims on finding a broader view by examining the influence of work-experience on general overconfidence, which is explicitly not connected with task-related experiences. Does increasing work-experience lead to lower levels of overconfidence in terms of a better self-estimation or are people that are more advanced in their career automatically in an even higher extent overconfident, also in job-unrelated tasks? Besides this question, it will be studied if higher levels of confidence lead to better decision making or not. Thus, eventually positive effects of confidence can be quantified.
4
correlation and regression analysis serve as statistical tools. Based on these results, major findings will be discussed, experimental limitations will be pointed out and an outlook for possible future research will be provided.
Theoretical Framework & Literature Review
Overconfidence – Definition & General Overview
5
accuracy) from the average confidence (Cesarini et al., 2009). This method has also been used in this study.
Overconfidence in Business & Organizations
6
Furthermore, CEO overconfidence leads to irresponsibly higher leverage in company’s capital structures and is, as consequence, reason for several bankruptcies (Antoncyk & Salzmann, 2014).
Influencing factors on Overconfidence – The Role of Experience
7
question if work-experience, independently from a specific area, is able to reduce general overconfidence or not. Thus, the following hypothesis will be tested.
Hypothesis 1: A higher level of work-experience/professionalism is reducing general (over)-confidence
Socioeconomic control variables, such as gender differences, are used in the experiment to be more able to determine the unique influence of work experience. The area in which people are working has not been taken into account on purpose to bring results on a general, overall valid level.
Confidence is often described as helpful trait for success and performance. Some researchers even state that overconfidence can be positive and leads to higher personal success as it is able to increase morals and ambitions, as well as credibility (Johnson & Fowler, 2011). Thus, it will also be tested if higher confidence levels will lead to a better quality of decisions, a higher proportion of correct answers in this specific experiment. Therefore, the following hypothesis will be tested as well:
Hypothesis 2: Higher confidence levels lead to better decision making and more correct answers.
Experimental Design
8 Tversky (1992).
I collected a sample with subjects that have different levels of work-experience to test the influence of that factor on general overconfidence. The online experiment has been conducted by people from different countries, with a different age structure and different levels of education. I mainly used my own personal network to distribute the questionnaire. For that reason, answers are mainly concentrated on subjects with German or Portuguese nationality. I mainly used social media, especially Facebook, as distribution channel to achieve a high number of participants quickly. The data has been collected within November and December 2016. Participants with different levels of work experience could been reached which has been a crucial contribution for the overall findings of the research purpose. The survey was build up on the online survey platform Qualtrics and set up completely in English. I used this online method to be able to gather more data and to get answers from different countries in a convenient time. The general knowledge questionnaire consists of questions from different areas, such as sports, history, geography, science and biology. Thus, I tried to avoid that subjects which possibly work in a certain area will have
advantages and achieve “better” results in terms of a better self-estimation. Hansson et al. (2008)
point out that task related experience has a significant influence on the level of confidence/overconfidence. Therefore, the mentioned bias could be avoided without the need of asking participants about their profession.
9
guessing the answer, the subject is statistically in 50% of the cases right, which explains the range of the scale. A chosen confidence level of 60% indicates that the participant thinks that the chance of having chosen the correct answer between the 2 possibilities is with a chance of 6/10 correct. To avoid confusion, the procedure has been explained to all participants. Furthermore, the survey program forced participants to only be able to choose one possible level of confidence which is the closest to their subjective self-estimation. The general knowledge questions were designed as partly very tricky to stimulate overconfidence within the participants and therefore make as consequence differences between the subject groups more clear. Some questions may be perceived as more difficult for certain participants than for others, regarding their different educational background or their general interests, as well as their different areas of work experience. However, the proportion of correct answers was anyway only used to calculate the level of overconfidence, not to determine the general knowledge of people. I calculated for each participant his individual level of overconfidence by subtracting the average level of confidence from the proportion of correct answers. Thus, the bias score of each participant could be determined. Nevertheless, as research shows that more difficult tasks are more likely subject to overconfidence than easy tasks (Griffin & Tversky, 1992) that may even be subject to under-confidence, I tried to find questions that were not straight forward and not easy to answer to avoid possible underconfidence. The questions were designed by myself, adapted from experiments with similar structures, except of one question (Q14, cf. appendix) which has been adopted due to its, in my opinion, high quality (Atanasov, 2012; Arkes et al., 1987).
10
were presented. There was no time limit to answer the questions. In the following you find two exemplary questions that were asked in the survey:
1. How many countries were founding members of the OECD?
A) 10 B) 20
Confidence: 50% 60% 70% 80% 90% 100%
2. Which country has the higher absolute GDP?
A) Russia B) Japan
Confidence: 50% 60% 70% 80% 90% 100%
All 15 questions are listed in Appendix A. In the examples above, the correct answers have been marked bold. For instance, the first question aimed to generate associations within people to connect the amount of founding members automatically with the lower number and thus, create extensive overconfidence. As Russia is by far larger than Japan, the purpose was to guide people towards the wrong answer, thinking that Russia has due to its bigger size also a higher GDP.
Method
Descriptive Statistics
11
subject groups regarding their level of work experience: No work experience, less than 3 years, 3 to 7 years, 8 to 15 years, and more than 15 years.
Variables
To test the first hypothesis, Work Experience states the independent variable testing the influence on general (Over)-Confidence that is indicating the dependent variable. In the second hypothesis, the variable Confidence is the independent variable for the dependent variable Accuracy (the proportion of correct answers). Participants were further asked to provide information regarding their Gender, Age, their Highest Achieved Degree and their Nationality. These factors were used as control variables to test possible impacts on the level of overconfidence and accuracy and furthermore, to better see the unique influence of work-experience. For instance, a higher achieved degree may also influence the level of self-estimation (Bhandari & Deaves, 2006). People with a PhD degree may be more confident in their own knowledge or, on the other way around, be able to estimate more accurately their knowledge level. Cross-cultural differences have a huge impact on the level of overconfidence in the area of finance (Antonczyk & Salzmann, 2014) and also on general overconfidence (Burns & Luo, 2006) where significant differences exist for instance between the western culture and the East-Asian culture (Yates et al., 1998).
Furthermore, gender and age may influence overconfidence in both directions, as research shows (Bruine de Bruin et al., 2012; Bengtsson et al., 2005; Pliske & Mutter, 1996).
Results
Calibration Curves
12
method used in overconfidence-experiments (Griffin & Tversky, 1992). The curves show a graphical comparison between the different subject groups that are clustered regarding every
individual’s level of work-experience. However, as the graphs are not sufficient to confirm or reject
13
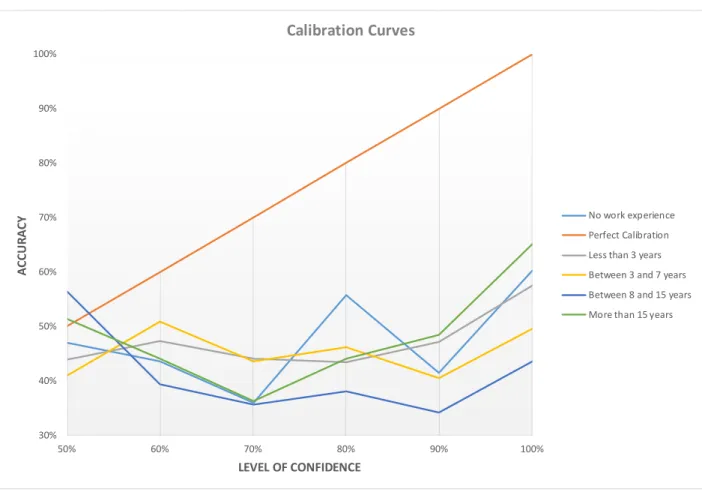
Figure 1. CALIBRATION CURVES OF THE SUBJECT GROUPS
The calibration curves in Figure 1 above clearly show that all different subject groups are consequently overconfident along all indicated levels of confidence, except on the 50% confidence
level where the “between-8-and-15-years-experience” group and the “more-than-15
years-experience” group were slightly underconfident. This could give first hints to support the
hypothesis that work-experience has the power to reduce general overconfidence. The outcome of the calibration curves makes it difficult to determine a clear ranking of overconfidence within the different subject groups. The “more-than-15-years-experience” group had the most accurate self-estimation in the 90% or 100% confidence level area, which could give hints for supporting the first hypothesis. However, in the 70% confidence level region, the “more-than-15-years-experience group” had one of the worst calibrated values. Taking out the “more-than-15-years-experience
30% 40% 50% 60% 70% 80% 90% 100%
50% 60% 70% 80% 90% 100%
A
C
C
U
R
A
C
Y
LEVEL OF CONFIDENCE
Calibration Curves
14
group” from the 90% and 100% confidence level area would create a clear ranking of increasing miscalibration with higher levels of work experience. It can also be seen that the bias score is in average the highest at the 80% and 90% indicated confidence levels. The following table shows the average values for each subject group:
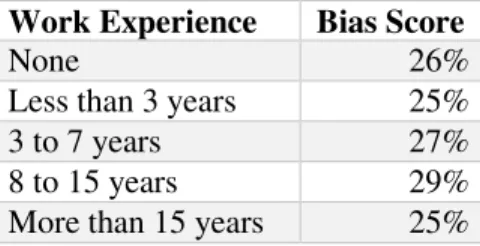
Table 1. AVERAGE BIAS SCORE FOR THE SUBJECT GROUPS
Work Experience Bias Score
None 26%
Less than 3 years 25%
3 to 7 years 27%
8 to 15 years 29%
More than 15 years 25%
Table 1 indicates that the “more-than-15-years-experience” group and the “less -than-3-years-experience” group have on average the most accurate calibration. The worst calibration has the 8-to-15-years-experience group. However, as a clear hierarchy cannot be determined so far, further statistical analysis has been conducted.
Correlation
15
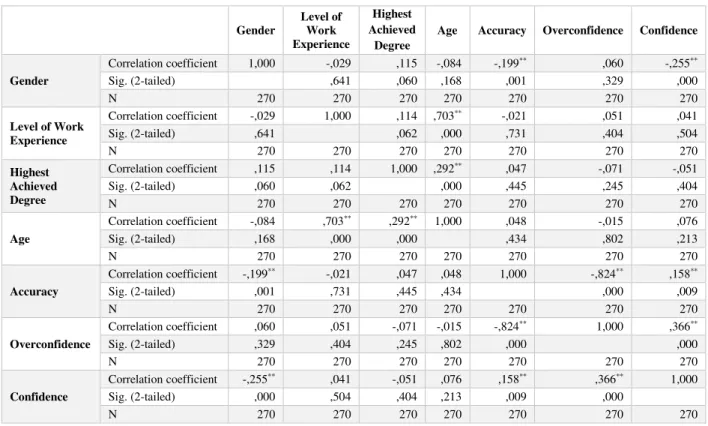
answers wrong and lower levels of confidence (Sig. = 0.000). The level of overconfidence on the other side does not change significantly with gender. Furthermore, confidence is significantly positive correlated with the accuracy variable, confirming the second hypothesis that high confidence leads to better decision making and therefore to higher level of success and specifically to more correct answers in my experiment.
Table 2. CORRELATION
Gender Level of Work Experience Highest Achieved Degree
Age Accuracy Overconfidence Confidence
Gender
Correlation coefficient 1,000 -,029 ,115 -,084 -,199** ,060 -,255** Sig. (2-tailed) ,641 ,060 ,168 ,001 ,329 ,000
N 270 270 270 270 270 270 270
Level of Work Experience
Correlation coefficient -,029 1,000 ,114 ,703** -,021 ,051 ,041 Sig. (2-tailed) ,641 ,062 ,000 ,731 ,404 ,504
N 270 270 270 270 270 270 270
Highest Achieved Degree
Correlation coefficient ,115 ,114 1,000 ,292** ,047 -,071 -,051 Sig. (2-tailed) ,060 ,062 ,000 ,445 ,245 ,404
N 270 270 270 270 270 270 270
Age
Correlation coefficient -,084 ,703** ,292** 1,000 ,048 -,015 ,076 Sig. (2-tailed) ,168 ,000 ,000 ,434 ,802 ,213
N 270 270 270 270 270 270 270
Accuracy
Correlation coefficient -,199** -,021 ,047 ,048 1,000 -,824** ,158** Sig. (2-tailed) ,001 ,731 ,445 ,434 ,000 ,009
N 270 270 270 270 270 270 270
Overconfidence
Correlation coefficient ,060 ,051 -,071 -,015 -,824** 1,000 ,366** Sig. (2-tailed) ,329 ,404 ,245 ,802 ,000 ,000
N 270 270 270 270 270 270 270
Confidence
Correlation coefficient -,255** ,041 -,051 ,076 ,158** ,366** 1,000 Sig. (2-tailed) ,000 ,504 ,404 ,213 ,009 ,000
N 270 270 270 270 270 270 270
** highly significant on the 0.01 level (2-tailed)
Regression Analysis
16
control variables before introducing the “main” independent variable. Thus, the influence of this variable can be more clearly determined and observed on a “stand-alone-basis”. To avoid multicollinearity, the independent control variable age has not been used for the regression, as it is highly correlated with work experience and thus, would not bring any additional value to the statistical analysis. Furthermore, the control variable nationality has not been used as well. Taking a deeper look into the descriptive statistics shows that the number of participants is highly concentrated in Germany and Portugal. To be able to focus on cross-cultural differences a higher number of participants with different cultural backgrounds would have been needed. To run the regressions in SPSS, I recoded the control variables via dummy variables as they are all used as categorical variables. This leads also to a better understanding of the influence of each sub-variable.
Work Experience on Confidence Regression
17
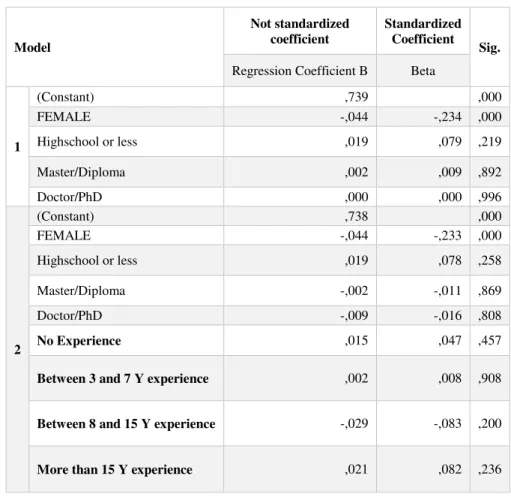
Table 3. MULTIPLE HIERARCHICAL REGRESSION – WORK EXPERIENCE ON CONFIDENCE
Table 4. MODEL SUMMARY – WORK EXPERIENCE ON CONFIDENCE REGRESSION
Model R-Square Change in R-Square
Sig. Change in
F
1 ,063 ,063 ,002
2 ,079 ,016 ,326
Confidence on Accuracy Regression
Running this regression, it can be again observed that the socioeconomic control variables have already a significant impact, this time on the dependent variable accuracy. This effect comes mainly from gender differences. The female dummy variable has a statistically significant (Sig. =
Model
Not standardized coefficient
Standardized Coefficient
Sig.
Regression Coefficient B Beta
1
(Constant) ,739 ,000
FEMALE -,044 -,234 ,000
Highschool or less ,019 ,079 ,219
Master/Diploma ,002 ,009 ,892
Doctor/PhD ,000 ,000 ,996
2
(Constant) ,738 ,000
FEMALE -,044 -,233 ,000
Highschool or less ,019 ,078 ,258
Master/Diploma -,002 -,011 ,869
Doctor/PhD -,009 -,016 ,808
No Experience ,015 ,047 ,457
Between 3 and 7 Y experience ,002 ,008 ,908
Between 8 and 15 Y experience -,029 -,083 ,200
18
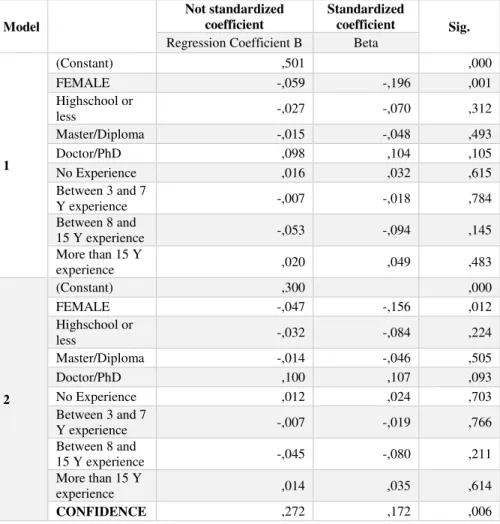
0.001) negative influence (Beta = -0.196) on the accuracy. Adding the “main” independent variable to the model, in this case the level of confidence, makes the model further significant (Sig. = 0.006). All results can be observed in the table below. We can confirm the second hypothesis, emphasizing that higher levels of confidence contribute significantly to a better accuracy and thus lead to better decision making.
Table 5. MULTIPLE HIERARCHICAL REGRESSION – CONFIDENCE ON ACCURACY
Model
Not standardized coefficient
Standardized
coefficient Sig. Regression Coefficient B Beta
1
(Constant) ,501 ,000
FEMALE -,059 -,196 ,001
Highschool or
less -,027 -,070 ,312
Master/Diploma -,015 -,048 ,493
Doctor/PhD ,098 ,104 ,105
No Experience ,016 ,032 ,615
Between 3 and 7
Y experience -,007 -,018 ,784
Between 8 and
15 Y experience -,053 -,094 ,145
More than 15 Y
experience ,020 ,049 ,483
2
(Constant) ,300 ,000
FEMALE -,047 -,156 ,012
Highschool or
less -,032 -,084 ,224
Master/Diploma -,014 -,046 ,505
Doctor/PhD ,100 ,107 ,093
No Experience ,012 ,024 ,703
Between 3 and 7
Y experience -,007 -,019 ,766
Between 8 and
15 Y experience -,045 -,080 ,211
More than 15 Y
experience ,014 ,035 ,614
CONFIDENCE ,272 ,172 ,006
Table 6. MODEL SUMMARY – CONFIDENCE ON ACCURACY REGRESSION
Model R-Square Change in R-Square
Sig. Change in
F
1 ,071 ,071 ,012
19
General Discussion
Implications
20
confidence correlate strongly with better decision making. This suggests that high levels of confidence are important to reach better results not only in knowledge tests but potentially also in tasks of the daily life.
Limitations and Outlook
21
Others may have stopped or not even have started the survey due to language problems. Thus, some participants with minor education may be naturally excluded. Answers could have been collected from a wide range of countries. However, due to my extended network in Germany, most of the participants were German. Thus, valuing the results as generally valid in a cross-cultural context may be difficult. I did not take the work field or the field of study into account. Even though I know, due to my personal connection I have in most of the cases, that people who answered this study have a wide range of different backgrounds, a big group of participants were business students. This fact may also have affected overall results to a certain level.
A major goal of this study was to find overall implications of the influence of work experience and professionalism without focusing on a certain area. For that reason, certain influencing variables, as the area of experience, have been ignored on purpose. However, these influencing variables are partly very significant, as examples in the financial area show. Therefore, a focus on specific aspects that have not been deeply researched yet is an important issue to face in the future. This includes also setting a further focus on fields that are not explicitly part of Economics or Psychology. The field of neurophysiology could be crucial to understand more deeply that heuristic from a medical point of view with implications also on economics. A controlled field experiment instead of the conducted online experiment could help to eliminate undesirable influencing factors.
References
Alicke, M. D., & Govorun, O. (2005). The better-than-average effect. The self in social judgment, 1, 85-106.
22
Arkes, H. R., Christensen, C., Lai, C., & Blumer, C. (1987). Two methods for reducing overconfidence. Organizational Behavior and Human Decision Processes, 39, 133–144. Atanasov, Y. (2012). Managing the effects of overconfidence on strategic decision-making –
comparison between entrepreneurs and managers. University of Amsterdam.
Bengtsson, C., Persson, M., & Willenhag, P. (2005). Gender and overconfidence. Economics Letters, 86(2), 199-203.
Bhandari, G., & Deaves, R. (2006). The demographics of overconfidence. The Journal of Behavioral Finance, 7(1), 5-11.
Black, J. S., & Porter, L. W. (2000). Management: Meeting new challenges. Upper Saddle River, NJ: Prentice Hall.
Buehler, R., Griffin, D., & Ross, M. (1994). Exploring the" planning fallacy": Why people underestimate their task completion times. Journal of personality and social psychology, 67(3), 366.
Burns, B. D., & Luo, L. (2006). Over/Under Confidence: Effects of Culture and Number of Options. Mindmodelling.org.
Bruine de Bruin, W., Parker, A. M., & Fischhoff, B. (2012). Explaining adult age differences in
decision‐making competence. Journal of Behavioral Decision Making, 25(4), 352-360.
Cesarini, D., Lichtenstein, P., Johannesson, M., & Wallace, B. (2009). Heritability of overconfidence. Journal of the European Economic Association, 7(2‐3), 617-627.
Chen, G., Kim, K. A., Nofsinger, J. R., & Rui, O. M. (2007). Trading performance, disposition effect, overconfidence, representativeness bias, and experience of emerging market investors. Journal of Behavioral Decision Making, 20(4), 425-451.
Deaves, R., Lüders, E., & Schröder, M. (2010). The dynamics of overconfidence: Evidence from stock market forecasters. Journal of Economic Behavior & Organization, 75(3), 402-412. De Bondt, W. F., & Thaler, R. H. (1995). Financial decision-making in markets and firms: A
behavioral perspective. Handbooks in operations research and management science, 9, 385-410.
Dorner, D., & Schaub, H. (1994). Errors in planning and decision making and the nature of human information processing. Applied Psychology: An International Review, 43, 433–453. Ebering, A. (2005). Behavioral Economics – Konzepte und Anwendungen. EUL Verlag.
23
Hansson, P., Juslin, P., & Winman, A. (2008). The role of short-term memory capacity and task experience for overconfidence in judgment under uncertainty. Journal of Experimental Psychology: Learning, Memory, and Cognition, 34(5), 1027.
Johnson, D. D., & Fowler, J. H. (2011). The evolution of overconfidence. Nature, 477(7364), 317-320.
Kahneman, D. (2011). Don’t Blink! The Hazards of Confidence. New York Times.
http://www.nytimes.com/2011/10/23/magazine/dont-blink-the-hazards-of-confidence.html?pagewanted=all&_r=2& (last access: 21/12/2016).
Kahneman, D., & Tversky, A. (1982). Variants of uncertainty. Cognition, 11(2), 143-157.
Klayman, J., Soll, J. B., González-Vallejo, C., & Barlas, S. (1999). Overconfidence: It depends on how, what, and whom you ask. Organizational behavior and human decision processes, 79(3), 216-247.
Korniotis, G. M., & Kumar, A. (2011). Do older investors make better investment decisions?. The Review of Economics and Statistics, 93(1), 244-265.
Langer, E. J. (1975). The Illusion of Control. Journal of Personality and Social Psychology, 32, 311-328.
Luthans, F., & Avolio, B. J. (2003). Authentic leadership development. In K. S. Cameron, J. E. Dutton & R. E. Quinn (Eds.). Positive organizational scholarship (pp. 241–258). San Francisco: Berrett-Koehler.
Luthans, F., Luthans, K. W., Hodgetts, R. M. & Luthans, B. C. (2001). Positive approach to leadership (PAL): Implications for today's organizations. The Journal of Leadership Studies, 8, 3–20.
Luthans, F., & Peterson, S. J. (2002). Employee engagement and manager self-efficacy: Implications for managerial effectiveness and development. The Journal of Management Development, 21, 376–387.
Menkhoff, L., Schmeling, M., Schmidt, U., (2013). Overconfidence, experience, and professionalism: An experimental study. Journal of Economic Behavior & Organization, 86, 92 – 101.
Moore, D. A., & Healy, P. J. (2008). The trouble with overconfidence. Psychological review, 115(2), 502.
Pliske, R.M., & Mutter, S.A. (1996). Age differences in the accuracy of confidence judgments. Experimental Aging Research 22, 199–216.
24
Scheinkman, J. A., & Xiong, W. (2003). Overconfidence and speculative bubbles. Journal of political Economy, 111(6), 1183-1220.
Shipman, A. S., & Mumford, M. D. (2011). When confidence is detrimental: Influence of overconfidence on leadership effectiveness. The Leadership Quarterly, 22, 649-665. Simon, M., & Houghton, S. M. (2003). The relationship between overconfidence and the
introduction of risky products: Evidence from a field study. Academy of Management Journal, 46(2), 139-149.
Yates, J.F., Lee, J., Shinotsuka, H., Patalano, A. L., Sieck, W. R., (1998). Cross-Cultural Variations in Probability Judgment Accuracy: Beyond General Knowledge Overconfidence? Organizational Behavior and Human Decision Processes 74(2), 89-117. Zacharakis, A. L., & Shepherd, D. A. (2001). The nature of information and overconfidence on
venture capitalists' decision making. Journal of Business Venturing, 16(4), 311-332.
Appendices
Appendix A
General Knowledge questions of the Online Experiment – Correct answers in bold 1. Which country is larger (in sq. km)?
A) China B) Canada
Confidence: 50% 60% 70% 80% 90% 100%
2. How many countries are founding members of the OECD? A) 10 B) 20
Confidence: 50% 60% 70% 80% 90% 100% 3. Which country has the higher population?
A) Peru B) South Korea
Confidence: 50% 60% 70% 80% 90% 100% 4. Which movie won more Oscars?
A) Forrest Gump B) Slumdog Millionaire
Confidence: 50% 60% 70% 80% 90% 100%
5. Which team won the most titles in the first Spanish football league Primera Division?
A) Real Madrid B) FC Barcelona
25 6. What length has the European river Rhine?
A) 1230 km B) 1580 km
Confidence: 50% 60% 70% 80% 90% 100%
7. Which is the MORE widely spoken language in the world? A) Arabic B) Portuguese
Confidence: 50% 60% 70% 80% 90% 100% 8. What city has a higher population?
A) San Jose B) San Francisco
Confidence. 50% 60% 70% 80% 90% 100% 9. Which fruit has a higher proportion of Vitamin C?
A) Orange B) Strawberry
Confidence. 50% 60% 70% 80% 90% 100% 10.Which country has a higher birth rate?
A) India B) Iraq
Confidence. 50% 60% 70% 80% 90% 100%
11.Which Religion has a higher proportion within the population in India?
A) Christendom B) Buddhism
Confidence: 50% 60% 70% 80% 90% 100% 12.Which is the 5th planet from the sun?
A) Jupiter B) Saturn
Confidence: 50% 60% 70% 80% 90% 100% 13.Which country has the higher absolute GDP?
A) Russia B) Japan
Confidence: 50% 60% 70% 80% 90% 100% 14.Which company is selling more beer?
A) Anheuser-Busch B) Heineken
Confidence: 50% 60% 70% 80% 90% 100%
15.Which American Newspaper is ranked higher by circulation (2016) A) The New York Times B) USA Today