THIS
DOCUMENT
IS
NOT
AN
INVESTMENT
RECOMMENDATION
AND
SHALL
BE
USED
EXCLUSIVELY
FOR
ACADEMIC
PURPOSES
(SEE DISCLOSURES AND DISCLAIMERS AT END OF DOCUMENT)See more information at WWW.NOVASBE.PT Page 1/37
0
M
ASTERS IN
F
INANCE
E
QUITY
R
ESEARCH
Against all odds Portucel survives in an adverse industry
environment. It is unquestionable that Paper consumption is following a
decreasing trend in developed economies. Nevertheless, when looking at
consumption per capita, we understand that demand potential is still
offered in emerging markets.
The sad truth is that European Pulp & Paper manufacturers sin
for heavily relying on developed economy’s demand.
We believe that the geographical shift in sales might be hurtful,
but are also unavoidable in the quest for survival. The NOVA Equity
Research Team estimates that if Portucel increases by about 50% its
exposure to outside Europe sales it would result in a 54% surge in costs,
lowering the Paper segment’s EBITDA margin to 20% from 27%.
We equally stress the fact that additional pressure comes from
the supply side as 4.300 thousand tonnes in Bleached Eucalyptus Pulp
capacity will come into the market until 2013 in Latin America.
As for Paper capacity we remain regarding the Chinese
outrageous supply growth as a key market mover as significant Uncoated
Wood Free Paper capacity is scheduled.
All in all we estimate the Pulp & Paper’s Industry activity to
remain fragile as the world economy does not heal the stains left from
the recent financial crisis. We forecast the Industry to slightly pick up in
2014. Yet, over the long-term we see the supply/demand unbalances to
dictate the future of the industry.
Company Description
Portucel is a leading European pulp and paper manufacturer. It is not
only the European top producer of UWF paper, but also is in the top 10 European producers of BEKH pulp.
Additionally it produces biomass, accounting for 52% of Portugal’s production by this renewable source.
Portucel is quoted in the Lisbon exchange under the symbol PTI PL.
P
ORTUCEL
C
OMPANY
R
EPORT
PULP AND PAPER
4
THJ
UNE2012
S
TUDENT
:
M
ARGARIDA
L
EAL
[email protected]
The survival of the strongest
Pulp and Paper Industry
Recommendation: BUY
Vs Previous Recommendation BUY
Price Target FY12: 2,05 €
Vs Previous Price Target 2.52 €
Price (as of 4-Jun-12) 1,72 €
Bloomberg, 2012
52-week range (€) 2,42-1,68
Market Cap (€m) 1560
Outstanding Shares (m) 768
Source: Company Reports, Company repots
(Values in € millions) 2011 2012E 2013F
Revenues 1.647 1.817 1,756
EBITDA 2.457 2.574 2.663
Net Profit 196 231 209
EPS 0,32 0,44 0,41
Debt Ratio 1,75 1,67 1,68
Non Current Debt 0,61 0,65 0,65
EBITDA Margin 29,3% 26,5% 26,6%
Degree of Operating Leverage 4,37 3,64 3,75
Source:Company Reports, Analyst Estimates, 2012 70%
PORTUCEL COMPANY REPORT
THIS
DOCUMENT
IS
NOT
AN
INVESTMENT
RECOMMENDATION
AND
SHALL
BE
USED
EXCLUSIVELY
FOR
ACADEMIC
PURPOSES
(SEE DISCLOSURES AND DISCLAIMERS AT END OF DOCUMENT)PAGE 2/37
Table of Contents
A CLOSER LOOK AT PORTUCEL
3
The Forestry Segmnent 3
The Pulp Segmnent 4
The Paper Segmnent 5
The Energy Segmnent 5
SHAREHOLDER STRUCTURE
6
THE PULP AND PAPER INDUSTRY
6
The process 7
Industry Sustantability Analysis 12
Shifting to Growth 14
What if Portucel Exports to China? 16
What about growth, afterwards? 17
VALUATION
18
Comparables Analysis 18
DCF 19
Overall Methodology 20
Macroeconomic environment 23
Scenario analysis 24
The Forest and Pulp segment 24
The Paper segment 26
Energy segment 27
Bearish 28
Bullish 29
PORTUCEL COMPANY REPORT
THIS
DOCUMENT
IS
NOT
AN
INVESTMENT
RECOMMENDATION
AND
SHALL
BE
USED
EXCLUSIVELY
FOR
ACADEMIC
PURPOSES
(SEE DISCLOSURES AND DISCLAIMERS AT END OF DOCUMENT)PAGE 3/37
A closer look at Portucel
Portucel is a leading European pulp and paper manufacturer. It is not only the European top producer of Uncoated Woodfree Paper (UWF), 1with a capacity of 1.335 tonnes a year, but also is in the top 10 European producers of Bleached Eucalyptus Kraft pulp (BEKH)2. Additionally, it produces biomass, accounting for 52% of Portugal’s production of this renewable energy source. Portucel is one of the largest Portuguese exporters, exporting € 1.233 million in 2011 which corresponds to 2.9% of the yearly Portuguese export of goods. As some companies operating in the Industry, Portucel runs a vertically integrated business model.
The Forestry Segment
The forestry segment relies on the foundations of Portucel’s Integrated Business model. Indeed, Portucel currently manages 120 thousand hectars of woodlands, corresponding to about 3% of the Portuguese territory. It is reasonable that the main purpose of this business is to serve the manufacturing of pulp: by breeding and growing it’s own plantations Portucel not only directly controls the quality of their materials, having the ability to gentetically modify them, but also manages to avoid, at a certaint extent, the wood market. Indeed, Portucel currently purchases abroad about 10-12% of the wood it requires, and does it at a higher cost than it costs to purchase it domestically. Even though Portucel just in 2011 hired the services of Delloite for ensuring that internal sales have been made at market prices, independent studies prove that historical intersegmental sales were performed at market prices.
In parallel with the breeding of Eucalyptus Globulus and forest management practices, Portucel runs secundary activities withis this segment, such as the production of wine, cork and honey. It turns out that internal sales As a consequence this segment accounts for 5% of the Group’s EBIT.
1
In Europe the second largest UWP manufacturer is Stora Enso with a production capacity of 5,435 million tonnes/year.
2 The top worldwide producer of BEKP is Fibria with a production capacity of 5,245 million tonnes/year . In Europe Portucel is followed by Ence with a
production capacity of 1,340 million tonnes/year.
1.137 1.1271.091
1.3851.488
972 963 928 1.156 1.233
0 200 400 600 800 1.000 1.200 1.400
2007 2008 2009 2010 2011
Graph 1: Portucel Group's
Turnover and Exports
Turnover (million €)
Portucel Soporcel group exports (million €)
Source: Company reports, 2011
External 1%
Internal 99%
Graph 2: Forestry Segment
Sales' sources
Source:PORTUCEL COMPANY REPORT
THIS
DOCUMENT
IS
NOT
AN
INVESTMENT
RECOMMENDATION
AND
SHALL
BE
USED
EXCLUSIVELY
FOR
ACADEMIC
PURPOSES
(SEE DISCLOSURES AND DISCLAIMERS AT END OF DOCUMENT)PAGE 4/37
The Pulp Segment
Initially the core of Portucel’s business, the market pulp business has been accounting for a decreasing share of Portucel’s earnings. In its Cacía, Figueira da Foz and Setúbal mills Portucel has the capacity to yearly manufacture 1.315 thousand tonnes of BHKP using a chemical process named the Kraft Process. Right from its foundations Portucel evidenced its innovative essence as it was a pioneer in the use of Eucalyptus Globulus for pulp production purposes. The technique has been improved throughout the years and adopted by several key Industry players. Nowadays about 83% of the BHKP manufactured is used as raw material for the Paper business; the remaining 17% is sold worldwide.
As can be observed in Graph Portucel is in the top 6 worldwide producers of BEKP. One can additionally observe that in this selected group simply Portucel and Ence are not Latin American players. Fibria is by far the manufacturer with the highest BEKP capacity.
The Paper Segmnent
The star of Portucel’s business, the paper segment is reponsible for 74% of the company’s EBITDA. From 2009 onwards Portucel has been conquering a reasonable share within the premium and folio market niches. The company currently manages 11 paper brands, including Navigator, Explorer and Pioneer.
Indeed, Portucel is the top European manufacturer of UWF with a production capacity of 1.595 million tonnes a year spread across the Figueira Foz and Setúbal mills, as shown by graph 6 .
Table 1 : Portucel’s Paper Brands
Source : Comapany’s website,2012
285 560 530
0% 50% 100%
2011
Graph 3 : Pulp Production
Capacity
( in 000' tones /year)Cacia Mill Figueira da Foz Mill Setúbal Mill
Source : Comapny reports,2011
5.245 1.575
1.580 1.375 1.340 1.200
Fibria Suzano…
CMPC Portucel Ence Cenibra
0 1.000 2.000 3.000 4.000 5.000 6.000
Graph 4 : BEKP top producers's capacity
worldwide
PORTUCEL COMPANY REPORT
THIS
DOCUMENT
IS
NOT
AN
INVESTMENT
RECOMMENDATION
AND
SHALL
BE
USED
EXCLUSIVELY
FOR
ACADEMIC
PURPOSES
(SEE DISCLOSURES AND DISCLAIMERS AT END OF DOCUMENT)PAGE 5/37 By observing graph 6 it is possible to realize that Portucel recently increased its paper production capacity by 225 to 1.585 million tonnes/year though an investment of about EUR 900 million. The latter Investment equally regarded the acquisition of a a 81 MW combined-cycle natural gas cogeneration power plant associated with the Setúbal Paper mill, together with two 12.5 MW biomass termoelectric power plants each built in the Cacial and Setúbal mills. According to NOVA Equity Research Team estimates this venture results in extra paper sales amounting 435 millions a year wich translates itself into a Net Present Value of € 240 million. Estimated project cash flows can be found in the appendix I, as well as the remaining related financial statements and the underlying assumptions behind the valuation.
The geographical breakdown of Portucel’s paper sales evidences the wide diversification of the Group’s clients, as graph 5 shows. Yet one should notice that Portucel has a considerable exposure to developed countries. It can also be observable in graph 8 that not taking into account International Paper, 92% of Portucel’s main competitors’ sales are made outside the country of origin, which evidences how global the paper business is.
The Energy Segment
In parallel with its main activities the Portucel Group is the largest national producer of renewable energies through biomass, so that in 2011 it produced about 50% of the electric energy generated by this renewable source. In this field Portucel currently holds 2,500 TW/h annual capacity divided across biomass termoelectric power plants and combined-cycle natural gas cogeneration power plants. Even though there are no more energy investments scheduled in the medium-term, the energy segment remains key to Portucel’s operations .
Furthermore, Portucel is the major shareholer of Soporgen, which is a cogeneration enterprise that supplies electric energy to the Figueira da Foz Industrial complex. Soporgen has an annual production capacity of 440 GWh.
790 790 790
295
795 795
0 500 1000 1500 2000
2009 2010 2011
Graph 6 : Paper Capacity
(in 000' tons/year)
Figueira da Foz Mill Setúbal Mill
So
u
Source : Comapny
1585 1432 1318 1155 1031
Portucel Stora Enso Mondi UPM International Paper
0 1000 2000
Graph 7 : European UWF paper top
manufacturer's capacity
(in 000' tonnes/yearSource : Portucel, EMGE March 2010
0% 20% 40% 60% 80% 100%
Graph 8 : European UWF
paper top manufacturer's
exports
Sales to country of domicile
Remaining Sales Source: Bloomberg,Company Reports,2012
0 5000 10000 15000 20000 25000 30000
0% 20% 40% 60% 80% 100%
Graph 5 : Top European
UWF manufacturers'
Sales and Geographic
Breakdown
Rest of the World South and Central Amercia North America
Europe Asia Sales
Source: Bloomberg,Company Reports,2012
0 500 1.000 1.500 2.000
Graph 9 : Energy
Production in GWh
PORTUCEL COMPANY REPORT
THIS
DOCUMENT
IS
NOT
AN
INVESTMENT
RECOMMENDATION
AND
SHALL
BE
USED
EXCLUSIVELY
FOR
ACADEMIC
PURPOSES
(SEE DISCLOSURES AND DISCLAIMERS AT END OF DOCUMENT)PAGE 6/37 75,85%
2,01% 2,66%
19,48%
Graph 10 : Shareholder
Structure
Semapa SGPS SA
Bestinver Gestión, S.A. SGIIC
Portucel's own shares
Free float
Source: Comapny reports,2011
Overall the energy produced by Portucel represented 4.80% of the total energy produced in Portugal in 2011. The energy segment accounts for 4% of Portucel’s EBIT.
Shareholder structure
Portucel’s shareholder structure is rather simple. In fact 75.85% of its capital and voting rights belong to Semapa SGPS SA, share that is divided within the group’s several subsidiaries, including Seinpart - Participações, SGPS, SA and Seinpar Investments B.V. S. Besides Portucel, the Semapa group also holds significant participations is Secil and ETSA. Conversely Bestinver Gestión, S.A. SGIIC is the second largest shareholder of Portucel. The group holds 15,407,418 Portucel’s shares which corresponds to 2.01% of the company’s capital and voting rights. Bestinver is a renown Spanish Asset manager, which holds significant participations is several Public
Portuguese companies, including Altri and Sonae.The remaining shares are splited between Portucel’s own shares, 2.66%, and free floating, 19.48%.
When looking at the 6 month average volume of Portucel’s shares one can conclude that there is no considerable liquidity. It results that it is questionable whether the quoted share prices are actually market prices.
The Pulp and Paper Industry
The foundations of the Pulp and Paper Industry bring us back to China in 105 AD .Yet, the 19th century marked a revolution in the sector as several large Paper and Pulp manufacturers were settled mainly in Canada, U.S. and in the Northern European countries, where raw materials, and especially capital, were widely available.
Nevertheless, in a world were globalization is queen and paper products are being threatened by technology, competitive advantage is key when ruling who survives. As a consequence, over the past few years the sources of competitive advantage have been dictating the major Industry trends.
Having this in mind, we will start by looking at the intrinsic characteristics of the industry, and then focus on the sources of competitive advantage that have been leading the industry dynamics.
Right from the beginning one of the features that characterized the sector is its capital intensity: it is required a substantial upfront investment just to obtain the first unit of the good produced. As a natural consequence one can say that there are medium to high barriers to entry the industry. We consider that this feature yields additional consequences to the firm. We see that companies highly reliant on machinery typically have to incur in significant maintenance costs on a regular basis- fact that is reflected in a company’s Capital Expenditures.
It is also intuitive that modernization goes hand in hand with competitiveness. We
Average 6 month volume Stora Enso 4.722.144,00
PT 3.322.744,00
Fibria 1.894.872,00
Galp 1.306.835,00
Metsa Board 734.141,10
Portucel 190.025,90
Table 2 – Average 6 month share traded volume
27,47%
13,01%
7,00%3,35% 2,87%1,93%
0,00% 5,00% 10,00% 15,00% 20,00% 25,00% 30,00%
Graph 11 : Capex/Sales
PORTUCEL COMPANY REPORT
THIS
DOCUMENT
IS
NOT
AN
INVESTMENT
RECOMMENDATION
AND
SHALL
BE
USED
EXCLUSIVELY
FOR
ACADEMIC
PURPOSES
(SEE DISCLOSURES AND DISCLAIMERS AT END OF DOCUMENT)PAGE 7/37 understand that Pulp and Paper market players can be quickly surpassed by their direct opponents if they are resilient of doing the required machinery upgrades in a timely manner. The latter fact is especially true in an intense rivalry Industry, such as the Pulp and Paper (P&P) Industry, where there is a low differentiation between goods
produced by different manufacturers. The high rivalry present in the industry is equally fed by the fact that there is a very abundant supply capacity at the same time that Pulp and Paper are relatively light goods to transport, making them relatively low costly to export. We willbetter address these last issues later in this report.
One of the strategies that have been widely adopted by several Industry players is the
increasing vertical integration of the Forestry, Pulp and Paper businesses. Indeed, enterprises effort to ride along the several stages of the value chain so as to absorb the maximum intrinsic value in each step. It is commonly believed that by vertically integrating firms can better control the quality of the raw materials used as an input for the final good manufacturing at the same time that they avoid the often volatile raw material’s market. Additionally companies start possessing the ability of selling higher-value-added products, which can be beneficial for their revenue margins at the same time that can make them more competitive against their peers. Graph 12 plots the impact on paper deliveries and costs of the recent expansion project undertaken by Portucel. We could observe that since the implementation of the project paper costs per tonne dropped by 235% to 522 €/tonne in 2010. In 2022 this figure slightly increased reflecting pressure on raw material’s costs.
The process
The paper making process starts in the forest with the breeding and growing of the diverse pulp-prone tree species. There are two primary species of wood used as fiber:
hardwood (e.g. Eucalyptus, Acacia) and softwood (e.g. pine, birch). Softwood species generally have long, flexible fibers which add strength to paper while fibers from species of hardwood contain shorter fibers which lead to opacity.
As their differences imply, alternative climate conditions are prone to the efficient growth of the two primary species groups. Hardwood species grow well in tropical and sub-tropical climates whereas softwood grades are typically successful in cold high-latitude climate. In table 3 we can observe the worldwide stock of both hardwood and softwood. We notice that Latin America is the richest region in terms of forest stock, being particularly intensive in hardwood.
Table 4 evidences the divergence of years-to-rotation between hardwood and softwood plantations and the corresponding productivity. It is interesting to see that while a Pine tree can take up to 80 years to reach a commercially mature size in Finland, a Eucalyptus Globulus takes only 7 years, on average, in Brazil to reach a similar state. As expected rotation has a clear inverse relationship with productivity. As a consequence wood costs are a direct function of the latter variables.
Total cbm
(billions) Softwood Hardwood Total
Canada 22,6 6,8 29,4
USA 12,7 9,5 22,2
Latin America 2 107,4 109,4
Europe 13 7,5 20,5
Africa 0,5 55,1 55,6
Russia 63,7 16,9 80,6
China 4,9 4,9 9,8
Japan 1,8 1,1 2,9
Southeast Asia 3,8 37,1 40,9
Australia 0,9 7,9 8,8
Sub-Total 125,9 254,2 Grand Total 380,1
Table 3 – Global Forest Stock 0
500 1.000 1.500
Graph 12 : Integration project's impact
Pulp used Internally
Paper deliveries
Costs € /ton
PORTUCEL COMPANY REPORT
THIS
DOCUMENT
IS
NOT
AN
INVESTMENT
RECOMMENDATION
AND
SHALL
BE
USED
EXCLUSIVELY
FOR
ACADEMIC
PURPOSES
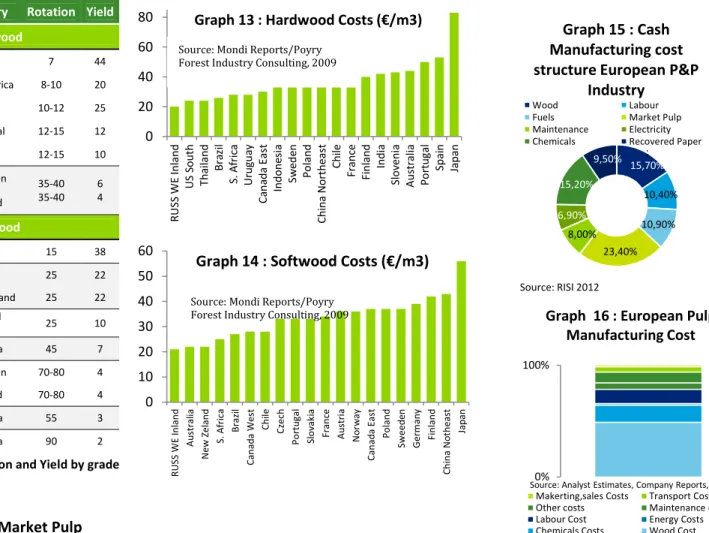
(SEE DISCLOSURES AND DISCLAIMERS AT END OF DOCUMENT)PAGE 8/37 While observing graphs 13 and 14 together with table 4 one can conclude that productivity has a significant impact on wood costs. As graph 15 exhibits wood costs make up approximately 50% of a pulp manufacturer’s cost structure. Given the high reliance of pulp on the paper manufacturing process, wood costs are indirectly a key variable influencing paper manufacturing costs. Therefore, in a Pulp & Paper manufacturer point of view it becomes crucial to minimize wood costs so as to ensure competitive advantage.
An equally important decision to make is whether to use softwood or hardwood. Graph 17 evidences the gap in demand between BSKP and BHPK. It is also noticeable, nevertheless, that this gap has been diminishing and is forecast to maintain this trend. We believe that the reasons behind this trend deal with Hardwood superior supply and costs: keep in mind that in the last decade the difference in softwood and hardwood production costs ranged from €68 to€100 3, yet softwood pulp has been trading at an average premium of & over hardwood pulp as one can observe in graph 18.
3
Bracelpa, 2011
Species Country Rotation Yield
Hardwood
Eucalyptus
Brazil 7 44
South Africa 8-10 20
Chile 10-12 25
Portugal 12-15 12
Spain 12-15 10
Birch
Sweeden 35-40
35-40 6 4 Finland
Softwood
P. spp Brazil 15 38
P. radiata Chile 25 22
New Zealand 25 22
P. elliottii United
States 25 10
Douglas F. Canada 45 7
Pic. abies Sweeden 70-80 4
Finland 70-80 4
Pic. glauca Canada 55 3
Pic. mariana Canada 90 2
Table 4 : Wood Rotation and Yield by grade
0 20 40 60 80 R U S S W E I n la n d U S So u th T h a il a n d B ra zi l S . A fr ic a U ru g u a y C a n a d a E a st In d o n e si a S w e d e n P o la n d C h in a N o rt h e a st C h ile F ra n ce F in la n d In d ia S lo ve n ia A u st ra li a P o rt u g a l S p a in Ja p a n
Graph 13 : Hardwood Costs (€/m3)
Source: Mondi Reports/Poyry Forest Industry Consulting, 2009
; 15,70% 10,40% 10,90% 23,40% 8,00% 6,90% 15,20% 9,50%
Graph 15 : Cash
Manufacturing cost
structure European P&P
Industry
Wood Labour
Fuels Market Pulp
Maintenance Electricity
Chemicals Recovered Paper
Source: RISI 2012
0 10 20 30 40 50 60 R U S S W E I n la n d A u st ra li a N e w Z e la n d S . A fr ic a B ra zi l C a n a d a W e st C h il e C ze ch P o rt u g a l S lo va k ia F ra n ce A u st ri a N o rw a y C a n a d a E a st P o la n d S w e e d e n G e rm a n y F in la n d C h in a N o th e a st Ja p a n
Graph 14 : Softwood Costs (€/m3)
Source: Mondi Reports/Poyry Forest Industry Consulting, 2009
0% 100%
Makerting,sales Costs Transport Costs
Other costs Maintenance cost
Labour Cost Energy Costs
Chemicals Costs Wood Cost
Source: Analyst Estimates, Company Reports, 2012
Graph 16 : European Pulp Manufacturing Cost 8 13 18 23 2 0 0 4 2 0 0 5 2 0 0 6 2 0 0 7 2 0 0 8 2 0 0 9 2 0 1 0 2 0 1 1 2 0 1 2 2 0 1 3 2 0 1 4 2 0 1 5 2 0 1 6
Grpah 17 : Market Pulp
Demand
(in million tonnes)BEKP BSKP
Source: Poyry, 2012
0 500 1 6 4 1 2 7 1 9 0 2 5 3 3 1 6 3 7 9 4 4 2 5 0 5 5 6 8
Graph 18 : BSKP €/ton vs
BHKP €/ton
Spread BSKP price
BHKP price
Source: Foex, Bloomberg,
PORTUCEL COMPANY REPORT
THIS
DOCUMENT
IS
NOT
AN
INVESTMENT
RECOMMENDATION
AND
SHALL
BE
USED
EXCLUSIVELY
FOR
ACADEMIC
PURPOSES
(SEE DISCLOSURES AND DISCLAIMERS AT END OF DOCUMENT)PAGE 9/37 Keep in mind that pulp is not only manufactured out of virgin fiber. Indeed, recycled paper has been increasingly used for pulp producing purposes. Yet, the main paper grade manufacture with recycled paper is carton board.
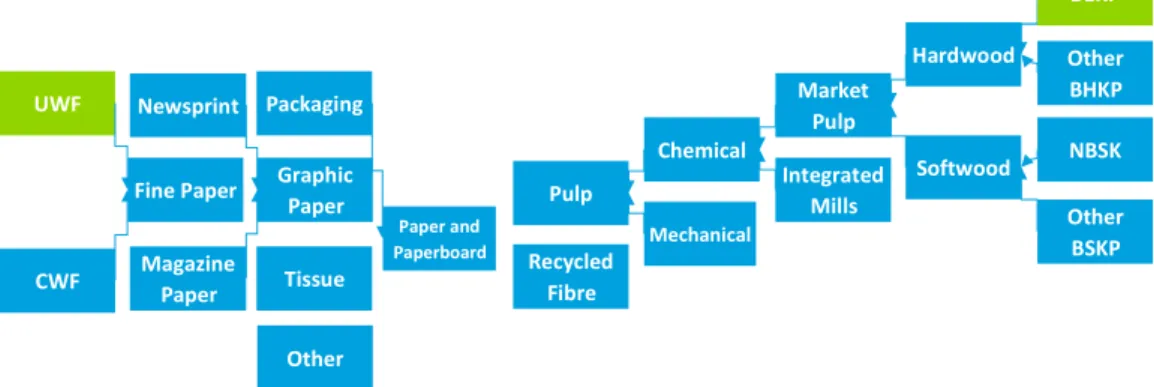
The next step of the process relies with the pulp manufacturing. Table 5 exhibits the main connections between the industry’s raw, intermediate and final goods while emphasizing the segments where Portucel operates.
Table 5 – P&P Industry interconnections
Pulp is generally classified according to fiber type, the process used in its production and the degree to which it is bleached. Several techniques serve the pulp producing process, including mechanical, chemical and the semi-chemical pulping. Table 6 summarizes the main characteristics of each pulping process.
Table 6 – Pulping Processes
Portucel uses Kraft chemical pulping process. This results in long, strong and stable pulp fibers, produced at a relatively lower energetic needs. The biggest disadvantage of this process is the fact that for bleached pulp there is a process yield of pulp (45-50%). As a consequence 2,83 m3 of wood are needed in order to produce a tone of pulp.
It is interesting to observe that 66% of the pulp is manufactured with the purpose of being directly integrated in paper manufacturing. The remaining built up the so-called Market Pulp. Graph 19 pictures the Chemical Pulp Supply geographic breakdown. We observe that Latin America countries are, by themselves, responsible for a substantial 29% of the world chemically-manufactured Market Pulp. While developed countries still represent 59% of the supply, their chuck has been significantly decreasing through the last decades, as Graph 20 exhibits.
BEKP
Other BHKP
Chemical
Other
Paper and
Paperboard Recycled
Fibre Pulp
Mechanical
Packaging
Tissue
Market Pulp
Integrated Mills
Hardwood
Softwood Graphic
Paper Newsprint
Fine Paper
Magazine Paper UWF
CWF
NBSK
Other BSKP
Pulping
process Yield Typical products
Mechanical High [85%-95%] Newsprint, magaxines, books, containerboard
Cheminal Lower[40-70%] kraft process[bags, newspring wrapping] sulphite process[fine paper, tissue, newsprint]
Semi-cheminal Intermediate[55-85%] Corrugated board, food packaging, newsprint
Recycled Diverse[60%-95%] Newsprint, writting paper, tissue, packaging
17%
14%
12% 9% 4% 29% 2%
1% 12%
Graph 19 : Global Chemical Pulp Market
Supply
United States
Canada
Nordic Countries
Western Europe
Eastern Europe
Latin America
Japan
Oceania
Indonesia/Others
PORTUCEL COMPANY REPORT
THIS
DOCUMENT
IS
NOT
AN
INVESTMENT
RECOMMENDATION
AND
SHALL
BE
USED
EXCLUSIVELY
FOR
ACADEMIC
PURPOSES
(SEE DISCLOSURES AND DISCLAIMERS AT END OF DOCUMENT)PAGE 10/37 Taking a closer look at this phenomenon we could identify several reasons that can contribute to the relatively attractiveness of the south. First of all we realize that
regulation is less strict in the majority of southern countries. We also see that governments typically provide subsidies to encourage the development of the industry. It is equally true that labour is cheaper in this group of countries. Nonetheless we consider that the most important factor feeding this phenomenon is the southern hemisphere climate, which allows trees to grow at a relatively higher pace.
Naturally accompanying this move is the increased use of hardwood grades of pulp in opposition to softwood grades of pulp, traditionally used in northern hemisphere plantations.
At this point we are able to understand that decision makers are not neglecting the sources of competitive advantage when geographically locating pulp capacity. Nonetheless paper manufacturing capacity is not necessarily located at the source of pulp production. It results that substantial market pulp traffic takes place. Graph 21 exhibits pulp imports by region. It is perceivable that in North America and Europe altogether are the targets of the higher percentage of pulp imports. Nevertheless, what is impressive to notice is that China by itself was responsible for about 22% of the pulp shipments in 2011.
As a consequence, one should equally not neglect the impact that Chinese pulp imports have on pulp prices. As previously showed China is a net importer of pulp. It does so with such a volume and growth pace that it can be regarded as a key influence to pulp prices. When analyzing the time series we concluded that the variables yield a historical correlation of - 26%4.Nevertheless we should notice that this value is not in line with our initial expectations. We believe that these discrepancies might be related to an exchange-rate effect that results into a non-direct relationship between the variables. Indeed, the majority of the pulp imports are negotiated in dollars so that the EURUSD quote is interfering in the relationship between the studied variables.
Another very important factor influencing pulp prices is the amount of pulp held in inventories, as typically a result of excess capacity. Graph 13 clearly shows the inverse relationship between these two variables. When analyzing the time series we concluded that the variables yield a correlation of -24%. 5The rationale behind this behavior is easy to understand: if inventories are abundant, suppliers would be willing to sell pulp at a relatively lower price in order to get rid of the extra pulp; the same logic works for the opposite scenario. Again we notice that a lower-than-expected value is obtained that we believe is due to the lagged character of the relationship.
Some attention should be likewise paid to exchange rates as a factor influencing the industry’s dynamics. For instance a Brazilian’s Real depreciation will benefit local producers that have most of their costs in Reals and will likely sell the production to the rest of the world at a comparatively lower cost, becoming relatively more competitive.
4
Pixpecu Index against Cnivpulp Index, monthly data from 29/02/2000 to 30/04/2012, souce: Bloomberg.
5 Pixpecu Index against Foixwpi Index, monthly data from 28/02/2002 to 30/04/2012, souce: Bloomberg. 0 10 20 30 40 50 60 0 200 400 600 800 1000 Ja n -0 9 Ju n -0 9 N o v-0 9 A p r-1 0 S e p -1 0 F e b -1 1 Ju l-1 1 D e c-1 1
Graph 22: Pulp days in
Inventory vs BHKP prices
€/ton
Days in Inventory BHKP
Source : PPPC 0% 10% 20% 30% 40% 50% 60% 70% 80% 90% 100%
1970 1990 2000 2011
Graph 20 : Market Pulp
Supply by Geography
New Producers in Latin America and Asia
Traditional Producers
Source: Stora Enso / Jaako Poyry, 2010
17%
34% 22%
27%
Graph 21 : Pulp Imports
by Region
North America Western Europe
China Other
PORTUCEL COMPANY REPORT
THIS
DOCUMENT
IS
NOT
AN
INVESTMENT
RECOMMENDATION
AND
SHALL
BE
USED
EXCLUSIVELY
FOR
ACADEMIC
PURPOSES
(SEE DISCLOSURES AND DISCLAIMERS AT END OF DOCUMENT)PAGE 11/37 In a similar fashion a Euro appreciation will increase the purchasing power of the main paper consumers, at the same time that it will harm European producer’s margins. A weaker Euro and a stronger Real will additionally flatten the cost curve. When analyzing the time series we concluded that the variables yield a correlation of -68%6.
All in all, pulp is transported to where the paper and paperboard manufacturing mills are located. Graph 23 breaks down Paper and Paperboard Production by region.
We observe that Europe and Northern/Central America were in 2010 altogether responsible for 51% of the commodity production. Yet, Asia outstands as being the top Paper and Paperboard manufacturing region. Special attention should be likewise paid to China that, by itself, is responsible for 24% of the worldwide Paper and Paperboard manufacturing in 2010.
Printing and Writing Paper manufacturing, Portucel’s main business, represents 28% of the total Paper production. Additionally we see that the regional dispersion of this type of paper is similar to the total paper’s one.
We conclude this chapter doing recap on the geographic location of the various intervenients in the Paper manufacturing Industry. Graph 24 ploits the mentioned data.
6 Pixpecu Index against EURBRL Curncy Index, weekly data from 01/01/2000 to 30/04/2012, Souce: Bloomberg 0%
20% 40%
Africa Northern
America
Central and Latin America
Asia Europe Oceania
Graph 24 : Industry Supply-to-Demand Analysis
Wood Stock Market Pulp Capacity Paper Capacity Paper Consumption
Source: FAOSTAT, RISI, Company Reporys, 2012
27% 24%
4% 1%
1%
3% 5% 2%
24%
7%
3% 34%
Graph 23 : Paper and Paperboard Production by Region
Europe
Northern/Central America Latin America
Oceania Africa
Southern Asia South-Eastern Asia Western Asia China Japan
Republic of Korea
PORTUCEL COMPANY REPORT
THIS
DOCUMENT
IS
NOT
AN
INVESTMENT
RECOMMENDATION
AND
SHALL
BE
USED
EXCLUSIVELY
FOR
ACADEMIC
PURPOSES
(SEE DISCLOSURES AND DISCLAIMERS AT END OF DOCUMENT)PAGE 12/37 Area by area our main points are: Africa besides having abundant forest resources does not have significant capacity installed. Northern America even though no longer regarded as an efficient P&P manufacturer it still houses considerable pulp capacity. Central and Latin American countries are making use of being not only the richest wood resource region but also fro being specially competitive. These players have considerable pulp capacity installed and so are net pulp exporters, as previously mentioned. Additionally we see that Asia is not particularly rich in wood resources. Yet, in order to feed its growing demand for paper it has an expansionary paper capacity that now makes the region a net paper exporter.The magnitude of Asian paper pulp needs is nevertheless not fulfiled by its pulp capacity. With paper consumption decreasing at an accelarating pace, Europe is a net Paper exporter.
At this point another question arrises. So in the end is it more costly to transport wood, pulp or paper? And where should mills be located? According to our analysis a ton of Paper is the priciest to transport, followed sub sequentially by pulp and wood. According with Portucel, the differences in prices are explained by additional costs related with the protection of the goods while being transported ( e.i. paper should be totally isolated from humidity; while transporting pulp does not yield such significant concerns, it implies a certain degree of protection).
Nevertheless, in order to establish more robust conclusions one should think how much pulp would be needed to produce one ton of paper and how much wood was needed to produce that pulp. Indeed, there is not a one-to-one conversion relationship between the goods (in BEKP and UWP case 2,83 m3 of wood are transformed in 1 tone of pulp as 0,72 tonnes of pulp are transformed into 1 tonne of paper ).
Having all the information into account we concluded that per tonne of paper produced, wood is, by far, the most expensive good to transport, at the same time that pulp is the less costly with a considerable advantage. In light of this we conclude that the most important factor when locating a P&P mill is the resource availability followed by closeness to paper demand.
Industry Sustainability Analysis
Several variables threaten the sustaintability of the industry. Firstly we see that
substantial imbalances prevail when the Industry’s supply meets the corresponding demand. As shown by graph 25 UWF paper supply structurally exceeds demand. Yet we also observe divergences across world regions. It results that prices end up absorbing these dynamics, being quite responsive to mill closures and openings.
7
Assuming a transport distance of about 10.000 km Table 7 - Cost estimations, Source: VCP,
Analyst Estimates, 2012
Average €/tonne 7
Per tonne of paper manufactured €/tonn
46 183,78
50 36,00
72 72,00
0 50
Africa Asia Europe Latin America North America Total
In million/tonnes/year
Graph 25 : Uncoated
Woodfree Paper Capacity
Consumption Capacity
PORTUCEL COMPANY REPORT
THIS
DOCUMENT
IS
NOT
AN
INVESTMENT
RECOMMENDATION
AND
SHALL
BE
USED
EXCLUSIVELY
FOR
ACADEMIC
PURPOSES
(SEE DISCLOSURES AND DISCLAIMERS AT END OF DOCUMENT)PAGE 13/37 Indeed, we observe that from 2000 to 2010 the correlation between European UWF capacity and UWF prices in Euros was 20%. Nevertheless, not taking into account the period started in 2008 the correlation between the variables was -66%. We can conclude that the sensitivity of UWF prices to European capacity severely decreased as European capacity drop. Given the decreasing consumption demand in Europe and the scheduled projects8 we believe that this trend will further aggravate.
As previously explained paper prices are a function of the paper supply/demand dynamics. For instance we observe that prices expressively decreased from 2001 to 2005 which corresponds to the period were substantial capacity was added in several emerging markets, including China. After the market adjusted to this new reality, the financial crisis stepped in damaging demand - which in turn explains the adjustment in prices in 2009. As a cyclical Industry, it widely felt the impact of the recent financial crisis. Firstly we observe that the deceleration in output had a considerable impact on paper demand so that in the aftermath of the crisis several players left the market9, allowing for price improvements in 2011. Yet, the ones who survived had to stretch their balance sheets in order to support the unfavorable macroeconomic environment. In parallel we see that the major P&P Industry players faced substantial decreases in market capitalization from 2007-10.
Our analysis evidenced that in the studied period 2 complete cycles took place with the average duration of 5.54 years. We assume that the second cycle ended in 10/2011 in accordance with the significant slump that UWF paper prices have been suffering from this peak onwards and the current industry fundamentals.
Additionally, paper prices are also related to pulp prices as companies as able to pass-through pulp price hikes to paper prices. Graph 27 plots this relationship. We observe that the spread is historically around the historical average of 300 €, recently reached.
Despite the recent closures, several market players are planning to add considerable extra capacity in the next few years, both in terms of pulp and paper. Appendix II details the main on-going projects. Overall by 2015 the pulp industry if forecast to add additional 8.6 million tonnes in yearly production capacity. It is interesting to observe that despite the imbalances, supply keeps diverging from demand.
It is equally interesting to have a look at the paper consumption per capita .We firstly observe that paper consumption per capita in developed regions has been following an analogous pattern, even though Northern American countries start with a higher consumption base. From 2006 onwards we see that consumption in these countries expressively decreases. In 2010 paper consumption per capita in Northern America is 232 kg/year while in Europe the same figure is 130 kg/.We also observe that paper consumption per capita has been surging in regions particularly exposed to Emerging Economies. In South America the mentioned figure grew annually by 1.6% CARG at the same time that it experienced a 4.6% CARG annual increase in Asia. Last but not the
8
Apendixes II and III presents BEKP and UWF European Capacity recent closures and scheduled starts
9
Apendixes II and III presents BEKP and UWF European Capacity recent closures and scheduled starts.
8,5 9 9,5 10 10,5 11
0 200 400 600 800 1000 1200
2000 2002 2004 2006 2008 2010
Graph 26 : European UWF Capacity vs UWF prices in €
European UWP Capacity FOEXA4BC Index Source : RISI,EMGE, FOEX,Bloomberg, 2012
0 100 200 300 400 500
Graph 27: UWF-BEKP price differential in €/ton
Conversion Historical Average
PORTUCEL COMPANY REPORT
THIS
DOCUMENT
IS
NOT
AN
INVESTMENT
RECOMMENDATION
AND
SHALL
BE
USED
EXCLUSIVELY
FOR
ACADEMIC
PURPOSES
(SEE DISCLOSURES AND DISCLAIMERS AT END OF DOCUMENT)PAGE 14/37 least, consumption per capita in African countries remained subdued throughout the studied period.
Yet, one should keep in mind that when looking at the aggregated paper consumption it is not really seeing the whole picture. While the consumption of certain types of paper, such as containerboard, has been flawlessly increasing, it widely contrasts with the behavior of both newspaper and Printing & Writing paper consumption.
Moreover, starting with Printing & Writing paper we see that the consumption of this paper grade is far from being homogeneous worldwide. While consumption in Africa is low both in absolute and in per capita terms we should pay attention to the considerable rise in Asian consumption together with the drop in both European and Northern American values. Notice that per capita figures in Asia have remained fairly stable, evidencing that the increase in consumption is being almost entirely compensated by the increase in population. In contrast we see per capita figures decreasing in both Europe and Northern American countries as consumption declines at a higher pace than population grows.
In parallel we see that the aggregated newsprint consumption has been falling. Breaking down the figure by region we observe that a slump was suffered in the major regions, so that from 2009 onwards newsprint consumption is either decreasing or stable in each region.
Indeed, in the last decade the increasing uses of computers worldwide together with the upturn in internet penetration resulted in a surge of competition to both Newspaper and Printing & Writing. Having this in mind we decided to take a step further examining the relationship between the variables.
To do so we made use of EU data on the number on individuals using the internet for reading the news together with FAOSTAT data o European Newsprint consumption. Even though our sample is extremely limited (6 observations) our results were striking. We found that the covariance between the two variables is -81%, as considering the R-squared of the regression. Additionally we are aware of the fact that by adding some other variables we could increase the explanatory power of the model. When adding GDP as an explanatory variable the studied period we reached a R-Squared of 99%. As good as this result seems we are critical when being aware that by adding correlated variables that would bias our estimators. It seems intuitive that the included explanatory variables are highly correlated (as GDP increases so does the number of people able to access a computer for news reading purposes). Additionally we observe that such a sounding R-square might be biased due to the extremely small sample size.
Shifting to Growth
Taking all this information into account the NOVA Equity Research Team concluded that if the recent trend of diminishing newsprint and P&W paper prevails, European paper manufacturers will have to shift their excess production to overseas markets as top European UWF paper manufacturers remain fairly dependent on developed markets, which have a decreasing paper demand. Therefore the long-term sustainability of these 0,00 50,00 100,00 150,00 200,00 250,00 300,00 350,00 1 9 6 1 1 9 6 8 1 9 7 5 1 9 8 2 1 9 8 9 1 9 9 6 2 0 0 3 2 0 1 0
Graph 18 - Paper Consumption Per Capita
1961-2010 Africa Northern America South America Asia Europe Oceania Source: FAOSTAT, Analyst estimnates 0 100 200 300 M il li o n t o n n e s/ y e a r
Graph 19 : Paper Consumption by Grade
Printing &Writting
Newsprint
PORTUCEL COMPANY REPORT
THIS
DOCUMENT
IS
NOT
AN
INVESTMENT
RECOMMENDATION
AND
SHALL
BE
USED
EXCLUSIVELY
FOR
ACADEMIC
PURPOSES
(SEE DISCLOSURES AND DISCLAIMERS AT END OF DOCUMENT)PAGE 15/37 producers will be intrinsically dependent on whether they can shift its production to economies where demand is still flourishing. Indeed, this move will imply higher transport costs.
At this point it seems key to access the magnitude of logistic costs on total costs as well as the possible impact of a geographical shift. Due to the lack of data the NOVASBE Equity Research Team adopted the Koskinen and Hilmola methodology10 so as to estimate the costs incurred by Portucel directly related with the Paper export logistics. Doing so, we used the estimated costs per ton as a benchmark for our computations. Nevertheless, we did some adjustments on the model so as to incorporate Portucel’s characteristics, including the adjustment for Portucel’s reliance on the different transport means (i.e. truck, rail, ship). Last but not the least, we broke down logistic costs by mill and discriminated between sales to Europe and to the rest of the world. Indeed, it is reasonable to assume that the transport costs incurred by sales outside Europe would be considerably higher due to two main reasons: 1) Additional miles would be traveled and 2) Customs tariffs outside the Eurozone are substantially higher. Table 8 exhibits NOVASBE Equity Research Team estimations.
Table 8 : Paper Logistic Costs Breakdown Europe Rest of the World
Annual Capacity Allocated Setúbal mill Figueira da Foz mill
Setúbal mill
Figueira da Foz mill
680.402
676.122 114.598 114.598
Mill warehousing wagon/truck loading 1,70 1,69 0,29 0,28
Trucking company 19,28 19,28 0,95 0,95
Port operator, wagon & truck discharging
2,41 2,41 1,21 1,20
Port operator, warehousing Port operator, vessel loading
Shipping line 4,82 4,82 20,05 19,93
Port operator, vessel discharging
2,41 2,41 3,63 3,61
Port operator, warehousing and customer delivery
Total Logistic Costs (in € Mln ) 30,62 30,61 26,13 25,97
Total Logistic Costs per Destination(in € Mln ) 61,23 52,11
Paper Logistic Costs as a Percentage of Paper Costs per tonne 14,46%
We concluded that 38% of the logistics costs are directly related with the shipping whereas total transport costs represent 14,46% of the total paper costs in 2010.
At this point it makes sense to analyze how a sales
shift would affect Portucel. Table 9 presents the sensitivity of the Paper segment EBITDA Margin to a change in a geographical breakdown of paper sales. We could see that while under the current conditions the Paper segment yields a margin of 27%, a shift in sales
10
Pekka Koskinen, Olli-Pekka Hilmola, 2009,Industrial Shutdown in Finnish Paper Industry – Case Study from Logistics Provider Perspective.Lapperanta University of Technology
Table 9 : EBITDA Margin Sensitivity
Paper Sales
to Europe 40% 50% 70% 86% Paper
Logistic Costs
245,5 216,5 158,5 113,3
EBITDA
PORTUCEL COMPANY REPORT
THIS
DOCUMENT
IS
NOT
AN
INVESTMENT
RECOMMENDATION
AND
SHALL
BE
USED
EXCLUSIVELY
FOR
ACADEMIC
PURPOSES
(SEE DISCLOSURES AND DISCLAIMERS AT END OF DOCUMENT)PAGE 16/37 that resulted in 70% of the sales allocated to Europe would bring down this figure significantly down to 25%. A more extreme scenario, when 40% of the sales are made outside Europe, would result in a 117% increase in Paper logistic costs in comparison with the current scenario, bringing down the segment’s EBITDA margin to 20%.
What if Portucel Exports to China?
Having in mind the possible impact of a geographical shift on costs we will analyze whether it is possible and profitable for Portucel to enter/increase its exposure to some specifically selected markets. Given the fact that Chinese P&W consumption per capita still exhibits a robust upward trend, widely contrasting with the worldwide fashion, we will focus on this market
Firstly we notice that China’s outperformance within the Pulp & Paper sector has been gaining a different magnitude in recent years. We observe that China’s contribution to the worldwide P&W production rose from simply 8% in 2000 to 21% in 2010. But this is not the end of the story. In 2006 China turned a negative P&W trade deficit into positive as its production capacity strongly improved and imports keep representing a decreasing share of consumption. In parallel P&W exports represent a fairly stable share of the production.
The NOVA SBE team developed a Chinese UWF market research in order to access the price per ton companies are demanding in China. Assuming a Euro-Yuan exchange rate of 8.35 we concluded that market office papers in China are priced at 462 €/ton, which is a considerable lower pricing than Portucel’s average UWF paper price in Portugal. What is striking is that this value is even lower that Portucel’s historical UWF Cost per tonne produced. We conclude that even not taking into account the increasing transport costs, it would be unprofitable for Portucel to sell to China at the estimated prices.
Taking all this information into consideration we are able to conclude that while a geographical sales positioning would increase Portucel’s quantities sold potential, if profitable, it would also imply significant costs, severely damaging margins. All in all we
0% 5% 10% 15% 20% 25% 30% 35%
2000 2001 2002 2003 2004 2005 2006 2007 2008 2009
Graph 20 : Chinese P&W Industry key figures
Consumption Growth China Exports as % of Production
China Imports as % of Consumption Production Growth
Source: FAOSTAT, 2012
Table 10 : Chinese Market Analysis
CNYEUR exchange rate 8
China Office Paper Prices in €/tonne 462
Portucel Paper Prices €/tonne 693
Portucel Paper Costs €/tonne 566
0 5 10 15 20
Graph 20 : Chinese P&W
Consumption per capita
PORTUCEL COMPANY REPORT
THIS
DOCUMENT
IS
NOT
AN
INVESTMENT
RECOMMENDATION
AND
SHALL
BE
USED
EXCLUSIVELY
FOR
ACADEMIC
PURPOSES
(SEE DISCLOSURES AND DISCLAIMERS AT END OF DOCUMENT)PAGE 17/37 can say that under the current economic outlook there is not much that Portucel can do in order to avoid a worsening in its future earnings.
What about growth afterwards?
Yet we believe that Portucel’s business faces some limitations of further growth. Firstly we see that Portucel is operating at full capacity and currently has no scheduled investments in the Paper business. Recall that 80% of the company’s sales are directed to the European Market that, even though offers no substantial growth prospects, has been absorbing Portucel’s products without requiring substantial transport costs.
Indeed, Portucel is acknowledging that it is currently unable to compete with the Far East paper manufacturers so that the unique way of benefiting from their fast growing market is by supplying them with pulp. This is exactly Portucel’s rationale behind its Mozambique project. Recall that China is still a market pulp net importer on the back of its relative less competitive wood productivity.
The Mozambique project is currently in phase 1. This phase will take 3 years, and basically deals with the plantatiton of diferent Eucalyptus Species so as to select the one that better adaps to the Mozankbikean soil and Climate. In 2014 phase 2 will begin the the plantation of the chosed Eucaltptus species. Portucel currently estimates than under the Mozambiqeuan Climate Eucalyptus would take 6 to 7 years to reach the comercially mature state. In approximately 2018 the third phase of the project, which is related with the construction of the pulp mill.
In order to compute the sustainable growth rate we took into account not only the Return on Invested Capital11, but also the company’s reinvestment rate12. Nevertheless we assume that Portucel will not be able to sustain its competitive advantage over the long-run, hence not achieving real growth.
The NOVA SBE equity Research team equally acknowledges that it is becoming increasingly more difficult for P&P manufacturers to build additional mills on the back of tighter regulation. Even though in the last few decades we observed a massive increase in supply, governments are becoming more and more sensitive to the devastating environmental impacts of woodlands. These impacts include a threatening to biodiversity conservation as woodlands typically imply monocultures.
11
= ∗
! " 12
#$%&#'()#%( *(# = + , - . /
PORTUCEL COMPANY REPORT
THIS
DOCUMENT
IS
NOT
AN
INVESTMENT
RECOMMENDATION
AND
SHALL
BE
USED
EXCLUSIVELY
FOR
ACADEMIC
PURPOSES
(SEE DISCLOSURES AND DISCLAIMERS AT END OF DOCUMENT)PAGE 18/37
Valuation
Comparables Analysis
Moving forward, we will analyze Portucel’s relative performance in several key arenas such as operational efficiency, liquidity management and solvency.
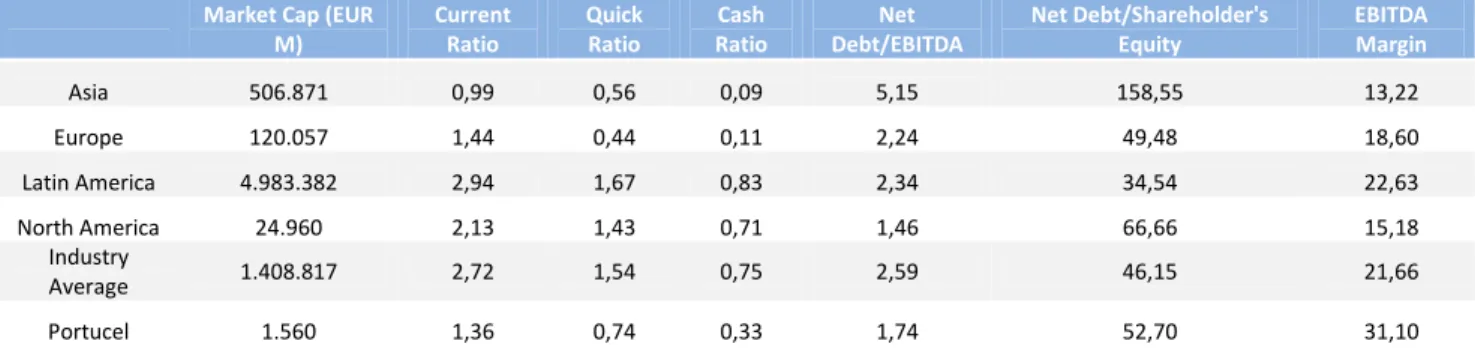
Table 11 - Pulp and Paper Industry key Ratios – 2011
Market Cap (EUR M)
Current Ratio
Quick Ratio
Cash Ratio
Net Debt/EBITDA
Net Debt/Shareholder's Equity
EBITDA Margin
Asia 506.871 0,99 0,56 0,09 5,15 158,55 13,22
Europe 120.057 1,44 0,44 0,11 2,24 49,48 18,60
Latin America 4.983.382 2,94 1,67 0,83 2,34 34,54 22,63
North America 24.960 2,13 1,43 0,71 1,46 66,66 15,18
Industry
Average 1.408.817 2,72 1,54 0,75 2,59 46,15 21,66
Portucel 1.560 1,36 0,74 0,33 1,74 52,70 31,10
We firstly perceive that Portucel has a relatively aggressive approach to liquidity management. When examining its cash, current and quick ratios we observe that the three of them are actually lower than the Industry’s average. We see Latin American players outperforming the Industry in excess liquidity while Asian companies exhibit the most extreme liquidity management practices.
Nevertheless, when scrutinizing the Industry’s solvency profile we were allowed to take slightly different conclusions. While the Asian enterprise’s Net Debt to EBITDA colossal average value of 5.15x is consistent with the region’s stretched liquidity values, Latin American key players exhibit a rather high average ratio of 2.35x. Therefore we conclude that some Industry players, including Shandong Chenming Paper, Rottneros and Fibria are exhibiting alarming leverage levels, and might not be able to successfully face further liquidity events (still likely in the yet blurry world economic outlook). All in all the studied Industry’s sample average Net Debt to EBITDA ratio is 2.59x which compares with Portucel’s 1.74x figure.
PORTUCEL COMPANY REPORT
THIS
DOCUMENT
IS
NOT
AN
INVESTMENT
RECOMMENDATION
AND
SHALL
BE
USED
EXCLUSIVELY
FOR
ACADEMIC
PURPOSES
(SEE DISCLOSURES AND DISCLAIMERS AT END OF DOCUMENT)PAGE 19/37 Additionally Portucel outstands in the Pulp & Paper Industry as an extremely efficient manufacturer. Indeed, its EBITDA margin ratio of 31.10x is only surpassed, in the studied sample, by Fibria, Suzano and Holmen values.
All in all Portucel presents a quite robust operational and solvency levels, even considering the relatively hedgy liquidity management strategy.
Last but not the least we will take a look at valuation multiples of Pulp & Paper comparable companies. In order to enhance the transparency of this analysis we limited our sample to the companies we understand as more similar to Portucel.
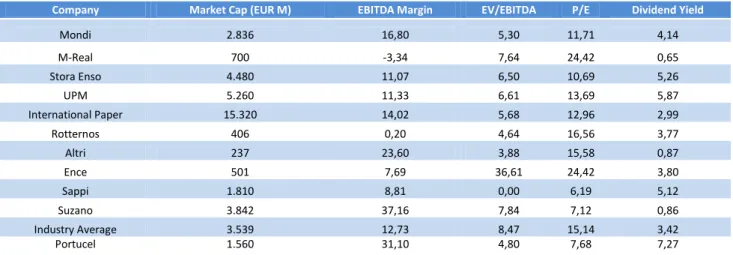
Table 12 - Pulp and Paper Industry Valuation Multiples - 2012E
Company Market Cap (EUR M) EBITDA Margin EV/EBITDA P/E Dividend Yield
Mondi 2.836 16,80 5,30 11,71 4,14
M-Real 700 -3,34 7,64 24,42 0,65
Stora Enso 4.480 11,07 6,50 10,69 5,26
UPM 5.260 11,33 6,61 13,69 5,87
International Paper 15.320 14,02 5,68 12,96 2,99
Rotternos 406 0,20 4,64 16,56 3,77
Altri 237 23,60 3,88 15,58 0,87
Ence 501 7,69 36,61 24,42 3,80
Sappi 1.810 8,81 0,00 6,19 5,12
Suzano 3.842 37,16 7,84 7,12 0,86
Industry Average 3.539 12,73 8,47 15,14 3,42
Portucel 1.560 31,10 4,80 7,68 7,27
Starting with the EV to EBITDA ratio we observe that Portucel’s figure is considerably lower than the sample’s average. Nevertheless we should not interpretate this ratio on a standalone basis. In addition when examining the industry’s Price Earnings ratio we understand that Portucel’s market price is relatively low when taking into consideration the company’s earnings and the Industry figures. This fact gives evidence to the relative undervaluation of Portucel as investors are willing to pay relatively less for a euro of Portucel’s earnings.
Last but not the least, one should look at Portucel’s dividend yield and conclude that it is substantially higher than the Industry’s average. This implies that Portucel’s investors are obtaining relatively more cash flow from each euro invested in Portucel’s shares than they would if they had in Portucel’s peers, on average.
DCF
PORTUCEL COMPANY REPORT
THIS
DOCUMENT
IS
NOT
AN
INVESTMENT
RECOMMENDATION
AND
SHALL
BE
USED
EXCLUSIVELY
FOR
ACADEMIC
PURPOSES
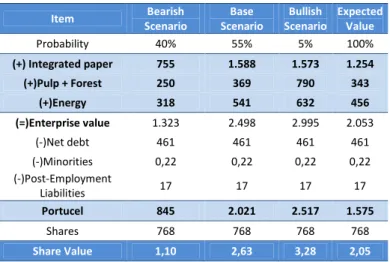
(SEE DISCLOSURES AND DISCLAIMERS AT END OF DOCUMENT)PAGE 20/37 of scenarios, wich will in turn be weighted by the respective probability of occurrence. We weight the Eurozone desintegration scenario by 40% at the same time that our bullish scenario, which incoorporates a a faster Eurozone recovery, would be weighted with 5% probability. Our target price for Portucel will come out of this analysis.
Table 13 - Valuation
Item Bearish Scenario
Base Scenario
Bullish Scenario
Expected Value
Probability 40% 55% 5% 100%
(+) Integrated paper 755 1.588 1.573 1.254
(+)Pulp + Forest 250 369 790 343
(+)Energy 318 541 632 456
(=)Enterprise value 1.323 2.498 2.995 2.053
(-)Net debt 461 461 461 461
(-)Minorities 0,22 0,22 0,22 0,22
(-)Post-Employment
Liabilities 17 17 17 17
Portucel 845 2.021 2.517 1.575
Shares 768 768 768 768
Share Value 1,10 2,63 3,28 2,05
Table 13 summarizes each valuation performed.
Overall Methodology
The NOVA Equity Research team will rely on the Discounted Cash Flow methodology as the prefered valuation metrics for this report. Therefore the computation of the Weighted Average Cost of Capital(WACC) was the first thing to do. Given Portucel’s operations we decided to consider three alternative segments : Forestry and Pulp, Integrated Paper and finaly the Energy segment. For each segment a different WACC13 was computed so as to reflect the different underlying risks of the alternative businessess. Starting with the cost of equity14, a 2-year average of the 10-year swap rate was considered the benchmark for the relevant risk-free rate. The fact that this rate is denominated in euros was a desirable attribute that influenced the choice. Portucel’s beta for each of the three segments was computed through comparable company’s leveraged beta followed by the corresponding deleveraging15, according with each company’s capital structure.
13
( )
D E
D t r D E
E r
WACC e d
+ − + +
= 1
14
(
Mkt emium)
rre= f +βeβIndex Pr
15
0 1%2##4 = 5
PORTUCEL COMPANY REPORT
THIS
DOCUMENT
IS
NOT
AN
INVESTMENT
RECOMMENDATION
AND
SHALL
BE
USED
EXCLUSIVELY
FOR
ACADEMIC
PURPOSES
(SEE DISCLOSURES AND DISCLAIMERS AT END OF DOCUMENT)PAGE 21/37
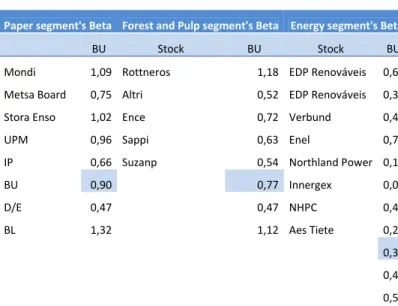
Table 14 –Beta Computations
Portucel’s
unleveraged beta is assumed to be the average of the former figures. A Debt-to-Equity target ratio of 0.47 was assumed for Portucel, in accordance with the company’s 2011 market figures, and a leveraged beta for each segment obtained. The market premium was considered as 5.00% in accordance with relevant literature16. A country risk-premium 17was included in the cost of equity so as to reflect the non- diversiable risks that Portucel faces arrising simply from the fact that the company is settled in Portugal. The country beta was worked out taking into consideration the volatility of the portuguese PSI20 benchmark Index in relative to the World S&P 1200 Index and a correlation factor, assumed to converge to 1 given the present economic environment. Appendix III presents our computations in detail.
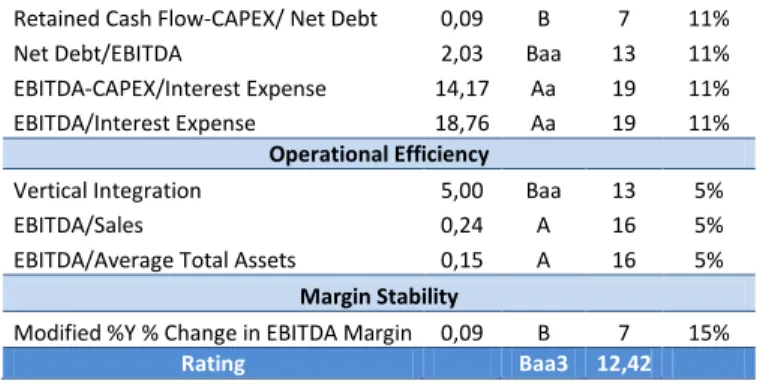
Table 15 – Synthetic Rating Computations
16 New Zealand Treasury, 2005, The Market Equity Risk Premium
17
0+ 7=
8+ 7 7
-8 9 &; <== ∗ > ?@%(3A BC@$(A %4#D, F?324 G&H 1200 ; 2010 (? 2012 )?%(ℎ2A 4*(*
Paper segment's Beta Forest and Pulp segment's Beta Energy segment's Beta
BU Stock BU Stock BU
Mondi 1,09 Rottneros 1,18 EDP Renováveis 0,62
Metsa Board 0,75 Altri 0,52 EDP Renováveis 0,36
Stora Enso 1,02 Ence 0,72 Verbund 0,46
UPM 0,96 Sappi 0,63 Enel 0,72
IP 0,66 Suzanp 0,54 Northland Power 0,19
BU 0,90 0,77 Innergex 0,09
D/E 0,47 0,47 NHPC 0,46
BL 1,32 1,12 Aes Tiete 0,24
0,39
0,47
0,58
Indicator Value Rating Score Weight
Financial Leverage
Total Annual Revenue 0,40 B 7 6%
Product EBIT 2,00 Ba 10 5%
Geographic Segment Revenues 2,00 Ba 10 5%
Tolerance for leverage