Printed in Brazil - ©2005 Sociedade Brasileira de Química 0103 - 5053 $6.00+0.00
A
r
ti
c
le
* e-mail: [email protected]
Structural Impact of Hydroxyvalerate in Polyhydroxyalkanoates (PHA
scl) Dense Film
Monitored by XPS and Photothermal Methods
Marcelo G. da Silvaa, Helion Vargas*,a, Luiz H. Poleyb, Ruben S. Rodriguezb and Gilson B. Baptistac
a
Laboratório de Ciências Físicas and bLaboratório de Materiais Avançados, Universidade Estadual do Norte Fluminense, Avenida Alberto Lamego, 2000 Horto, 28015-620 Campos dos Goytacazes - RJ, Brazil c
Departamento de Física, Pontifícia Universidade Católica do Rio de Janeiro, Rua Marquês de São Vicente, 225 Gávea, 22453-970 Rio de Janeiro - RJ, Brazil
Filmes densos de poli(3-hidrobutirato) e poli(3-hidroxibutirato-co-3-hidroxivalerato) com espessuras de 90 µmforam obtidos utilizando o método “casting” de deposição e caracterizados por espectroscopia de fotoelétrons, calorimetria diferencial e métodos fotoacústicos. As frações molares de hidroxivalerato utilizadas foram de 8, 14 e 22 % molar. Seguindo uma mesma tendência, a capacidade térmica específica e a temperatura de transição vítrea diminuem com o aumento da concentração de hidroxivalerato.
Poly(3-hydroxybutyrate) and poly(3-hydroxybutyrate-co-3-hydroxyvalerate) polymer dense films with thickness of 90 µm were obtained by the casting method and characterized using X-ray photoelectron spectroscopy, differential scanning calorimetric and photo-thermal methods. The HV molar fractions in the copolymer structure were 8, 14 and 22 mol %. The measured specific thermal capacity and the glass transition temperature of the P3(HB-co-x%HV) decrease for increasing hydroxyvalerate content following a similar trend.
Keywords: polymers, photoacoustics, XPS, thermal properties
Introduction
In the last years, science and industry have given special attention to the development of biodegradable polymer materials as consequence of today ecological problems caused by most of the chemical and petrochemical
synthesized polymers disposed in the environment.1
Chemically and petrochemically synthesized polymers are generally resistant to enzymatic attack. Although some of these synthetic polymers can be microbiologically degraded, the process of degradation is slow in contrast to
the biodegradability of the polymers of biological origin.2
The biodegradability is not the only characteristic that makes the polymers of biological origin attractive, also their biosynthesis from renewable carbon sources, based on agricultural products, allows a sustainable closed process for the production and use of such polymers.
One important family of the biologically produced thermoplastic polyesters is formed by the polyhydroxyalkanoaes (PHAs). Important members of this
family are the P3HB and P(3HB-co-3HV)copolymers synthesized and intracellularly stored by numerous prokaryotes by well know fermentation process. The stereo-regularity of P3HB makes it a highly crystalline material
having melting point of 177 oC, close to that of
polypropylene among others similarities, although the
biopolymer is stiffer and more brittle.3,4
The P(3HB-co-3HV) chains also show crystalline
conformations and the co-monomer distribution is statistically random. The properties of the copolymers of 3HB and 3 HV changes depending on their HV contents.
The minimum of the melting point (≅80 oC,
pseudo-eutectic point) of the copolymers is observed for a 30%
mole fraction of HV.5,6
The accurate determination of the thermal properties of polymers and particularly of PHAs is of fundamental importance in many processes and engineering projects aiming at the expansion of the uses of these biodegradable materials. In the present work, the effect of HV contents in
the P(3HB-co-3HV) on the thermal and electronic
photoelectron spectroscopy to identify the different carbon species (molecular bonds) present in the molecular
structures of P(3HB) and P(3HB-co-3HV). In addition,
through the inspection of the photoelectron spectrum in the binding energy range, corresponding to the oxygen 1s electron contribution, the different oxygen species (molecular bonds) were identified. The identification of these different species for the oxygen supports the analysis presented for the carbon species reinforcing the presented conclusions.
Experimental
Bacterial polyhydroxyalkanoates, P3HB and P3(HB-co-x%HV), with 8, 14 and 22 mol percentages of 3-hydroxyvalerate (3HV) nominal contents (Aldrich Chemical Company, Inc) were purified by re-precipitation from chloroform into methanol (1:10 v/v).
Solvent-cast dense films of polymers were prepared by casting from 1 wt% chloroform solution previously filtered. The evaporation of the solvent from samples, prepared on 15 x 22 cm glass plates, was performed overnight in a closed glass chamber kept at 20 ºC of temperature and maintaining the solvent flow output controlled. These procedures required a careful control of evaporation to obtain a homogeneous dense film. After complete solvent evaporation, each film was stored under atmosphere conditions during 24h to complete the crystallization process. The thickness of the polymer
membrane samples were roughly (90.0 ± 0.5) µm (average
of 20 measurements).
Crystallinities were measured for as received films. They were performed with a wide-angle X-ray diffractometer
(Seifert-FPM model URD 65) using the nickel-filtered CuKα
radiation (λ = 0.1542 nm). Every scanning was recorded for
2θ varying from 5º to 40º. The degree of crystallinity was
obtained using Gauss curves to fit the diffractogram peaks and a broad Gauss curve representing the amorphous phase
(background).7 The areas ratio of the total diffractogram
peaks to the broad Gauss curve was taken as the degree of crystallinity. The structural measurements were made for samples aged for eight weeks at room temperature.
The Differential Scanning Calorimetry (DSC) data of polyesters were recorded on TA-Instruments DSC-2010
under nitrogen flow of 30 mL min-1. Initially, samples were
rapidly cooled to –150 oC and heated to 200 oC at heating
rate of 10 oC min-1. From this first scan, melting temperatures
and melting enthalpies were determined. After 1 minute at
this temperature, samples were rapidly cooled to –150 oC
and a second scan in identical condition was performed. Glass transition temperatures is determined by fitting an
exponential curve to the data and comparing to the curve obtained using equation 1.
The thermal capacity per unit of volume (specific
thermal capacity), ρcp (where ρ, is the mass density and cp,
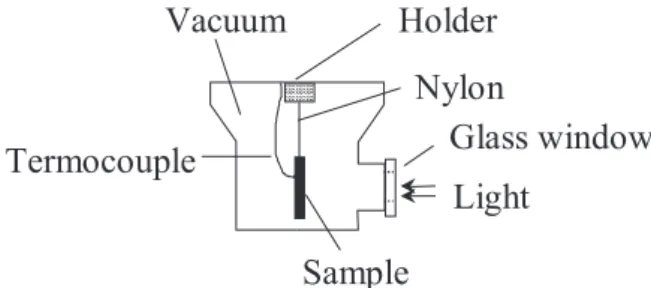
the specific heat at constant pressure), was measured using the temperature rise method under continuous white light illumination. A scheme of the experimental arrangement is shown in Figure 1. The samples were covered on both surfaces by a very thin layer of black paint. The samples were adiabatically suspended in a Dewar flask, which was
subsequently vacuum-sealed (~10-2 torr). Under these
conditions the main heat loss mechanism was by irradiation. The Dewar flask has a glass window allowing the focalization of the continuous white light beam onto one of the sample surfaces. A thermocouple was attached to the opposite sample surface using a thermal glue. Under this arrangement, the temperature variation of the sample back surface was monitored as a function of the time. The
surface temperature variation is given by: 8,9
∆T = (I0τ/lsρcp)(1 – e–t/τ) (1)
where I0 is the intensity of the incident light and
τ = ls ρcp/(2H) is the time constant; H = 4σT03 is the radiative
heat-transfer coefficient, σ is Stefan-Boltzmann constant
and T0 is the ambient temperature. The parameter τ is
determined by fitting an exponential curve to the data and comparing to the curve obtained using equation 1.
The chemical composition of the samples surface layers were studied using X-ray photoelectron spectroscopy (XPS). Taking into account the presence of carbon and oxygen in the molecular structure of both polymers studied, the spectral analysis were done in their core/level energy range. The photoelectron spectra were obtained with a VG ESCALAB MK II system, with a resolution of
1.0 eV approximately in the line 3d5/2 of the Ag, mounted
in a chamber holding pressures lower than 5×10⁻⁹ Torr.
The chamber is also equipped with a dual-anode Mg/Al X-ray source. During all the samples irradiation our attention was mainly focused to spectral lines corresponding to the C-1s and O-1s photoelectrons.
et al. J. Braz. Chem. Soc.
Results and Discussion
Bulk properties
The P(HB-xHV) polymers were characterized using an X-ray diffractometer. Table 1 shows a discrete decrease of crystallinity degree for samples with increasing HV content in the copolymer structure. The total reduction of crystallinity was about 7.6 %.
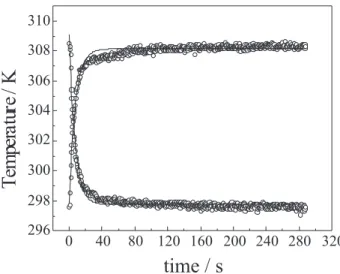
Figure 2 shows, for a PHB sample, the typical behaviour of the temperature variation when the sample is illuminated by white light. One observes that the temperature increases
reaching a saturation value around 308K. Figure 2 also
presentes the experimental results for the temperature variation after the light is turned off. Using Equation 1 to
describe this process, the characteristic time τ was
determined and consequently the value of the specific thermal capacity can be obtained. Similar experimental and evaluation procedures were applied in the analysis of all the samples.
The dependence of the specific thermal capacity as a function of the HV content (Figure 3) shows that the increment of HV content in the copolymer implies in a specific thermal capacity decrease from an initial value of
3.98 J cm-3 K-1, for P(3HB) homopolymer, to a final value
of 2.65 J cm-3 K-1, for the 22% mol of HV content
copolymer. This behavior can be explained as resulting from the impact of the polymer structure change, by the HV content sequence, onto the phase composition that should be reflected on an amorphous phase density, free volume and internal morphology of crystalline phase and consequently in the thermal properties (Table 1).
The density of the P3(HB-xHV) polymers with 0 to 22% HV content, decreases fundamentally due to the
amorphous phase contributions.10 In the crystalline phase,
it can be observed from the d-spacing measurements by X diffraction that, up to 29 mol % of the HV content sequence, the HV units are accommodated in the PHB crystal lattice (isomorphism) by small lateral expansion of the unit cell but the crystal packing (internal morphology) is disturbed
by inclusion of these HV units. 6,8-11 Additionally, NMR
evidence indicates that from 20-40% HV total contents in the copolymer structure, some segments with relative higher HV units, are partially excluded from the PHB
lattice. 12
From the polyhydroxyalkanoates data shown in Table 1, it can be inferred that the glass transition temperature (Tg), measured for copolymers with 14 and 22 mole % HV contents, were lower than the predicted by the Fox’s
equation (1/Tg = WPHB/Tg PHB + WHV/Tg HV, where W is the
content of the polymer). This conclusion confirms that segments with higher HV sequence accumulate preferentially in an amorphous phase. Melting temperature and the melting enthalpy values are presented in Table 1. In spite of a value of 140 J/g for the 8% of HV, the melting enthalpy decreases for higher content of the HV in the copolymer. Since the percent crystallinity is proportional to the melting enthalpy, the reduction of the energy enthalpy qualitatively reflects a decrease of the crystalline phase, being thus in agreement with the crystallinity degree tendency obtained by WAXS.
The results of the analysis of the trend of the specific thermal capacity versus HV content curve for the semi-crystalline poly 3-hydroxyalkanoates polymers can be explained considering two simultaneous contributions:
Figure 2. Time evolution of the sample temperature for two condi-tions: when the sample is illuminated by white light and when the light is turned off.
the decreasing of the amorphous density12 and the impact
of crystalline morphology, both affected by the HV mol % content in the copolymer structure. Depending on the HV distribution in polymer chains, polymer samples containing 0-37% of HV crystallize in the PHB lattice. It
was previously noted by Marchessault,13 Lauzier14 and,
recently by Menezes,15 a partial exclusion of HV units
from the PHB crystal lattice, increasing the contribution of HV to the amorphous phases. In particular, the higher changes observed for 14 and 22% HV contents can be explained by the additional contribution due to the inhomogeneous distribution of the HV sequence in the amorphous and crystalline phases.
Surface properties
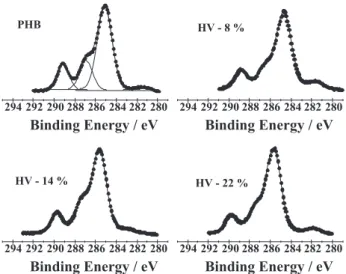
XPS experiments were mainly performed to identify the different chemical species of carbon and oxygen present in the molecular structure of the monomer found in the first layers of the sample. Selected photoemission spectra of the carbon 1s core level (C-1s) obtained for P(3HB) and
P(3HB-co-3HV) with 8, 14 and 22 mol % of HV contents
are shown in Figure 4. Three peaks corresponding to four carbon species present in the P(3HB) polymer samples
corresponding to binding energies around 285.1 (two unresolved states), 286.7, and 289.1 eV. The values for binding energies of these carbon species are well known
and can be found in the literature.16,17 The chemical species
in the molecular structure (Scheme 1) can be identified by association to the electro-negativity differences. The
known electro-negativity differences (∆x) in Pauling scale
C-H are: ∆x = 0.23, C-C: ∆x = 0.18 C-O: ∆x = 1.20; C=O:
∆x = 1.28 ,18 which justify qualitatively the chemical shift.
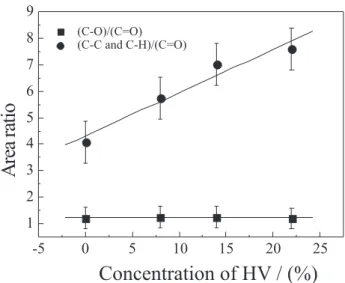
For increasing electro-negativity differences the binding energies also increase and therefore the peak at higher binding energy is associated to the C=O bond; the peak at 286.7 eV is related to C-O bond and the peaks at 285.1 eV are related to the following two bonds: C-H and C-C. The intensity ratio of the two latter bonds to the C=O bond further reinforces this interpretation. As the methyl unit is substituted by ethyl due to the increase of HV content, the relative intensity of the peaks corresponding to the C-H and C-C bonds increases. The quantitative analyses were performed by convolution of three Gauss-Lorenz curves. Figure 4 also shows the result for the fitted curves obtained for the polymer poly(3-hydroybuterate). Similar procedure was also followed for the three other co-polymers. As the content of the C=O bond species has to be kept constant for all polymers independent of the substitution of a methyl by an ethyl unit, and the energy position in the spectra corresponding to this bond is clearly separated from the other bonds (C-O, C-H and C-C), the area below the spectral peak for the C=O bond was used to normalize the spectrum in all the measurements; i.e., it was assumed that each area of the peak related to the C=O bond was equal to the unit and the full spectrum was corrected by the same factor. Figure 5 shows the HV content dependence for the ratio of the C-O species to C=O species (peaks area ratio obtained from Gauss-Lorentz curves) and for the ratio of the C-H and C-C species to C=O specie. As expected, the C-O amount keeps constant for increasing contents of HV and the sum of the C-H and C-C species increases. The linear fitting obtained for the experimental data points shows a high correlation between the peak area corresponding to those species and the content of HV. A correlation coefficient, r=0.98 was determined by linear regression
Table 1. P(HB-%HV) amorphous density of phase,11 crystalline degree, glass transition temperature, melting temperature and melting enthalpy
Sample Amorphous phase Crystallinity Glass transition Melting temperature Melting enthalpy
(HB-%HV) (%) density (g cm-3) (%) temperature (oC) (oC) (J/g)
00 1.18 6 4 2.7 176 100
08 1.17 6 2 -1.1 159 140
1 4 1.16 6 1 -4.0 151 04 3
2 2 1.15 5 9 -4.4 158 02 5
et al. J. Braz. Chem. Soc.
analysis for experimental results related to the H and C-C species. Taking into account the number of functional groups of carbon present in the molecular structure of the P(3HB) and P(3HV) monomers (Scheme 1), the ratio of C-O to C=C-O is equal to the unit, which agrees reasonably well with the obtained experimental value of 1.2 (Figure 5). On the other hand, the same statement does not apply to the relation between the content of C-H and C-C bonds and C=O bond. However, the experimental results lead us to conclude that impurities adsorbed on the surface of the sample should contribute to the observed total measured intensity of the C-H and C-C XPS peaks. Such impurities come from the preparation process and they are almost certainly related to the solvent used. Calculating the increase of the intensity of the C-H and C-C peak from a pure P(3HB) polymer to its co-polymer with 22% mol content of HV an increase of 46.1% is obtained. This value
agrees with that obtained by FTIR analysis,17 which shows
an increase of ca. 40% of the ratio of the IR absorbance of
the C-H band to the absorbance of the C=O band for the same HV content range. Other characteristics to be observed are the shifts of the binding energies to higher values for increasing values of the hydroxyvalerate content as shown is Figure 6. Similar shifts are observed for the three types of bonds, suggesting an effect of surface polarization (physical shift). This surface polarization can be attributed to the low electrical conductivity of polymer materials and, as a consequence, the transference of charge from the sample holder does not occurs quickly enough to avoid the surface polarization resulting from the hole left by the photoelectron. The lack of electrons on the surface layer of the sample produces a positive polarization that works
Figure 5. The HV content dependence for the ratio of the C-O species to C=O species (peaks area ratio obtained from Gauss-Lorentz curves) and for the ratio of the C-H and C-C species to C=O species.
as a potential barrier reducing the kinetic energy of the emitted electrons resulting in a shift of the photoelectron
peaks to higher binding energy in the spectra.19 This
binding energy shift is related to the increase of the amorphous phase in the polymer sample and consequently contributes to the reduction of the electrical conductivity. This result is also in good agreement with those obtained for the specific thermal capacity measurements.
XPS measurements were also made for the oxygen O-1s photoelectron energy range. A broad structure is observed corresponding to two chemical bonds: C-O and C=O. Since the binding energies for both oxygen species are very close one to the other it is not possible to resolve the two spectral peaks. The corresponding O-1s broad peak is centered at 533.3 eV for P(3HB) polymers. As for the case of carbon, a shift of the oxygen photoelectron peaks to higher biding energies of approximately the same amount was also observed in the results shown in Figure 6.
Conclusion
The presence of 3HV induces a decrease of the specific thermal capacity that can be explained as resulting from two simultaneous contributions: the decrease of amorphous density and the trend anomaly observed for P3(HB-22%HV) in the specific thermal capacity versus HV content curve, due to the inhomogeneous distribution of HV sequences in the crystalline and amorphous phases.
Figure 6. O-1s and C-1s binding energies dependence on the hydroxyvalerate content.
Using X-ray Photoelectron Spectroscopy (XPS) the four species of carbon bonds present in the monomer molecular structure were identified, their measured binding energies relative to the vacuum level are 285.1 eV (C - H and C – C bonds), 286.7 eV (C - O) and 289.1 eV (C = O) for P(3HB). The relative intensity of their respective peaks in the photoelectron spectra were quantified and the increase of the species C-H due to the addition of HV was monitored. Another observed effect was the shift toward higher values of the binding energies as function of the HV content. It is well known that this effect is related to the polarization of the surface due to the lack of charge transfer from the sample holder into the sample. This effect is enhanced for dense films with content of HV at 22% and agrees with the fact that those films have lower density as compared to the poly(3-hydroxybutyrate) polymer, which suggests a small electrical coupling between the monomers and, as consequence, a poor extra-molecular screening mechanisms of the core hole.
Acknowledgements
The authors thank CNPq, FAPERJ and FINEP for the financial support.
References
1. Ressy, C.S.K.; Ghai, R.; Kalia, V.C.; Bioresour. Technol.2003,
87, 137.
2. Steinbüchel, A.; Curr. Opin. Biotechnol.1992, 3, 291.
3. King, P.P.; J. Chem. Technol. Biotechnol.1982, 32, 2. 4. Holmes, P.A.; Phys. Technol.1985, 16, 32.
5. Marchessault. R.H.; Trends Polym. Sci.1996, 4, 163. 6. Bluhm, T.L.; Hamer, G.K.; Marchessault, R.H.; Fyfe, C.A.;
Verigin R.P.; Macromolecules 1986, 19, 2871.
7. Poley, H.P.; Siqueira, M.O.; Silva, M.G.; Sánchez, R.; Vargas, H; Polímeros: Ciência e Tecnologia2005, 15, 22.
8. Hatta, I.; Rev. Sci. Instrum.1979, 50, 292.
9. Vargas, H.; Miranda, L.C.M.; Phys. Rep.1988, 161, 43. 10. Kunioka, M.; Tamaki, A.; Doi, Y.; Macromolecules1989, 22,
694.
11. Skirbic, Z.; Divjakovic, D.; Polymer1996, 37, 505. 12. Mitomo, H.; Morishita, N.; Doi. Y.; Polymer1995, 36, 2573. 13. Bluhm, T.L.; Hamer, G.K.; Marchessoult, R.H.; Fyfe C.A.;
Macromolecules 1986, 19, 2871.
14. Lauzier, C.; Revol, J.F.; Marchessoult, R.H.; FEMS Microbiol.
Rev.1992, 103, 299.
15. Pereira, S. M. F.; Ph.D. Thesis, Universidade Estadual do Norte Fluminense - RJ, Brazil, 2002.
16. Kang, I.K.; Choi, S.H.; Shin, D.S.; Yoon, S.C.; Int. J. Biol.
Macromol.2001, 28, 205.
17. Ton-That, C ; Shard, A.G.; Teare, D.O.H.; Bradley, R.H.;
Polymer2001, 42, 1121.
18. Bratsch, S.G.; J. Chem. Educ.1988, 65, 34.
19. Briggs, D; Seah. M.P.; Practical Surface Analysis by Auger and X-ray Photoelectron Spectroscopy, Jonh Wiley & Sons: New York, 1983.
Received: September 8, 2004