Investigation of Eighth-Grade Students’
Understanding of the Slope of the Linear Function
Investigando a Compreensão de Alunos do Oitavo Ano
sobre a Inclinação de Funções Lineares
Osman Birgin*
Abstract
This study aimed to investigate eighth-grade students’ difficulties and misconceptions and their performance of translation between the different representation modes related to the slope of linear functions. The participants were 115 Turkish eighth-grade students in a city in the eastern part of the Black Sea region of Turkey. Data was collected with an instrument consisting of seven written questions and a semi-structured interview protocol conducted with six students. Students’ responses to questions were categorized and scored. Quantitative data was analyzed using the SPSS 17.0 statistical packet program with cross tables and one-way ANOVA. Qualitative data obtained from interviews was analyzed using descriptive analytical techniques. It was found that students’ performance in articulating the slope of the linear function using its algebraic representation form was higher than their performance in using transformation between graphical and algebraic representation forms. It was also determined that some of them had difficulties and misunderstood linear function equations, graphs, and slopes and could not comprehend the connection between slope and the x- and y-intercepts.
Keywords: Mathematics Education. Eighth-grade Students. Linear Functions. Slope. Misunderstandings.
Resumo
Este estudo tem como objetivo investigar as dificuldades de alunos quando tratando de
* PHD in Mathematics Education at Karadeniz Technical University, Turkey. Assistant Professor of
diferentes modos de representar a inclinação de funções lineares. Os participantes foram 115 estudantes de oitava série de uma cidade situada na parte leste da região do Mar Negro, na Turquia. Os dados foram coletados por meio de questionários escritos e complementados com um protocolo de entrevista semi-estruturada realizada com seis alunos. Os dados quantitativos foram analisados estatisticamente e para os qualitativos optou-se por uma análise descritiva. Verificou-se que o desempenho dos alunos em articular a inclinação da função linear usando sua forma de representação algébrica foi maior do que o desempenho nas questões relativas à articulação entre as formas de representação gráfica e algébrica. Outras dificuldades foram detectadas, como as relativas ao conceito de função linear e gráfico de funções; e a falta de entendimento sobre a conexão entre a inclinação e os pontos de interseção com os eixos.
Palavras-chave: Educação Matemática. Funções Lineares. Inclinação. Desempenho de Estudantes
1 Introduction
Linear functions are a complex, multifaceted idea whose power and richness permeate almost all areas of mathematics (LLOYD; WILSON, 1998). In school curricula, functions are taught at a fundamental level (line graphs, bar graphs, and circle graphs, etc.) until the secondary level, where this advanced topic is typically explored in depth (LEINHARDT; ZASLAVSKY; STEIN, 1990). In addition, it should be noted that the subject of functions is core for higher levels of both mathematics and other disciplines. Therefore, mathematics education reforms have called for changes in the ways that numerous topics, including the concept of functions, are taught. What students are expected to learn about functions and their graphs is not only single computational fluency, but also, as described in the Principles and Standards for School Mathematics (NCTM, 2000), the analyses of functions, both quantitative and qualitative, with conceptual understanding as a key goal for students’ learning. Furthermore, NCTM (2000) explains that knowledge of functions is a central component of learning about algebra that should be emphasized throughout students’ school years beginning in the elementary grades.
not necessarily correspond to that in another representation, but the ability to translate among varied formats is necessary to effectively interpret problem situations (JANVIER, 1981; MOSCHKOVICH, 1996). Today, the students are expected to learn functions and their graphs with single procedural knowledge, and they are supposed to have a conceptual level of understanding and to carry out broader tasks such as quantitative and qualitative analyses.
Linear functions can be depicted using a variety of representational systems, of which the three most common are equations, tables, and graphs. Students need to be able to understand information presented in these different formats and to perform transitions among the various representations. Understanding the linear function concept is remarkably complex and involves many levels of abstraction (SHERIN, 2002). Therefore, linear functions are a complex domain where the development of interconnections of conceptual knowledge is essential for competence. Conceptual understanding of the domain of linear functions, including much more the procedural learning, involves understanding the connections between the graphical and algebraic representations (CHIU et al., 2001).
not apply the Cartesian connection to translate a graphical representation to an algebraic one. Instead, students preferred to move in the opposite direction, from algebraic to graphical representations. In his study conducted with 135 10th-grade students, Acuna (2007) also found that although most students seemed to make a successful identification of the slope and the y-intercept using a construction easily recognizable by its graphic shape, this identification seemed to be different in other kinds of tasks, such as predicting or explaining.
2 The concept of slope
One of the defining attributes of linear functions is the concept of slope. The slope of linear functions represents the rate of change in one variable that results from a change in the other variable. Because linear function is represented geometrically as a line, the rate of change and the slope of the line are constant. The slope of linear functions may be represented in several forms. Slope is defined geometrically as a property of a line; given two points (x1, y1) and (x2, y2), the slope of the line is (y2 - y1)/(x2 - x1), with slope as the ratio (rise/run). Horizontal lines have a slope of zero, and the slope of vertical lines is undefined. When functions are represented as a linear equation, slope is the m in the equation
y = mx + b, called the slope-intercept form, and we can determine the slope of
the line just by looking at the equation. However, when a linear equation is written such as ax + by + c = 0, some algebraic manipulation is required in order to determine the slope. Slope is also used to describe the steepness of physical objects such as the ratio of the change in y to the change in x of the line. Thus, the slope of a linear function is represented in geometric, algebraic, physical, trigonometric, functional, and ratio terms. However, traditional mathematics curricula tend to separate and isolate the learning of arithmetic, algebra, geometry, trigonometry, and functions; it is questionable whether students make connections among these various conceptions of slope and recognize them as representations of same concepts (STUMP, 1996).
versus time or quantity versus cost (STUMP, 2001). In this study, we focused on slope as a measure of rate of change in terms of the linear function topic in the eighth-grade mathematics curriculum in Turkey.
Research has noted that students had difficulties and misconceptions associated with the concept of slope. Some studies have focused on students’ understanding of slope within abstract contexts (LEINHARDT et al., 1990; ZASLAVSKY et al., 2002) and others on real-world contexts (NEMIROVSKY, 1997; STUMP, 2001). There are misconceptions associated with the calculation of slope, and when it is represented in decimal form, students have trouble considering slope as a ratio (BARR, 1980; STUMP, 1996; 2001). They also have difficulty interpreting linear functions and their graphs (BARR, 1980, MOSCHKOVICH, 1996; NATHAN; KIM, 2007; SCHOENFELD; SMITH; ARCAVI, 1993), connecting graphs to linear equations (Acuna, 2007; Birgin, 2006), and connecting graphs to the notion of rate of change (BELL; JANVIER, 1981; LEINHARDT et al., 1990; ORTON, 1984).
The concept of slope can pose challenges for students when they must translate between different representations (MOSCHKOVICH, 1996; SCHOENFELD et al., 1993; SMITH; ARCAVI; SCHOENFELD, 1989). There is confusion between the role of m and b when a function is written in the form
y = mx + b. It may be difficult for students to consider the slope as ratio if m is
determined that the order of preference in recognizing the line formulas was horizontal, vertical, line with positive slope, and line with negative slope.
Stump (2001) found that the students demonstrated a better understanding of slope as a measure of rate of change than as a measure of steepness. The students in this investigation also exhibited a limited understanding of slope as a measure of steepness. They had trouble considering slope as a ratio. This study suggested a gap in students’ understanding of slope as a measure of rate of change and implied that instruction should be focused on helping students form connections among rates involving time, rates involving other variables, and graphical representations of these relationships. In a case study, Zazlavsky et al. (2002) also pointed out that some 11th-grade students have experienced much confusion regarding the connections between the algebraic and geometric aspect of slope, scale, and angle.
This study focused on the concept of slope and its importance as a defining parameter of a linear function. Although many research studies have investigated secondary students’ and mathematic teachers’ knowledge of functions (ZAZLAVSKY et al., 2002; STUMP, 1996; 2001; ; GÜVEN, 2004), a search of literature reveals no evidence regarding eighth-grade students’ knowledge of the concept of slope. The misconceptions and deficiencies of the students in linear functions also may lead to severe learning difficulties in the subjects of functions, limit, derivation, and integral through high school and the university years. For this reason, determination of students’ understanding and competence in the connection between linear functions and their graphs seems to be important. So, this study aimed to investigate eighth-grade students’ understanding and difficulties regarding the slope of linear functions. The anticipated benefits of this study include contribution to the literature on eighth-grade students’ knowledge and misconceptions about the slope of a linear function. Especially, this study also reveals the negative impact of traditional mathematics teaching approaches to students’ learning in the slope of a linear function. In this context, the following research questions were determined:
3 Method
3.1 Participants
The participants in this study were 115 eighth-grade students from a public school in Trabzon, which is a city in the eastern part of the Black Sea region of Turkey. In Turkey, primary education, as a compulsory education, is intended for pupils aged 6 to 14 years. It is divided into two stages. The first stage consists of grades 1–5, and the second stage consists of grades 6–8. Formerly, middle schools were responsible for education in the second stage. In 1997, the duration of compulsory education was extended from five to eight years, and middle schools were integrated into the primary school system. Besides, eighth grades were seen as a particularly important grade in Turkey’s context because Turkish students have some crucial national exams for their education and careers at this grade level. In addition, the slope of straight line concept under investigation in the study was taught in this grade level. Hence, eighth-grade students were selected as the study group. The students were between 14 and 15, and the 115 participants consisted of 62 males and 53 females.
3.2 The contexts of the study
concept. Students were made aware of the procedures to be followed and rules to be obeyed during the lesson. They were given the opportunity to ask questions about points they did not understand, and short summaries were made available from the lecturer after every subject. After lecturing, the teacher asked the students to answer the questions at the end of the unit.
3.3 Instruments
An instrument, consisting of seven questions needing written answers, was used as a data collecting tool (see Appendix 1). Questions were related to analyzing and interpreting specific mathematical situations involving verbal, graphical, or algebraic representations of function. The questions of the instrument were primarily about understanding of the algebraic representation (UAR) of the slope (Q1a, Q1b, Q2a, Q2b), transferring from algebraic to graphical representation (TAGR) of the slope (Q3a, Q3b, Q4b, Q4d), and transferring from graphical to algebraic representation (TGAT) of the slope of linear function (Q5, Q6, Q7a, Q7b). That is, questions were related to translation from modes of one representation of slope to another so as to find the slope of linear functions given the algebraic representation form, to find the slope of line given the graph, and to sketch the graph of the line given the slope. The questions were prepared considering the gains mentioned in the eighth-grade mathematics curriculum in Turkey. For this reason, other types of representations were not covered. In order to ensure the content validity of the instrument, two mathematics teachers and three field experts were consulted.
3.4 Data collection and analyzes
The developed instrument was employed for 115 eighth-grade students. Students’ answers to each item were coded into categories such as “correct
answer (CA),” “partly correct answer (PCA),” “incorrect answer (IA),” or
“no answer (NA).” The categories assigned to the answers denoted the following
meanings: correct answer—the explanation, operation, or the solution strategy is scientifically true; partly correct answer—the explanations are true but not sufficient, the solution is true but partially flawed; incorrect answer—the explanations given as answers are unrelated, illogical, or flawed; no answer—
the question is not answered. In order to provide coding reliability, the answers to the questions were coded by two different researchers independently, and afterwards these codes were compared and a consensus was attained on the categories. Cohen’s kappa coefficient is a statistical measure of inter-rater agreement for qualitative (categorical) items (Cohen, 1960). Therefore, in this paper, we utilize the kappa coefficient to measure the agreement between coders, and the agreements between coders were found to range between 82% and 95% for each item. The categories were also scored from 0 to 2 as follows: 2 points for “correct answer,” 1 point for “partial correct answer,” and 0 point for “incorrect answer” and “no answer.” The SPSS 17.0 statistical software was used to analyze the quantitative data, using cross tabulations, one-way analysis of variance (ANOVA) for repeated measure and the Bonferroni post hoc technique.
In this study, the interviews were audio recorded, and the audiotapes together with the students’ worksheets were transcribed. As recommended by Strauss and Corbin (1990), students’ responses to the interview tasks were analyzed and coded around the research’s problem. Each interview was outlined, summarized, and evaluated using categories such as the open-ended question in the instrument. In addition, a couple of examples of student mistakes were presented. Moreover, the extracts from the interviews and students’ worksheets were given in English in this study. These were translated from Turkish.
4 Results
4.1 Students understanding of graphical and algebraic representations of the slope of linear functions
the slope of the linear function and the representation mode of slope are given in Table 1 and Table 2. As shown in Table 1, students mostly answered correctly question Q1a (75.7%) on finding the slope of the 5x - y + 3 = 0 (M = 1.59, SD
= .75). Although question Q1b (related to finding the slope of the 2y - 3x = 0) was similar to Q1a, only 59.1% of the students answered question Q1b correctly. Here, in finding the slope of the line equation given in the algebraic representation form as ax + by + c = 0, it can be noticed that many students perceived the coefficient of “x” as slope, as is the case in the form y = mx + b. This finding suggests that most students made mistakes in finding the slope of the line given in the algebraic form “ax + by + c = 0” and they lacked conceptual understanding.
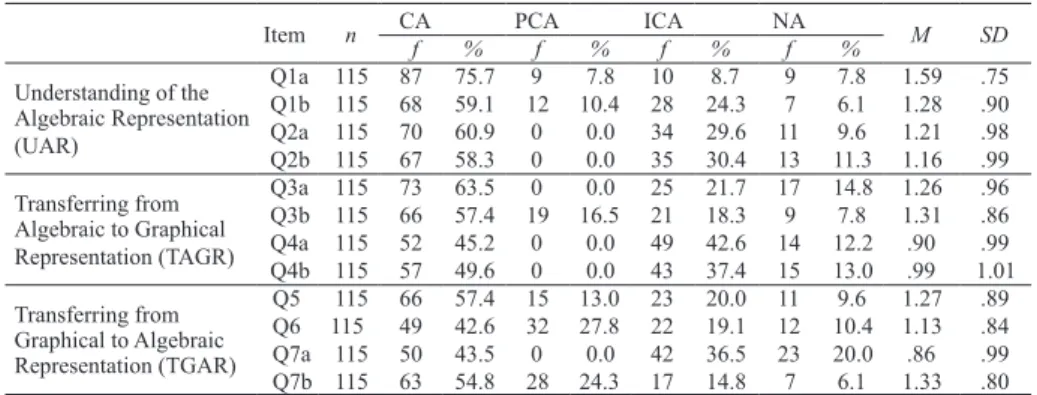
Table 1 - Descriptive statistics related to question items
On the other hand, the questions that were answered correctly by the least number of students were questions Q6 (42.6%), Q7a (43.5%), and Q4a (45.2%). Among these questions, question Q6 compares the slopes of the line graphs that pass through the origin differently, question Q7a shows the slope angle of a line that passed through two points other than the origin and whose graph was given, andquestion Q4a represents a line with a slope of m = - 1
graphically. Based on these results, it can be claimed that students had difficulty in transferring between the graphical and algebraic representation forms in finding the slope of line.
30% gave incorrect answers, and 12% gave no response for questions requiring transferring from algebraic to graphical representation (TAGR) of the slope of line (M = 1.12, SD = .88). For the questions requiring transferring from graphical to algebraic representation (TGAR) of the slope of line, 49.6% of students gave correct answers, 16.3% of them gave partially correct answers, 22.6% gave incorrect answers, and 11.5% left the questions blank (M = 1.15, SD = .82).
Table 2 - Descriptive statistics of the students’ performance on the questions about the representation mode of slope
According to Table 2, it can be stated that the most successful point for the students was understanding of the algebraic representation of the slope of line (M = 1.31, SD = .85), whereas the least successful areas were transferring from algebraic to graphical representation (TAGR) and from graphical to algebraic representation (TGAR) of the slope of line. One-way ANOVA for repeated measures was used to compare the students’ competence in representation modes of the slope of line. As seen in Table 3, results of ANOVA showed that there was a significant difference for students’ competence in representation modes of slope of line [F (1, 114) = 234.21, p < .001]. Bonferroni post hoc analyses in Table 4 also showed that competence scores of the students in UAR (M = 1.31,
SD = .85) were significantly higher than competence scores of the TAGR (Mean
differences = .193, SE = .029, p < .01) and TGAR (Mean differences = .161,
Table 3 - Results of One-way ANOVA
Table 4 - Pairwise comparisons
4.2 Students’ difficulties and misconceptions of the slope of linear functions
In this section, the students’ misconceptions and mistakes regarding the slope of linear functions are given in detail. QuestionsQ5, Q2b, and Q4b are related to articulating the slope of a line in forms of y = a, x = b; (where a and
b are real numbers). As seen in Table 1, the percentages of CA categories related to these questions are 57.4% (Q5), 58.3% (Q2b), and 49.6% (Q4b), respectively. Thus, it can be said that some students have misconceptions and mistakes about the slope of a line that is parallel to the y-axis and x-axis in a Cartesian coordinate plane. For example, some students responses to question
Q5 were “Slope of a line given in the form of x = -2 is zero. Because this
line is parallel to y-axes.” “Slope of a line given in the form of y = mx + b
is the coefficient of x. Therefore, slope of a line given in the form of x = -2
is -2. Because, coefficient of x is -2.” Interview data related to question Q5
also showed that two students (S1, S3) had serious confusion about the slope of a line. Furthermore, S3 had a misunderstanding about the angle concept as
“Tangent of an angle is not to be negative.”
R : Researcher S: Student
R : What is the slope of line given in the form of x = - 2?
S 1 : Zero
S 1 : The slope of line parallel to y-axis is zero.
R : Why? Can you explain?
S 1 : I don’t know…This is a rule.
R : What do you remember about the slope of line?
S 1 : It shows the aspect of the line and where the line is (first region (+), second region (-)).
…
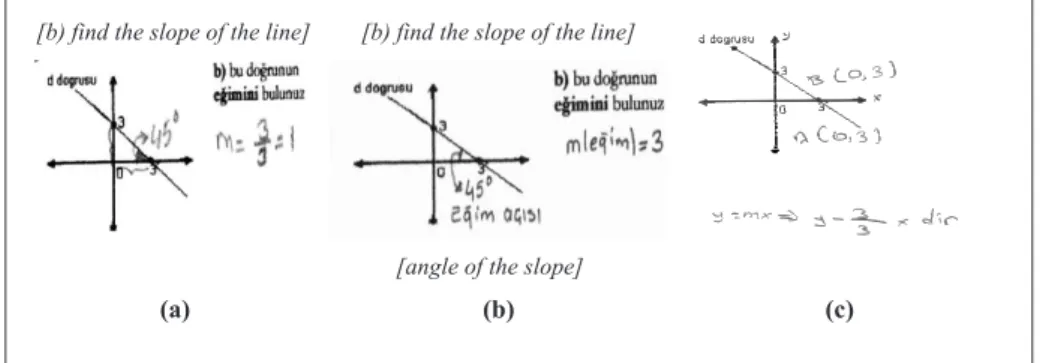
R : What is the slope of line given in the form of x = - 2?
S 3 : Its slope is zero. Because the slope is equal to tan (
α
), hence= 900, tan(90º) = 0 .
R : Is the slope of a line parallel to x-axis always zero?
S 3 : I am not sure.
R : What is the slope of the line given form of y = - 2?
S 3 : The slope of line parallel to x-axis is undefined.
R : Why?
S 3 : The slope of line is equal to the tangent of angle between its graph and the horizontal axis. But, line d passes through the point (0, -2) and its algebraic form is y = - 2. Because of not being the negative tangent of the angle, its slope is undefined.
in finding the slope of the line starting from the graph. The students also face challenges in relating m, x-intercept and y-intercept in an algebraic representation
as y = mx +b.
Figure 1 - Samples of the misunderstanding of students related to question Q7
Question Q6compares the slopes of the lines across the origin differently and whose graph is given. As seen in Table 1, only 42.6% of students could correctly state the slope of lines. The percentage of the PCA, ICA, and NA categories are 27.8%, 19.1%, and 10.4%, respectively. It is seen in Figure 2(a) that few students misunderstood the angle of slope and the slope of linear functions such as “when the measurement of the angle of slope increases, the slope of
lines that pass through the origin is bigger.” As seen in Figures2(b) and 2(c),
some students misunderstood about the slope of line such as “the slope of line
that passes through the origin is same and zero.” Similarly, student S5 gave
an explanation related to question Q6 as “slope of these lines are zero, because
these lines cross the origin,” and student S2 who gave equal as the answer
offered an explanation as “all lines cross the origin.”
For questions Q4a (a line with a slope is -1) and Q4b (a line with a slope is zero), students had to draw a line in a Cartesian coordinate plane. According to Table 1, the percentage of students who gave correct answers to questions Q4a and Q4b were 45.2% and 49.6% respectively. Some of them who gave incorrect answers to question Q4a, stated a line with a slope of -1 as the line passing through the point (-1, 0) as in Figure 3(a) or as the ratio between y- and
Figure 2 - Samples of the misunderstanding of students related to question Q6
Figure 3 - Sample of the graphs of students related to Q4a and Q4b
Questions Q1a and Q1b were directed to the students so that they could find the slope of the line given in an algebraic equation as ax + by = 0 and ax +
by + c = 0. As seen in Table 2, most of students (75.7%) did correctly state the
accurate answer to question Q1a (find the slope for 5x - y + 3 = 0), whereas 59.1% of students correctly stated the accurate answer to Q1b (find the slope
for 2y - 3x = 0). Most of the students giving incorrect answers to question Q1b
were found to define the slope of the line 2y - 3x = 0 as the slope of line of 2y
- 3x = 0 is - 3. For example, one student (S3) gave an explanation as “2y - 3x
= 0, 2y = 3x, the coefficient of x shows its slope, and it is 3”. These findings
showed that a number of students did not learn the concept and merely memorized the algebraic representation of y = mx + b.
5 Discussion and conclusion
connections, and representations of the slope of linear function and their graphs rest on the development of conceptual knowledge (CHIU et al., 2001). The misconceptions and deficiencies of the eighth-grade students in understanding the slope of a line also may lead to severe learning difficulties in the subjects of functions, limit, derivation, and integral at the high school. For this reason, this study was conducted with eighth-grade students to determine their competencies, understandings, challenges, and mistakes regarding the slope of a linear function. In this study, it was determined that most students (75.7%) accurately answered question Q1a (find the slope of 5x - y + 3 = 0), whereas 59.1% of them accurately answered question Q1b (find the slope of 2y - 3x = 0). Some of them answered question Q1b as: “The slope of 2y - 3x = 0 was -3. Because the slope of a line that was given in algebraic form y = mx + b was
coefficient of x.”This result showed that nearly 40% of students had superficial
knowledge and merely memorized the slope of a line that was given in the algebraic representation form ax + by + c = 0. On the other hand, it was found that some students had serious mistakes about the concept of the slope angle of a line (as seen in Figures 2-3) because of their deficient or incorrect information. In particular, some of the students made mistakes mostly in cases where the tangent of angle of inclination of a line is negative (Q2a, Q4, Q6, and Q7). These findings confirmed the findings of Kondratieva and Radu (2009). They found that students enrolled in a precalculus university course more correctly recognized formulas for lines with positive slope than for lines with negative slope. Moreover, this study revealed that some students had difficulties in ordering the points [(x1, y1) and (x2, y2)] for computing the slope of a line (m = rise/run) as seen in Figure 1(a). This finding is consistent with the findings of Bar (1980).
confusion existed regarding the connection between the algebraic and geometric aspects of slope of a line. According to these findings, it can be said that placing more importance on applications could enhance procedural learning in the teaching process.
Similarly, the results of a sound body of research align with this study in finding that moving from a graph to an equation and vice versa are more difficult. In this context, many research studies indicated that students have difficulty interpreting linear functions graphs (BIRGIN, 2006; MOSCHKOVICH, 1996; 1999; NATHAN; KIM, 2007; PADILLA; MCKENZIE; SHAW, 1986; SCHOENFELD et al., 1993), connecting graphs to linear equations (KERSLAKE, 1981; MARKOVITS et al., 1983; ZASLAVSKY et al., 2002), and connecting graphs to the notion of slope (BELL; JANVIER, 1981; LEINHARDT et al., 1990). They had difficulty translating among the different representations of linear functions, and they do not appreciate the overall structure of the function concept. For example, Padilla et al. (1986) found that students in grades 7 through 12 were most successful with plotting points and determining the x and y
coordinates of a point, while the most difficult skills appeared to be scaling axes and using a line of best fit. Kerslake (1981) found that while many 13- to 15-year-olds were able to read information from a graph or to plot given data, relatively few were able to understand the connection between an equation and a graph. Markovits et al. (1983) also found translation from graph to equations to be more difficult than the reverse when the functions were familiar. When the function was less familiar translations in both directions were found to be equally hard (cited in LEINHARDT et al., 1990).
perceived slope mostly in geometric means and had a scarce understanding of algebraic, trigonometric, and functional representations. Therefore, some studies (NATHAN; KIM, 2007; RIDER, 2004) stated that students’ understandings may be raised to the conceptual learning level by making reference to different types of representations. When using different types of representations, no single one should be preferred and each of these representations should be encouraged by demonstrating the relationships between them.
This study also indicated that most students, especially at poor and middle academic achievement levels, had mostly procedural learning rather than conceptual learning and demonstrated a range of mistakes and misunderstanding about linear function equations, graphs, and slope concepts. Some students were confused regarding algebraic and geometrics aspects of slope, and misunderstood about the tangent of angle and slope of linear functions. In this study, eighth-grade students’ mistakes and difficulties can be explained with teacher-centered instruction such as describing the definition and the rule and making drills. The participants in this study were taught by traditional teaching methods that were still dominant in the Turkish education system. Similarly, Noss and Baki (1996) stated that mathematics teachers’ priorities in Turkey were to follow the textbook; to spend the majority of their time lecturing to students using the blackboard; to stress algorithms, rules, definition, axioms, and to memorize formulas. Indeed, some studies (BAKI; ÖZTEKIN, 2003; BIRGIN; KUTLUCA, 2007) in Turkey also stressed that preferred teacher-centered approaches in the instruction of linear functions and graphs and technology were hardly used.
recommends the following curricular changes. Graph-to-equation translations and vice versa should be mostly emphasized in instruction and textbooks. The curriculum should also include spoken-language and real-world situations and specific activities such as representations to tables, graphs, and equations.
The results of this study indicated that many eighth-grade students had a limited understanding of the representation mode of the slope of a linear function. Their understanding about the slope was dominated by algebraic representations, while transformation between graphical and algebraic representations of slope was less understood. Therefore, students should be provided with the opportunity to view many graphs and their corresponding equations and to examine the relationship between graphical representations and algebraic parameters. In this context, many studies stated that computer technology could be used for translations between graphical and algebraic representations (BAKI, 2002; BIRGIN; KUTLUCA, 2006; LLOYD; WILSON, 1998; MOSCHKOVICH, 2004). Because many computer technologies, software programs, and graphical calculators open up the possibility of more visual constructions, and linking the graphical and algebraic representations of functions and graphs can be also generated quickly by the computer, freeing the student from the burden of calculating, plotting, and drawing. Under the dynamic environment, students can also change the slope and the y-intercept of the straight line by changing the values of m and b. Moreover, research conducted at the 10th grade level also showed that students exposed to computer-assisted instruction outperformed and learned the concepts and translations between a variety of the representation modes related to linear functions and its graphs better than via traditional instructions methods (BAKI; ÖZTEKIN, 2003; BIRGIN, KUTLUCA; GÜRBÜZ, 2008; CHIU et al., 2001; ISIKSAL; ASKAR, 2005; MOSCHKOVICH, 2004). Based on these results, this study recommended that some of the mathematics and geometry software programs such as Coypu, Drive, GeoCebra, or Sketchpad be used in order to enhance the students’ conceptual learning and to overcome their learning difficulties and misconceptions about linear functions and graphs.
References
ACUNA, C. Use of slope and y-intercept in prediction and description, as seen from students’ perspective. In: CONFERENCE OF THE EUROPEAN SOCIETY FOR RESEARCH IN MATHEMATICS EDUCATION, 3rd, 2007, Bellaria. Proceedings…
BAKI, A. Bilgisayar destekli matematik . Ankara: Ceren . 2002.
BAKI, A.; ÖZTEKIN, B. Teaching functions through Excel. Gazi University Kastamonu Education Journal, Turkey, v. 11, n. 2, p. 325 - 338. 2003.
BARR, G. Graphs, gradients and intercepts. Mathematics in School, London, GB, v. 9, n. 1, p. 5 - 6. 1980.
BELL, A.; JANVIER, C. The interpretation of graphs representing situations. For the Learning of Mathematics, Montreal, Canada, v. 2, n. 1, p. 34 - 42. 1981.
BIRGIN, O.; KUTLUCA, T.; GÜRBÜZ, R. The effects of computer-assisted instruction on the students’ achievement in mathematics at seventh grade. In: INTERNATIONAL EDUCATIONAL TECHNOLOGY CONFERENCE8th, 2008, Ankara.
Proceedings…Ankara: Nobel Press. 2008. p. 879 – 882.
CARPENTER, T. P.; CORBIT, M. K.; KEPNER, H. S.; LINDQUIST, M. M.; REYS, R. E.
Results from the second mathematics assessment of the National Assessment of Educational Progress. Reston, VA: National Council of Teachers of Mathematics. 1981
CHIU, M. M.; KESSEL, C.; MOSCHKOVICH, J.; MUNOZ-NUNEZ, A. Learning to graph linear functions: a case study of conceptual change. Cognition and Instruction, Mahwah, NJ, v. 19, n. 2, p. 215 - 252. 2001.
DAVIS, J. D. Real-world contexts, multiple representations, student-invented
terminology, and Intercept. Mathematical Thinking and Learning, England, v. 9, n. 4, p. 387 - 418. 2007.
EISENBURG, T. On the development of a sense for functions. In: HAREL, G.; DUBINSKY, E. (Eds.), The concept of function: Aspects of epistemology and pedagogy. Mathematical Association of America. 1992. p. 153 - 174, v. 25.
GRAHAM, T.; SAHARP, J. An investigation into able students’ understanding of motion graphs. Teaching Mathematics and its Applications, Oxford, Inglaterra, v. 18, n. 3, p. 128 - 135. 1999.
HITT, F. Difficulties in the articulation of different representations linked to the concept of function. Journal of Mathematical Behavior, Norwood, NJ, v. 17, n. 1, p. 123 - 134. 1998.
ISIKSAL, M.; ASKAR, P. The effect of spreadsheet and dynamic geometry software on the achievement and self-efficacy of 7th grade students. Educational Research,
Oxfordshire, Inglaterra, v. 47, n. 3, p. 333 - 350. 2005.
JANVIER, C. Use of situations in mathematics education. EducationalStudies in Mathematics, Dordrecht, Holanda, v. 12,p. 113 - 122. 1981.
,Ý.; GÜVEN B. The development of function concept in different levels of students. Eurasian Journal of Educational Research, Turkey, v. 16, p. 64 - 73. 2004.
KERSLAKE, D. Graphs. In: HART, K. (Ed.), Children’s understanding of mathematics: 11-16. London: John Murray, 1981. p. 120 - 136.
KNUTH, E. J. Student understanding of the Cartesian connection: an exploratory study. Journal for Research in Mathematics Education, Reston, Va, v. 31, p. 500 - 507. 2000.
KONDRATIEVA, M. F.; RADU, O. Fostering connections between the verbal, algebraic, and geometric representations of basic planar curves for student’s success in the study of mathematics. The Montana Mathematics Enthusiast, USA, v. 6, n. 1-2, p. 213 - 238. 2009.
LLOYD, G. W.; WILSON, M. Supporting innovation: the impact of a teacher’s conceptions of functions on his implementation of a reform curriculum. Journal for Research in Mathematics Education, Reston, Va, v. 29, n. 3, p. 248 - 274. 1998.
MARKOVITZ, Z.; EYLON, B.; BRUKHEIMER, M. Functions: Linearity
unconstrained. In: INTERNATIONAL CONFERENCE OF THE INTERNATIONAL GROUP FOR THE PME, 7th, 1983, Rehovot, Israel.Proceedings… Rehovot, Israel:
Weitzman Institute. 1983. p. 271 - 277 (HERSHKOWITZ, R. (Ed.)).
MEVARECH, Z. R.; KRAMARSKY, B. From verbal descriptions to graphic representations: stability and change in students’ alternative conceptions.
Educational Studies in Mathematics, Dordrecht, Holanda, v. 32, n. 1, p. 229 - 263. 1997.
MOSCHKOVICH, J. Moving up and getting steeper: negotiating shared descriptions of linear graphs. The Journal of the Learning Sciences, Mahwah, NJ, v. 5, n. 3, p. 239 - 277. 1996.
MOSCHKOVICH, J. Students’ use of the x-intercept as an instance of a transitional conception. Educational Studies in Mathematics, Dordrecht, Holanda, v. 37, p. 169 -197. 1999.
MOSCHKOVICH, J. Appropriating mathematical practice: a case study of learning to use and explore functions through interaction with a tutor. Educational Studies in Mathematics Dordrecht, Holanda, v. 55, p. 49 - 80. 2004.
NATHAN, M. J.; KIM, S. Pattern generalization with graphs and words: a cross-sectional and longitudinal analysis of middle school students’ representational fluency. Mathematical Thinking and Learning, England, v. 9, n. 3, p. 193 - 219. 2007.
NCTM. Principles and standards for school mathematics. VA: Reston. 2000.
NEMIROVSKY, R. On mathematical visualization and the place where we live.
Educational Studies in Mathematics, Dordrecht, Holanda, v. 33, p. 99 - 131. 1997.
NOSS, R.; BAKI, A. Liberating school mathematics from procedural view. Journal of Education Hacettepe University, Turkey, v. 12, p. 179 - 182. 1996.
ORTON, A. Understanding rate of change. Mathematics in School, London, GB, v. 13, n. 5, p. 23 - 26. 1984.
RIDER, R. L. Using the SOLO taxonomy to evaluate student learning of function concepts in developmental algebra. In: NORTH AMERICAN CHAPTER OF THE INTERNATIONAL GROUP FOR THE PSYCHOLOGY OF MATHEMATICS EDUCATION, 2004, Toronto, Canada. Proceeding…Toronto, Canada: Ontario Institute for Studies in Education of University of Toronto. 2004.
RIZZITU, J. M. Students’ conceptualizations of mathematics functions: the effect of a pedagogical approach involving multiple representations.1991. Thesis (Doctoral in Mathematics Education) - Cornell University, Ithaca, NY, 1991. (52-10A, 3549).
SCHOENFELD, A. H.; SMITH, J. P.; ARCAVI, A. Learning: the microgenetic analysis of one student’s evolving understanding of a complex subject matter domain. In: GLASER, R. (Ed.), Advances in instructional psychology. Hillsdale, NJ: Lawrence Erlbaum. 1993. p. 55 - 175, v. 4.
SHERIN, M. G. When teaching becomes learning. Cognition and Instruction, Mahwah, NJ, v. 20, n. 2, p. 119 - 150. 2002
SMITH, J.; ARCAVI, A.; SCHOENFELD, A. H. Learning y-intercept: assembling the pieces of an atomic concept. In: INTERNATIONAL CONFERENCE ON THE PSYCHOLOGY OF MATHEMATICS, 13th, 1989, Paris. Proceedings… Paris, France:
International Group for the Psychology of Mathematics Education.1989. p. 174 - 181, v. 3.
STRAUSS, A.; CORBIN, J. Basics of qualitative research: Grounded theory procedures and techniques. London: Sage. 1990.
STUMP, S. L. Secondary mathematics teachers’ knowledge of the concept of slope.
1996. Thesis (Doctoral in… area of doctoral) - Illinois State University, Illinois. 1996.
STUMP, S. L. High school precalculus students’ understanding of slope as measure.
School Science and Mathematics, Menasha, Wis., US, v. 101, p. 81 - 89. 2001
ZASLAVSKY, O.; SELA, H.; LERON, U. Being sloppy about slope: the effect of changing the scale. Educational Studies in Mathematics, Dordrecht, Holanda, v. 49, p. 119 - 140. 2002.