Contexto Internacional vol. 39(2) May/Aug 2017 http://dx.doi.org/10.1590/S0102-8529.2017390200010
Land Market and Land Grabbing in
Brazil during the Commodity Boom
of the 2000s
Georges Flexor* Sergio Pereira Leite**
Abstract: his article analyses the determining factors afecting the land market in Brazil in an international context where the availability of natural resources, essential to satisfy the population worldwide, is again heading the agenda. his scenario provoked a rapid expansion of agribusiness and enhanced international participation based on the relative abundance of natural resources. he irst part of this article presents the spatial dynamics surrounding the production of commodi-ties and gives evidence of the sharp increase in land price in Brazil. he second part attempts to understand the factors that afect price dynamics and subsequent efects over capital allocation in the sector, addressing the impact of the recent boom of commodities and rising interest by foreign actors in Brazilian land. he conclusion elaborates on the possible land pricing developments and political unfolding.
Keywords: Natural Resources; Land; Land Grabbing; Commodities; Agribusiness.
Due to the sharp increase in the price of agricultural commodities since 2005, the is-sue surrounding the availability of natural resources essential to satisfy the needs of the population worldwide, such as land and water, is back on the international agenda. hus, countries where such resources are more abundant, as is the case for Brazil, have gained a strategic position given their capacity for providing food to meet the growing demand worldwide. his article investigates how the increase in the price of food commodities has impacted land market dynamics in Brazil.1
One of the central hypotheses is that the food price rise brings about an increase in demand for land in countries that export such goods, as with Brazil, inducing an increase in price of land-related assets in these countries (in the short term). Moreover, following the economic theory of international trade, an increase in the relative price has signiicant allocative and distributive efects (Feenstra 2015): more resources will be used for export food, and the owner of these resources will beneit from the increase in export. A study by the World Bank, for example, has concluded that the increase in agricultural production
and the demand for land is associated with eight commodities: corn, soybean, sugar cane, palm oil, rice, canola, sunlower, and planted forests2 (World Bank 2010).
Another important hypothesis is that this practice not only skews economic devel-opment, but also fosters new forms of income appropriation that such resources enable, altering signiicantly the productive and patrimonial logic underpinning the activity. Consequently, and because of the growing demand for food, biofuels, and raw materials, there was an increase in interest in land worldwide (Borras et al 2013; Safransky and Wol-ford 2011). According to a 2010 study by the World Bank, there has been a huge demand for land all over the world since 2008, making ‘territorial dispute’ a global phenomenon (World Bank 2010). Before 2008, the transfer of land used for farming was about four mil-lion hectares per year. By contrast, between October 2008 and August 2009 more than 45 million hectares were traded, 75% of which were in Africa alone, and another 3.6 million hectares in Brazil and Argentina, a movement that led to the popularisation of the term ‘land grabbing’, or ‘estrangeirização das terras,’ in Portuguese. hese terms have been used in related literature to characterise a process of appropriation of large plots of land by for-eign capital (Cotula 2012; Sauer and Leite 2012). Among the most signiicant information in the study carried out by the World Bank is the characterization of current demanders of land in the world: a) governments concerned with internal consumption and their dif-iculty in producing suicient food for the population, especially ater the food crisis in 2008; b) inancial companies that see a comparative advantage to invest in land; and c) companies in the agribusiness sector that are hoping to expand their businesses given the highly concentrated levels of trading and processing.
Ater the food price crisis in 2008, which brought the issue of food safety back, it is hardly surprising that governments, led by China and a number of Middle Eastern coun-tries, became more interested in land acquisition with the purpose of producing food for domestic consumption. However, the type of investments made by the inancial sector is noteworthy given its historical rejection of illiquid assets, especially land, an asset associ-ated with low liquidity. he global interest in land in Latin America (especially in Brazil, Argentina, and Uruguay) and in Sub-Saharan Africa has prompted an increase in land prices. hese trends have attracted attention from the media in Brazil and placed in the limelight the expansion of so-called ‘agribusiness’, the attempt to regulate the activities of the sector, the new types of conlicts such as the production of soybean and sugar cane in the Legal Amazon or in indigenous lands, and the purchase of rural properties by foreign-ers (Heredia et al 2010; Leite and Wesz Jr 2013).3
sector in the inancial logic per se, disconnecting the rural from strict demand for food production. he conclusion considers possible price and political developments.
Expansion of agribusiness and the land market in Brazil: a rapid bailout
Spatial dynamics in commodity production and related impact on land price
It is important to retrace the expansion and specialisation trend that has characterised the corporate farming sector over the last three decades, a period that has become known as ‘agribusiness’ expansion (cf. Delgado 2012; Grynszpan 2009; Heredia et al 2010; Mendon-ça 2005). In order to describe its characteristics, we resorted to the available data on two crops that play an important role in the coniguration of Brazilian agribusiness: soybean (including soybean crushing for the production of bran, oil, and animal feed) and sugar cane (the recent boost of which is associated with ethanol production. heir related yields are signiicant for the general calculation of domestic production in the sector (GDP) not to mention that these products are crucial commodities in the export agenda, fuelling the export drive associated with the rural environment (Delgado 2010).
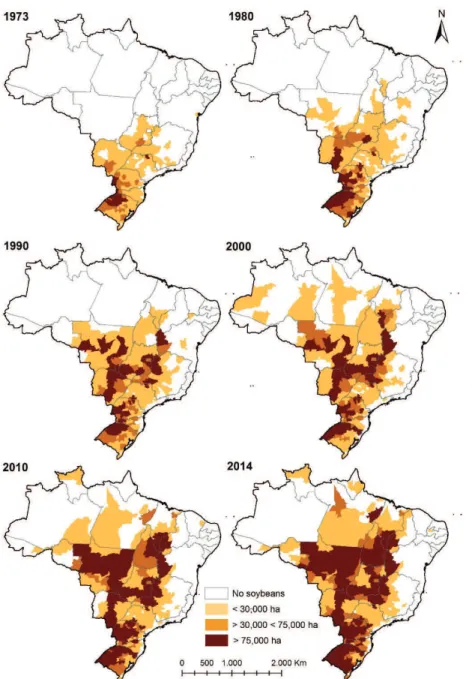
Figure 1, in the Annex, illustrates how soybean production moved across diferent areas in the country. Previously concentrated in the South, it later spread to the Cerrado regions, in the Central-West and Minas Gerais states, and in the Northeast. In the 2000s, it expanded to the Amazonian region, especially in Amazon state (in the Humaitá region) and Pará (particularly in the south-eastern and western parts of the state).4
he diferent colours signal the presence of soybean production in Brazilian micro- and meso-regions (light yellow indicates low levels of production while brown points to the spatial concentration of production) and its expansion towards the north of the coun-try, where the areas with higher production density form a ‘y’ shape.
Attention must be given to the particular case of soybean expansion in Mato Grosso state, which in 1990 was producing 3,064,715 tons of grain (as opposed to 6,313,476 tons in Rio Grande do Sul – RS), reaching 8,774,770 tons in 2000 (as opposed to 4,783,895 tons in RS). By 2014, it was producing 26,495,884 tons (as opposed to 13,041,820 tons in RS), according to data from Municipal Agricultural Production/ Brazilian Institute of Geogra-phy and Statistics (PAM/IBGE).
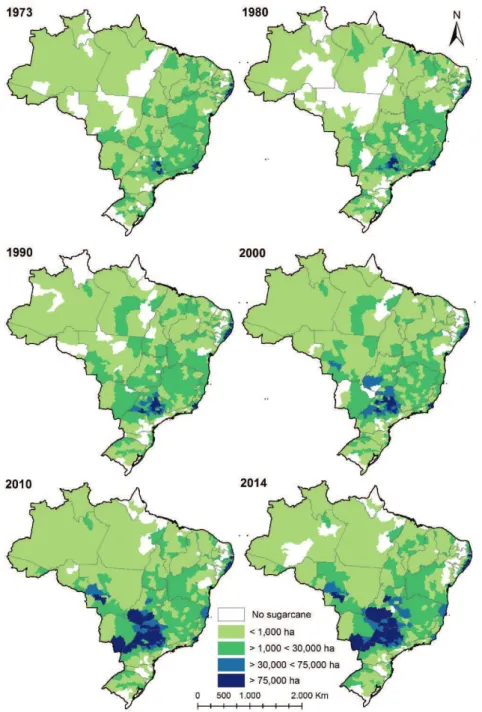
south of Paraíba). Data collected by the IBGE show that the commercialisation of this product is oten connected to its delivery to mills and processing plants, in particular to those linked to the production of sugar and ethanol. Given that the trading routes are usu-ally quite short (diferently from the soybean, the product is not exported in natura), they tend to be concentrated in the regions where most plants are located, in particular in the state of São Paulo.
he growing use of land for sugar cane crops, following incentives and (national and international) investments in the production of biofuels, has taken over areas originally used for local food distribution or cattle raising. his is particularly evident in São Paulo state and in the Minas Gerais area of Triângulo Mineiro. When it comes to the expansion towards the Central-West (Goiás and Mato Grosso do Sul), and into the micro-region of Uberlândia, in Minas Gerais, the growth of sugar cane production has to compete with the large-scale production of grains and the agribusiness meat sector (poultry and pork) already established in the area (Lima 2010a). his has translated into a ierce territorial dispute, with some municipalities having to establish a limit to the areas destined for sugar cane.
he soybean chain constitutes one of the most important items in the export agenda of the so-called ‘agribusiness’ (agriculture, livestock, agri-industry, etc.), even if grain sales outweigh products made with soybean – soybean meal, oil, etc. – which suggests a trend of specialization in the export of products that are less likely to generate added value, thereby increasing the level of external vulnerability.5 he recent upturn of surplus rev-enue in the Brazilian trade balance has been accompanied – and for some analysts, even fuelled – by the movement of agriculture export, prompting an increase in the generation of foreign currencies. For some scholars, as well as for some political actors and for part of the media, this trend has justiied an intensiication of this strategy (Castro 2010; Furtado 2008), even if this measure translates into increasing debts for the commercial farmers (subsidised by the state),6 or higher levels of work exploitation and precariousness (Del-gado 2010, 2012).7
According to Wilkinson, Reydon, and Sabbato (2012), this expansion is accompanied by the emergence of companies specialised in real estate that are engaged with the ‘clean-ing’, preparation, and sale of new areas for (national and international) private groups, including companies from the grain and sugar cane sectors. Another consequence is the valorisation of land with resulting higher prices.
The land market in Brazil: what recent data reveal about the prices
In Brazil, investment in land was for a long time a sound alternative to what is described in Portuguese as inversão de capital, or capital expenditure (Brandão 1988), whether to directly promote its valorisation8 (with a type of investment that minimises the risk of capital devaluation, even if it does not ofer the best proit rates) or to secure access to the heavily subsidised rural credit policy of the 1960s and 1970s (Delgado 2005).
For a brief historical retrospective on the price dynamics of both the purchase and sale of rural real estate, see the timeline by Wilkinson, Reydon, and Sabbato (2012) show-ing the market downturn followshow-ing the process of macro-economic stabilisation in Brazil ater the adoption of the Real Plan in 1994, a macro-economic strategy to deal with de-cades of inlation. Towards the second half of the 1990s, the market showed a relux in the prices of rural real estate, prompting the minister of agriculture at the time to state that ‘the structure that supports concentration of land ownership in Brazil has inally col-lapsed’. However, as suggested by some authors, the beginning of the 2000s saw the prices rising again, resulting from the good performance of major commodities prices, especially soybean. his trend intensiied ater 2007–2008.
According to data from Informa Economics FNP, a consultancy company special-ised in the land market in Brazil, the average price for land in the country in 2010 was R$ 4,756.00 per hectare (Table 1). In 2015, the value went up to 10,083.00 reais. In other words, the average price of land went up by 112% in only a few years. his amounts to an increase far greater than the variation of the Consumer Price Index Extended (Índice de Preços ao Consumidor – IPCA) of +48.9% – or that of the Market General Price Index (Índice Geral de Preços do Mercado – IGPM) of +52.55%. It is also worth noting that the irst quartile of land prices in Brazil registered an increase higher than the inlation for the same period. he range of prices of land assets not only grew at higher rates than the varia-tion in the main price indexes, but has also shown a signiicant increase since 2010. he interquartile range almost doubled, indicating that the demand for land was more intense in some regions than in others (Flexor 2016).
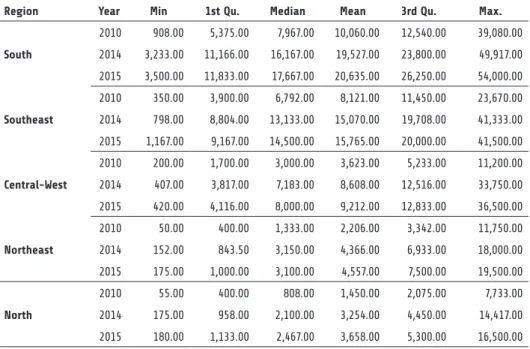
In efect, from 2010 to 2015, this trend was more intense in the North, Northeast and Central-West (cf. Table 2). In these regions, where agricultural expansion was more in-tense,9 average price variations went beyond 150%, reaching 220% in the extreme example of the North. In the South (+131%) and Southeast (+130%), average variations were less intense, even if increase was signiicant. his trend in prices in the areas of the agricul-tural frontier, of which the region known as MATOPIBA10 is the best known example, is probably the reason for a relatively higher increase in price dispersion in the North and Northeast.
prices were linked to areas that are not highly valued, with prices below R$ 4,000.00 per hectare. his is the case with the Caatinga area in the Northeast, the forest areas in Espírito Santo, and the lood plains in the North. he main price devaluations afected a broader range of quality and types of land. For example, amongst them there are irrigated areas in the Northeast, pasture land in the North and Mato Grosso, and forest and Caatinga in the Northeast.
In addition, it is worth highlighting that when prices are calculated in dollars, their inlection is more signiicant for the years 2014–2015 (Table 3). In North American cur-rency, for example, the average land prices decreased by 25% for this period, a signiicant drop when compared to the sharp increase of almost 50% for the period between 2010 and 2014.
Constraints regarding the shift in prices for land assets
Given that land supply is inelastic in the short term, prices oten depend on factors that determine the demand. Amongst them, soil fertility is important, as well as the location of the land in relation to food consumption markets, the existence of infrastructure and eicient logistical systems, food price, variation of the general prices, existence of taxes on land-related assets, and costs of land market transactions. his is an important set of vari-ables, and they do not afect land prices in similar ways, nor simultaneously. In the next section, we will analyse some of the main factors afecting land price behaviours in Brazil. Focusing on the irst hypothesis presented in the introduction, we argue that the rise in food price, a key factor in the boom of commodities in the 2000s, pushes up the price of land, one of the most important resources for the production of food.
In addition, as elaborated in the second hypothesis, we draw attention to how changes in relative prices resulting from this phenomenon fostered further capital allocation for the production of food commodities and land assets in Brazil. he entry of foreign capital in the land market is noteworthy, indicating that the price hike prompted the process. his foreign capital attempted to valorise their assets and expand their capital portfolio, as in the case of pension funds, for example, increasing their participation by means of di-rect investments and/or investments in association with national corporations in the rural area, seen by those in charge of these investments as ‘windows of opportunity’.
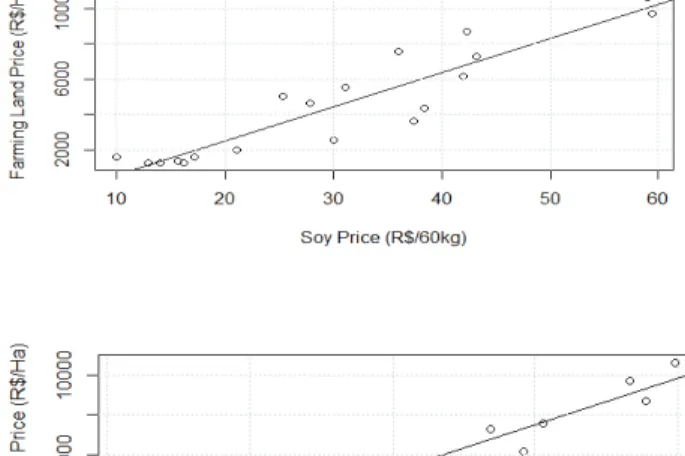
Land and commodity prices: a strong correlation
proxy for the opportunity cost of land assets and land price, presents a signiicant inverse relation. On the other hand, the IBOVESPA index, an important inancial market index where the weight of corporations in the commodities sector is important,11 is positively correlated with land prices. he same argument is valid for the prices of soybean or 33 pounds of beef (the arroba unit of weight). In other words, the prices of land assets present a strong correlation with the prices of commodities, which showed exceptional behaviour in the 2003–2103 decade.
In fact, during the irst decade of the 2000s, the prices of the main commodities went up sharply. It is possible to have an idea of this price cycle by observing the movement of the commodity price index of the International Monetary Fund, an index that includes both fuels and agricultural and mining-related commodities (cf. Figure 4).
In January 2001, the value of this index was 61.92 points. Four and a half years later, it reached 100 points, and in August 2008 it was close to 215 points. With the onset of the subprime mortgage crisis – that culminated with the collapse of the Lehman Brothers, the commodity market went through a brief period of low revenues. he commodity index was again below 100 points in February 2009. However, this was a short-lived trend. A year later, the index rose by more than 40 points, and in April 2011, it once again reached the 210 points. Since then, the commodity cycle has (increasingly) shown signs of reach-ing an end point.
here are two arguments to explain the behaviour of the commodity prices in this last ‘supercycle’. he irst argument highlights the strong demand prompted by China’s intense economic growth, and to a lesser extent, that of India (Gilbert 2010; Bafes and Haniotis 2010). According to this argument, the conjuncture that combined rapid expanding global demand with rather inelastic supply pushed prices up over a long period. he cycle only reached an end when the Chinese economy stopped accelerating and investments to in-crease supply entered the operating stage. he second argument proposes an analysis that combines the behaviour of monetary authorities and innovations in the inancial sector (Du, Cindy and Hayes 2011; Irwin, Sanders and Merrin 2009; Frenkel and Rapetti 2009). Following this line of explanation of the boom of commodities, the monetary policies adopted by the main central banks since the middle of the 2000s, characterised by his-torically low interest rates, guaranteed liquidity in abundance. In the pursuit of an attrac-tive return, operators in the inancial markets started to invest in markets that had been little afected by the inancial dynamics. he traditional markets of commodities became increasingly important to the inancial actors. he result was a considerable increase in the purchase of assets backed by commodities in the growing stage of the cycle. As high-lighted by Tang and Xiong (2012), the fact that there is a strong correlation between the prices of the main commodities – be they oil, food or minerals – shows that the behaviour of respective prices is not only driven by factors related to supply and demand. It involves inancial strategies.
guid-ing these markets. In that context, the expansion of inancial activities in the 2000s ended up impacting the dynamics of the food and land markets in Brazil.
Supply of farming products and main Brazilian agricultural commodities during the boom
If the relative price of certain products goes up, it is expected that their production will in-crease. A simple calculation of the correlation coeicient shows that in the case of grains, this relation was quite consistent during the boom. From 2000 to 2013, the soybean price went from US$ 211.83 to US$ 538.42 per ton, and the total supply went from 32.34 mil-lion to 81.50 milmil-lion tons. Unsurprisingly, the Pearson coeicient showed a strong cor-relation (0.875) between the prices of soybeans (in dollars) and the volume produced in that period in Brazil. he same happened in the meat sector, another part of agribusiness that beneitted from the boom of commodities. he prices of beef more than doubled, according to data by the World Bank, going from US$ 1.93 in 2000 to US$ 4.07 in 2013. his rise in prices was followed by the domestic growth of 101% in slaughter. In the case of poultry, the rise in price for a kilogram of chicken (+74.66%) was followed by a higher than proportional rate of slaughter (+114%).
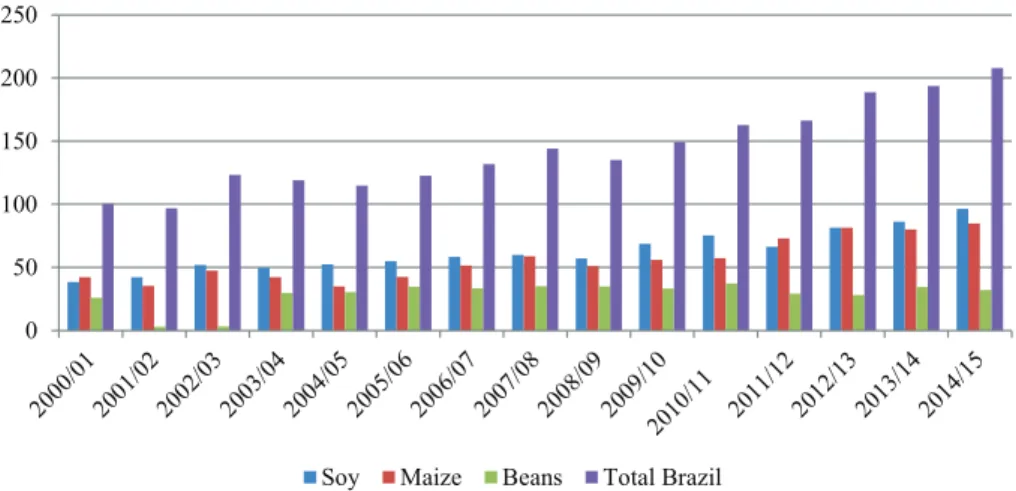
Figure 5 gives evidence for another efect of the rise in the price of grains on sup-ply in Brazil, namely, the fact that the boom of commodities fostered the production of agricultural products for export such as soybean and corn. Taking into consideration the total production for the 2000/15 period, for example, the increase was of 107.98%; in other words, it more than doubled in 15 years. But a signiicant part of this increase was due to the growth in soybean production (+197.6%) and that of corn to a lesser extent (+100.22%). On the other hand, a traditional crop such as the black bean, which is very important for the Brazilian diet, showed a much inferior increase in volume (+22.84%) even if it registered a signiicant price variation (+274.51%) for this period.
Capital invested in main commodity chains in Brazil
he boom in international prices not only stimulated land use for the production of ag-ricultural commodities in Brazil, but also impacted the allocation of capital, encourag-ing investments in the commodity chains. Foreign capital mainly invested in the soybean chain, which is historically more structured than a good portion of other agribusiness chains and dominated by foreign companies – ADM, Bunge, Cargill, and Dreyfus, to mention a few. here are, however, many large Brazilian companies and co-operatives, such as Amaggi, Coamo, or Caramuru, operating in the soy chains. Along with large mul-tinational trading irms, these companies have undertaken important investments in pro-cessing units – either by acquiring them from other companies or constructing new units (greenield) – and logistic systems, many of them in the Central-Western regions of Brazil. hese investments greatly contributed to fostering regional economic growth, and it is hardly surprising that the contribution to Brazilian GDP by the Central-West went up 1% over the decade of 2002 to 2012, going from 8.8% to 9.8% of the national GDP.
In the meat sector, investments were just as signiicant. hat said, the allocation of resources was guided by national capitals inanced by the National Bank for Economic and Social Development (BNDES). Besides the implementation of policies to support the establishment of the Brazilian meat industry, the BNDES provided inancial resources that facilitated the signiicant growth of the JBS, one of the largest meatpacker companies in the world, along with Tyson, Cargill, and National Beef. Using an aggressive strategy of asset acquisition, the JBS bought the largest Argentinean meat processing plant (Swit Argentina) in 2005, the third-largest meat company in the United States in 2007 (Swit), and a large American poultry-processing plant (Pilgrim Pride) in 2009. It also made a number of purchases both in Brazil and abroad. he BNDES also supported the expansion of Marfrig, the second-largest meat company in Brazil, and the re-structuring of the BRF, the largest Brazilian pork and poultry processing irm.
he diversity of exports is another characteristic that diferentiates the meat sector from the soybean chain. With regards to the latter, China is the main importer. In 2014, exports to this Asian country amounted to more than 70% of the total value of soybean export sales. By contrast, the meat sector counts with a number of major importers, such as Russia, Venezuela, Hong Kong, and Iran. A similar trend can be found in the poultry sector, with impressive importers from the Middle East (Saudi Arabia, the United Arab Emirates, Egypt), the Far East (China and Hong Kong, South Korea), and Latin America (Venezuela).
de-layed, with irst purchases happening only in 2006. Today, it manages eight plants with an overall capacity to process 21 million tons of sugar cane.
he interest in ethanol by large oil companies was prompted by the sharp increase in prices of hydrocarbonate in the second half of the 2000s, and by the need to enter into business areas that could enhance their environmental reputation (Wilkinson and Her-rera 2010). hese represented suicient incentives to attract the oil giant Shell, which de-cided to form a partnership with Cosan, one of the largest Brazilian irms in the sugar and alcohol sector, to create Raizen. In order to gain space in the ethanol market, Petrobras also decided to form partnerships and to create a subsidiary, Petrobras Biofuels (Petrobras Biocombustíveis). However, due to the drop in oil prices since 2015, along with a politi-cal corruption scandal, the company is currently reviewing its strategy in the sugar and alcohol sector.
Besides these examples, the fusions and acquisitions that have marked the Brazilian agri-food system13 since the early 2000s show that Brazil has started to have an increas-ingly important position in terms of attracting inancial resources for food production. As highlighted by Wilkinson (2009), since the beginning of the 2000s, Brazil has emerged as a global source of agricultural supplies and, in that context, it is not surprising that the country attracted more capital as the prices of agricultural commodities went up. Amongst these commodities, the entry of foreign capital for the acquisition of large extensions of land in the country is noteworthy, as we shall see below.
Land grabbing in the context of Brazilian agriculture
While there has not been a thorough systematic review nationwide, it is possible to infer that foreign investment in the Brazilian primary sector also resulted in the acquisition of large portions of land (Leite and Sauer 2011, 2012). According to research carried out by the Rural Development and Agrarian Studies Centre (Núcleo de Estudos Agrários e De-senvolvimento Rural – NEAD), using the National Rural Registration System (SNCR) of the National Institute for Colonization and Agrarian Reform (INCRA), 34,632 properties were registered by foreigners in 2008, encompassing an area of 4,037,667 hectares. his is signiicant considering that these igures do not include the period known as the ‘race for land acquisition’ following the 2008 crisis (Pretto 2009). It must be noted that 83% of this total were properties classed as large properties (above 15 ‘iscal modules’, a measuring unit used in Brazil).
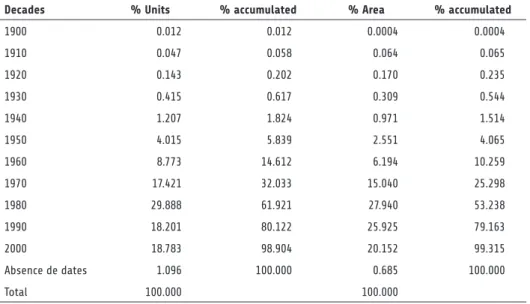
Table 5, extracted from the study by Pretto (2009: 21), illustrates the historical pro-cess of acquisition of rural real estate, showing increasing numbers of properties and land registered by foreign individuals and companies. he 1980s, 1990s, and 2000s show the concentration of this trend at, respectively, 29.9%, 18.2% and 18.8% for the total number of real estate properties registered by foreigners, and 27.9%, 25.9% and 20.1% for the total area in the registration system.
implementation of distinct phases of the Program for Japan–Brazilian Cooperation for the Development of Cerrados (PRODECER), created in the 1970s and implemented during the 1970s and 1980s in several regions of the Brazilian Cerrado, especially in the states of Minas Gerais, Goiás, Bahia, and Mato Grosso (Salim 1986).
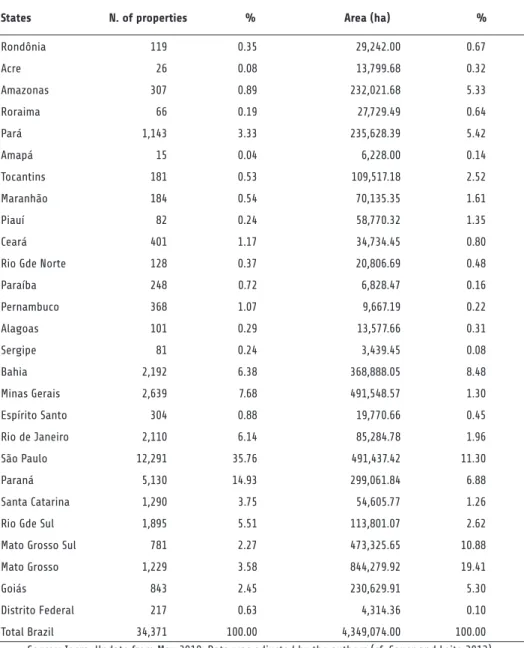
An update of the data for 2010, using the same registration system elaborated by IN-CRA, shows the existence of 34,371 rural properties acquired by foreigners, encompass-ing a total of 4,349,074 hectares, as seen in Table 6. he same table shows that the largest proportion of properties is concentrated in São Paulo state (35.7% of the total), Paraná (14.9%), Minas Gerais (7.68%), and Bahia (6.38%). If we take the total of the area into account, the picture changes in terms of which states head the list with Mato Grosso state (19.4% of the total area), Minas Gerais and São Paulo (11.3% each), and Mato Grosso do Sul (10.9%). In both cases, the picture coincides signiicantly with the movement of agri-cultural expansion.
he largest positive variations in the number of real estate properties between 2008 (Pretto 2009) and mid-2010 (Sauer and Leite 2012) were in the states of Minas Gerais (14.24%), Roraima (13.79%), and Rio Grande do Norte (12.28%). If we consider land that was incorporated, the picture is a diferent one, with the following states leading the igures: Amazon (with a signiicant increase of 120% in the number of areas being regis-tered), Piauí (with 77.7%), Minas Gerais (with 57.4%), and Espírito Santo (with 43.9%). It could be suggested that part of this trend may be associated with the expansion of agri-business activities, both in the sector of grains and sugar cane and in the mining and forest sectors.14
Specialised studies show that there is no clear correlation between Direct Foreign In-vestment (IED) and the GDP, and that the volume of external resources entering the coun-try for investment can be explained by corporate strategies (multinationals in particular) and by location-related factors, because of speciicities of the regions where investments are being made. he information on IED in the 2011 Census (for the 2010 year), carried out by the Brazilian Central Bank, and based on stock values (rather than low values), indicates that regarding the country of the inal investor, the participation of investments were led by North Americans with 18% of the total registered. he participation of 1.4% by Chinese investors is noteworthy.
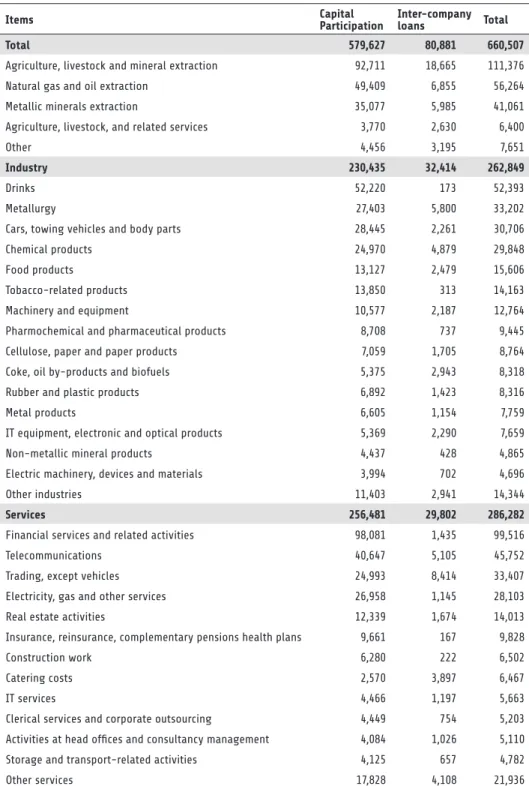
If one takes into account the allocation of the resources, as seen in Table 7 (in the an-nex), the majority of IEDs correspond to investments in the service sector (43.3% of the total) and in the industrial sector (39.8%). Agriculture only accounts for 1% of the global stock, and the mining sector for 6.22%. Some recent works have speculated over whether IEDs are directed towards the acquisition of land per se, the process described as land grabbing. It is not easy to obtain such data using Bacen statistics since its detailed infor-mation is not available for consultation. However, one can assume that investments in this area are concentrated on the two sub-sectors mentioned above (‘agriculture, livestock and related services’ and ‘extraction of metallic minerals’).
Still drawing on the information available on databases, a quick consultation of the
of time (2007 to 2014). It must be noted that some of the key drives for such investments were soybean production, sugar cane and cotton, and the forest sector. he registry shows that the capital for the acquisition of these large expanses of land had its origin in coun-tries like Argentina, Canada, the United States, and Japan.
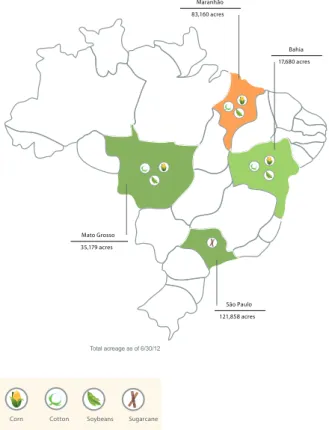
he North American case has attracted international attention through a study led by a group of non-governmental organisations (Rede Social de Justiça e Direitos Humanos et al 2015), where there is evidence that some investments were sponsored by an American pension fund named Teachers Insurance and Annuity Association—College Retirement Equities Fund (TIAA-CREF), while also revealing its association with foreign and na-tional corporations.15 A report by the pension fund itself indicates the strategic areas for this type of investment, adopting the nomenclature recommended by the World Bank, as so-called ‘responsible investments’ (TIAA-CREF 2012). A picture of the areas where the pension fund is investing can be seen in Figure 7.
Due to the narrow and insuicient sources of data and information, it is not pos-sible to categorically state that the growing investment of foreign capital in large portions of land in areas known for the expanding production of commodities has directly and exclusively contributed to the incremental price of land and to the concentration of land ownership that characterises the country. However, there is a probability that such a trend may have had an indirect impact on maintaining the high price expectations of land as-sets, especially in areas where large plots of farming land face inelastic supply. Studies on behavioural inances (Kahneman 2011; Shiller 2015) show that this is a common mecha-nism in the operation of inancial markets.
In conclusion
his article attempted to show how the sharp increase in the price of commodities ater the 2000s, the commodity boom, had an impact on the dynamics of the land market in Brazil. In particular, it highlighted the main efects of the commodity boom on the price behaviour of land assets, the production of grains, and the geopolitical positioning of the country. As a result, it does not come as a surprise that there was an increase in interest by foreign capital, be it agrarian or inancial, in buying land in Brazil, even if it is not possible to establish an explicit correlation between the arrival of IED and the increase in prices of rural real estate.
With regards to land grabbing, it is important to note that an attempt at regulation was made in 2010 ater the decision by the Attorney General of Brazil (Advocacia Geral da União – AGU) to establish limits to the volume of land acquired directly by foreign individuals, companies, or governments (Sauer and Leite 2012). In fact, the ruling was informed by a speciic law concerning the matter, passed in 1971, that had stopped being applied during the decades of the 1990s and 2000s in particular, when the race for land was quite ierce. Before then, in 2007, a proposed bill by a member of the lower house, Deputy Beto Faro, had already stipulated similar measures. However, the project is still waiting to be voted on, and without a scheduled date (Chamber of Deputies of Brazil 2007). Following the ruling by AGU, INCRA issued in 2013 the Normative Instruction no. 76, which prescribes the norms for rural acquisition and lease for foreigners. he text is well grounded, and gives the institute a key role in the monitoring of this type of real estate transaction, although over time these measures tend to become less efective due to lack of resources for their application.
Even ater the measures above had been taken, international capital continued to be involved in the agricultural (and mineral) sectors, now mediated by national irms and beneitting from the respective legislation surrounding the eligibility for national compa-nies to operate in the country. Moreover, as mentioned in the Introduction, there is strong political pressure for PL 4059/2012 to be passed, which would make the already precarious regulation of the sector even more lexible (Zaia 2016). Arguments deployed by political actors focus on the need to attract new investments in a conjuncture of economic crisis.
With the boom of commodities coming to an end, the macro-economic conditions faced by Brazil (inlation, iscal adjustments, etc.) are likely to be a great deal more adverse than what has been experienced since the early 2000s. In that context, the demand for land is likely to slow down, along with the capital inlow to purchase land and agri-food assets, regardless of attempts by the state to unleash the process of internationalisation of the land market. In this context of severe crisis and uncertainty, we will probably see other attempts at liberal reforms in sensitive areas such as land assets, reinforcing the pattern of strong economic concentration, and social inequality that has marked the Brazilian economy and society.
Notes
1 We are speciically referring to agricultural commodities that perform a strategic role of providing food both for human and animal consumption. Obviously, not all food goods are considered to be tradable (as is the case for manioc lour, for example), and not all agricultural commodities are in the food category (as is the case for the textile sector, for instance).
2 Bearing in mind that the Brazilian participation is mainly focused on the three former commodities 3 See, for example, the recent discussion surrounding the proposed bill 4.059/2012, currently going through
the legislative process in the lower house (Chamber of Deputies of Brazil 2012; Zaia 2016)
4 See recent bibliography that corroborates this information: Alves (2005), Costa (2012), D. Lima (2010), and M. Lima (2010).
mediated by the industry rather than by co-operatives or ‘middlemen’, located respectively in the south and north of the country. hus, a great deal of the soybean produced in the Brazilian region of Cerrado (Mato Grosso, in particular) is destined for industrial processing (as well as for the external market), and part of this production is used as raw material for biodiesel.
6 Given that the institutionalisation of measures to manage risks associated with agricultural production in Brazil is insuiciently developed, a climatic upheaval, for example, can cause an increase in producers’ debts. On the other hand, the constant debt renegotiation in the corporate rural sector has been used as leverage for political support by members of the senate and the lower chamber with connections to the rural sector.
7 Although the number of rural workers involved in the expansion of those crops has decreased, these activities are still characterised by controversial work relations, including scenarios that could be described as slave forms of labour, in particular in the production of sugar cane, cofee, cattle-raising and extractive activities. Moreover, informality is still high in rural Brazil.
8 Ignácio Rangel used the idea of a fourth component part of land rent (to complement absolute ground rent, diferential rent I, and diferential rent II) based on the strong inancial valorisation of rural real estate in Brazil. He pioneered the idea that land ownership could be turned into something close to a inancial asset, capable of attracting forms of capital interested in avoiding de-indexation of currency values, in particular during the economic crisis in the 1980s (Rangel 1986).
9 his relates to the expansion of soybean crops and cattle raising.
10 hese initials refer to the Cerrado region in the north-eastern states of Maranhão, Tocantins, Piauí, and Bahia.
11 Mining and oil irms in particular.
12 In the theory of international trade, the comparative advantage is, conventionally, one of the main reasons to explain trading gains. It is about the opportunity cost involved in producing a good and exporting part of the production in order to import other goods, making the production more eicient and increasing gains obtained by the exporting country. he comparative advantages, put simply, are generally associated with diferences in productivity or difering factors between countries (Feenstra 2015).
13 he agri-food system refers to the network of actors involved in the production, distribution, and consumption of food.
14 he handling of this statistical information demands a certain level of caution, given that the registry has shortcomings, as evidenced in the data related to the origin of capital invested in land assets (in the INCRA registry, around 35% of the information related to this item is either missing or invalid).
15 As noted by Sauer and Leite (2012), the concept of ‘national company’ should be analysed with caution. In reality, under the veneer of national irms, and beneitting from changes brought about during Fernando Henrique Cardoso’s irst term in oice in the 1990s, there are holdings that are directly controlled by international capital, or by joint ventures that articulate external and domestic capital, as is the case of the Raizen company, managed by Shell and Cosan, already cited here.
References
Alves, Vicente E L. 2005. ‘Barreiras/Luiz Eduardo Magalhães (BA); Balsas (MA); Uruçui/Bom Jesus (PI): as novas cidades para o agronegócio nos cerrados nordestinos’. III Simpósio Nacional de Geo-graia Agrária. Presidente Prudente: Unesp.
Bafes, John and Tassos Haniotis. 2010. ‘Placing the 2006/08 commodity price boom into perspecti-ve’. World Bank Policy Research Working PaperNo. 5371.
Brandão, Antonio. S. 1988. ‘Mercado da terra e estrutura fundiária’. In: Antonio Salazar Pessôa Brandão and Rodolfo Hofmann (eds), Os principais problemas da agricultura brasileira: análise e
sugestões. Rio de Janeiro: PNPE/ IPEA. pp. 139–179.
Castro, Ana C. 2010. ‘From catching-up to knowledge governance in the Brazilian agribusiness’.
Desenvolvimento em Debate, 1(2): 9–23.
Chamber of Deputies of Brazil. 2007. Projeto de Lei no. 2289, de 2007 do Deputado Beto Faro. Brasilia: Câmara dos Deputados.
________. 2012. Projeto de Lei no. 4059, de 2012. Brasilia: Câmara dos Deputados.
Costa, Solange M. 2012. Grãos na loresta: estratégia expansionista do agronegócio na Amazônia.
PhD thesis: UFPA/NAEA.
Cotula, Lorenzo. 2012. ‘he international political economy of the global land rush: A critical ap-praisal of trends, scale, geography and drivers’. he Journal of Peasant Studies, 39(3–4): 649–680. Delgado, Guilherme C. 2005. ‘A questão agrária no Brasil, 1950–2003’. In: Frederico Barbosa da Silva and Luciana de Barros Jaccoud (eds), Questão social e políticas sociais no Brasil contemporâneo.
Brasília: IPEA: 51–90.
_______. 2010. ‘Especialização primária como limite ao desenvolvimento’. Desenvolvimento em De-bate 1(2): 111–125.
_______. 2012. Do capital inanceiro da agricultura à economia do agronegócio. Porto Alegre: Edi-tora da UFRGS.
Du, Xiaodong, L Yu Cindy and Dermot J Hayes. 2011. ‘Speculation and volatility spillover in the crude oil and agricultural commodity markets: A Bayesian analysis’. Energy Economics, 33(3): 497– 503.
Feenstra, Robert C. 2015. Advanced international trade: theory and evidence. New Jersey: Princeton University Press.
Flexor, Georges. 2016. ‘Commodity Boom and the political economy of land in Brazil 2003–2013’, LASA Congress, New York.
Frenkel, Roberto, and Martin Rapetti. 2009. ‘A developing country view of the current global crisis: what should not be forgotten and what should be done’. Cambridge Journal of Economics, 33(4): 685–702.
Furtado, João. 2008. ‘Muito além da especialização regressiva e da doença holandesa: oportunidades para o desenvolvimento brasileiro’. Novos Estudos-CEBRAP, 81: 33–46.
Grynszpan, Mario. 2009. A airmação do agronegócio: novos agentes e representações do rural. Paper presented at the 33rd Anpocs Annual Meeting. Caxambu: ANPOCS.
Gilbert, Christopher L. 2010. ‘How to understand high food prices’. Journal of Agricultural Econo-mics, 61(2): 398–425.
Heredia, Beatriz, Moacir Palmeira and Sergio Pereira Leite. 2010. ‘Sociedade e economia do “agro-negócio” no Brasil.’ Revista Brasileira de Ciências Sociais, 25(74): 159–196.
Irwin, Scott H., Dwight R. Sanders, and Robert P. Merrin. 2009. ‘Devil or angel? he role of specula-tion in the recent commodity price boom (and bust)’. Journal of Agricultural and Applied Econom-ics, 41(02) (August): 377–391.
Leite, Sergio Pereira and Sérgio Sauer. 2011. ‘Expansión de agronegocios, mercado de tierras y ex-tranjerización de la propiedad rural em Brasil’. Mundo Siglo XXI, 7(26): 43–63.
Leite, Sergio Pereira and Valdemar Wesz. 2013. ‘Les dynamiques foncières et l’expansion de l’agro--industrie du soja au Brésil’. Cahiers Agricultures, 22(1): 39–45.
_______. 2016. Brazilian agribusiness, public policies and development strategies: soybean expansion
in Mato Grosso. New York: GC/CUNY. Unpublished.
Lima, Divina A L. 2010. Estrutura e expansão da agroindústria canavieira no Sudoeste goiano:
impac-tos no uso do solo e na estrutura fundiária a partir de 1990. Phd hesis, Campinas, IE/UNICAMP.
Lima, Maria S B. 2010. Políticas públicas e território: uma discussão sobre os determinantes da expan-são da soja no sul do Amazonas. Phd hesis–CPDA/UFRRJ, Rio de Janeiro.
Mendonça, Sônia R de. 2005. ‘Estado e hegemonia do Agronegócio no Brasil’. História e Perspectivas, 32/33: 91-132.
National Institute of Colonization and Agrarian Reform (INCRA). 2013. Instrução Normativa/ IN-CRA/ no. 76 de 23 de Agosto de 2013. Brasilia: INCRA.
Oliveira, Ariovaldo U. 2010. ‘A questão da aquisição de terras por estrangeiros no Brasil-um retorno aos dossiês’. Agrária (Online), 12: 3–113.
Pretto, José Miguel. 2009. ‘Imóveis rurais sob propriedade de estrangeiros no Brasil’. Research report for technical co-operation programme ‘Apoio às políticas e à participação social no desenvolvim-ento rural’ (PCT IICA/NEAD). Brasília: NEAD.
Rangel, Ignácio. 1986. ‘A questão da terra’. Revista de Economia Política, 6(4): 71–77.
Rede Social de Justiça e Direitos Humanos, GRAIN, Inter Pares and Solidarity Sweden – Latin America. 2015. Foreign pension funds and land grabbing in Brazil. At: https://www.grain.org/article/ entries/5336-foreign-pension-funds-and-land-grabbing-in-brazil [Accessed on March 26 2017]. Safransky, Sara and Wendy Wolford. 2011. ‘Contemporary land grabs and their alternatives in the Americas’. Paper presented at the International Conference on Global Land Grabbing 6–8 April. Brighton, University of Sussex.
Salim, Celso Amorim. 1986. ‘As políticas econômica e tecnológica para o desenvolvimento agrário das áreas de cerrados no Brasil: avaliação e perspectivas’. Cadernos de Difusão de Tecnologia, 3 (2): 297-342.
Sauer, Sérgio and Sergio P Leite. 2012. ‘Agrarian structure, foreign investment in land, and land prices in Brazil’. he Journal of Peasant Studies, 39(3–4): 873–898.
Shiller, Robert J. 2015. Irrational exuberance. Princeton University Press.
Tang, Ke and Wei Xiong. 2012. ‘Index investment and the inancialization of commodities.’ Finan-cial Analysts Journal, 68(5): 54–74.
Teachers Insurance and Annuity Association—College Retirement Equities Fund (TIAA-CREF). 2012. Responsible investment in farmland. New York: TIAA-CREF.
Wilkinson, John. 2009. ‘he globalization of agribusiness and developing world food sys-tems’. Monthly Review, 61(4): 38.
Wilkinson, John, Bastiaan Reydon and Alberto Di Sabbato. 2012. ‘Concentration and foreign own-ership of land in Brazil in the context of global land grabbing’. Canadian Journal of Development Studies/Revue canadienne d’études du développement, 33(4): 417–438.
World Bank. 2010. Rising global interest in farmland: Can it yield sustainable and equitable beneits?
Washington D.C.: World Bank.
Annex (Tables and Figures)
Figure 1 – Area with soybean crops per micro-region in Brazil
Figure 2 - Area with sugar cane crops per micro-region in Brazil
Figure 3 – Relation between prices for farming land, soybean, beef (per measuring arroba unit), IBOVESPA and IPCA indexes, 1995/2013
Figure 4 – Price indexes of commodities for 2000–2016
Source: International Monetary Fund (IMF Commodity Price Indices)
Figure 5 – Grain production in millions of tons – Brazil 2000/2015
0 50 100 150 200 250
Soy Maize Beans Total Brazil
Figure 6 – Area with grain crops in millions of hectares 2000–2015
0 10 20 30 40 50 60 70
Soy Maize Beans Brazil total
Source: National Company of Food Supply (Companhia Nacional de Abastecimento Alimentar – CONAB)
Figure 7 – Investment in land in Brazil funded by TIAA-CREF – 2012
Mato Grosso 35,179 acres
Maranhão 83,160 acres
São Paulo 121,858 acres
Bahia 17,680 acres
Total acreage as of 6/30/12
Corn Cotton Soybeans Sugarcane
Table 1 Descriptive statistics of land price in Brazil in current R$/ha
2010 2014 2015
Mean 4,755.64 9,530.31 10,082.79
Median 3,150.00 7,175.00 8,000.00
St. deviation 5,194.68 9,064.01 9,365.26
Minimum 50.00 152.00 175.00
Maximum 39,083.00 49,917.00 54,000.00
1st Qu. 942.00 2,391.50 2,800.00
3rd Qu. 6,433.00 13,483.25 14,500.00
IQR 5,491.00 11,041.25 11,700.00
Source: Informa Economics FNP
Table 2 – Descriptive statistics of land price for main Brazilian macro-regions 2010/2014/2015 (current values in R$/ha)
Region Year Min 1st Qu. Median Mean 3rd Qu. Max.
South
2010 908.00 5,375.00 7,967.00 10,060.00 12,540.00 39,080.00
2014 3,233.00 11,166.00 16,167.00 19,527.00 23,800.00 49,917.00
2015 3,500.00 11,833.00 17,667.00 20,635.00 26,250.00 54,000.00
Southeast
2010 350.00 3,900.00 6,792.00 8,121.00 11,450.00 23,670.00
2014 798.00 8,804.00 13,133.00 15,070.00 19,708.00 41,333.00
2015 1,167.00 9,167.00 14,500.00 15,765.00 20,000.00 41,500.00
Central-West
2010 200.00 1,700.00 3,000.00 3,623.00 5,233.00 11,200.00
2014 407.00 3,817.00 7,183.00 8,608.00 12,516.00 33,750.00
2015 420.00 4,116.00 8,000.00 9,212.00 12,833.00 36,500.00
Northeast
2010 50.00 400.00 1,333.00 2,206.00 3,342.00 11,750.00
2014 152.00 843.50 3,150.00 4,366.00 6,933.00 18,000.00
2015 175.00 1,000.00 3,100.00 4,557.00 7,500.00 19,500.00
North
2010 55.00 400.00 808.00 1,450.00 2,075.00 7,733.00
2014 175.00 958.00 2,100.00 3,254.00 4,450.00 14,417.00
2015 180.00 1,133.00 2,467.00 3,658.00 5,300.00 16,500.00 Source: Informa Economics FNP
Table 3 – Descriptive statistics of land price in Brazil in US$/ha
Min 1st Qu. Median Mean 3rd Qu. Max.
2010 28.40 535.10 1,789.40 2,701.60 3,654.40 22,202.00
2014 64.59 1,023.51 3,049.08 4,049.99 5,715.60 21,212.69
Table 4 –Correlation between price for farming land and prices for soybean, beef, IBOVESPA, IPCA, Exchange rate, Selic interest rate in Brazil from 1995 to 2013
Price of farming land (R$/ha)
Price of
soybe-an (60 kg bag) IBOVESPA
Price of beef (arroba mea-suring unit)
Inflation (% av. per year - IPCA)
Exchan-ge rate
Soybean price (60 kg bag)
0.923
(0.000) -- -- -- --
--IBOVESPA 0.886 (0.000)
0.748
(0.000) -- -- --
--Price of beef (arroba mea-suring unit) 0.971 (0.000) 0.941 (0.000) 0.842
(0.000) -- --
--IPCA -0.326 (0.174) -0.292 (0.226) -0.450 (0.053) -0.322
(0.179) --
--Exchange rate 0.222 (0.361) 0.466 (0.045) 0.093 (0.706) 0.345 (0.148) -0.033 (0.983)
--Selic rate -0.754
(0.000) -0.767 (0.000) -0.794 (0.000) -0.795 (0.000) 0.698 (0.001) -0.426 (0.069) Source: Elaborated by the authors with data from FGVDados & IPEAData
Pearson correlation index (p-value in parenthesis)
Table 5 – Percentage of land purchase (number of properties and area size) by foreigners in Brazil (1900–2000)
Decades % Units % accumulated % Area % accumulated
1900 0.012 0.012 0.0004 0.0004
1910 0.047 0.058 0.064 0.065
1920 0.143 0.202 0.170 0.235
1930 0.415 0.617 0.309 0.544
1940 1.207 1.824 0.971 1.514
1950 4.015 5.839 2.551 4.065
1960 8.773 14.612 6.194 10.259
1970 17.421 32.033 15.040 25.298
1980 29.888 61.921 27.940 53.238
1990 18.201 80.122 25.925 79.163
2000 18.783 98.904 20.152 99.315
Absence de dates 1.096 100.000 0.685 100.000
Total 100.000 100.000
Table 6 – Number and area size of rural properties owned by foreigners – Brazil – 2010
States N. of properties % Area (ha) %
Rondônia 119 0.35 29,242.00 0.67
Acre 26 0.08 13,799.68 0.32
Amazonas 307 0.89 232,021.68 5.33
Roraima 66 0.19 27,729.49 0.64
Pará 1,143 3.33 235,628.39 5.42
Amapá 15 0.04 6,228.00 0.14
Tocantins 181 0.53 109,517.18 2.52
Maranhão 184 0.54 70,135.35 1.61
Piauí 82 0.24 58,770.32 1.35
Ceará 401 1.17 34,734.45 0.80
Rio Gde Norte 128 0.37 20,806.69 0.48
Paraíba 248 0.72 6,828.47 0.16
Pernambuco 368 1.07 9,667.19 0.22
Alagoas 101 0.29 13,577.66 0.31
Sergipe 81 0.24 3,439.45 0.08
Bahia 2,192 6.38 368,888.05 8.48
Minas Gerais 2,639 7.68 491,548.57 1.30
Espírito Santo 304 0.88 19,770.66 0.45
Rio de Janeiro 2,110 6.14 85,284.78 1.96
São Paulo 12,291 35.76 491,437.42 11.30
Paraná 5,130 14.93 299,061.84 6.88
Santa Catarina 1,290 3.75 54,605.77 1.26
Rio Gde Sul 1,895 5.51 113,801.07 2.62
Mato Grosso Sul 781 2.27 473,325.65 10.88
Mato Grosso 1,229 3.58 844,279.92 19.41
Goiás 843 2.45 230,629.91 5.30
Distrito Federal 217 0.63 4,314.36 0.10
Total Brazil 34,371 100.00 4,349,074.00 100.00
Table 7 – Foreign Direct Investment in the Country – 2010 stock. Distribution per economic activity sector of company operating in Brazil (US$ million)
Items Capital Participation Inter-company loans Total
Total 579,627 80,881 660,507
Agriculture, livestock and mineral extraction 92,711 18,665 111,376
Natural gas and oil extraction 49,409 6,855 56,264
Metallic minerals extraction 35,077 5,985 41,061
Agriculture, livestock, and related services 3,770 2,630 6,400
Other 4,456 3,195 7,651
Industry 230,435 32,414 262,849
Drinks 52,220 173 52,393
Metallurgy 27,403 5,800 33,202
Cars, towing vehicles and body parts 28,445 2,261 30,706
Chemical products 24,970 4,879 29,848
Food products 13,127 2,479 15,606
Tobacco-related products 13,850 313 14,163
Machinery and equipment 10,577 2,187 12,764
Pharmochemical and pharmaceutical products 8,708 737 9,445 Cellulose, paper and paper products 7,059 1,705 8,764
Coke, oil by-products and biofuels 5,375 2,943 8,318
Rubber and plastic products 6,892 1,423 8,316
Metal products 6,605 1,154 7,759
IT equipment, electronic and optical products 5,369 2,290 7,659
Non-metallic mineral products 4,437 428 4,865
Electric machinery, devices and materials 3,994 702 4,696
Other industries 11,403 2,941 14,344
Services 256,481 29,802 286,282
Financial services and related activities 98,081 1,435 99,516
Telecommunications 40,647 5,105 45,752
Trading, except vehicles 24,993 8,414 33,407
Electricity, gas and other services 26,958 1,145 28,103
Real estate activities 12,339 1,674 14,013
Insurance, reinsurance, complementary pensions health plans 9,661 167 9,828
Construction work 6,280 222 6,502
Catering costs 2,570 3,897 6,467
IT services 4,466 1,197 5,663
Clerical services and corporate outsourcing 4,449 754 5,203 Activities at head offices and consultancy management 4,084 1,026 5,110
Storage and transport-related activities 4,125 657 4,782
Other services 17,828 4,108 21,936
Table 8 – Land acquired by international capital (above 10,000 hectares) – Brazil – 2007 /2014
Capital Companies
1st sector
Companies 2nd sector
Production Area (ha) Year State
Chile Centaurus Holdings Klabin/Arauco Forest 107,000 2012 PR
Chile CMPC Riograndense CMPC Forest 100,000 2012 RS
United States RADAR S.A. TIAA-CREF Agriculture 84,000 2010 SP
Japan Multigrain S.A. Mitsui Soy/ Cotton 80,000 2007 BA
India Shree Renuka Sugars - Sugar 78,000 2010 PR
Luxemburg Adecoagro Adecoagro Ltd. Soy/ Cotton/ Corn/ Coffee/ Sugar
55,000 2005 MS
Holland RDF FIAM N.V. Forest 40,000 2007 AM
Jersey Agrifirma Brasil Genagro Ltd. Soy/ Corn 38,841 2009 BA
Argentina BrasilAgro CRESUD Agriculture 37,182 2007 BA
Holland Floresteca Holding - Forest 37,000 - MT
Argentina BrasilAgro CRESUD Agriculture 31,606 2007 BA
Canada Brookfield Brookfield Asset Agriculture 30,000 2005 MT
Argentina BrasilAgro CRESUD Forest 24,247 2007 MG
Japan SLC-MIT Mitsui Soy/ Cotton 22,000 2013 BA
Jersey Agrifirma Brasil Genagro Ltd. Agriculture 20,183 2008 BA
Canada Brookfield Brookfield Asset Agriculture 17,860 2008 MT
Argentina BrasilAgro CRESUD Agriculture 17,799 2008 BA
Canada Brookfield Brookfield Asset Sugar 13,089 2000 SP
Canada Brookfield Brookfield Asset Agriculture 12,920 2007 MT
Canada Brookfield Brookfield Asset Agriculture 12,777 2007 MS
Jersey Agrifirma Brasil Genagro Ltd. Soy/ Corn 12,287 2008 BA
Canada Brookfield Brookfield Asset Agriculture 11,925 2007 MS
France CalyxAgro Louis Dreyfuss Soy/ Cotton 10,853 2009 BA
Japan Multigrain S.A. Mitsui Soy/ Cotton 10,000 2007 MA
About the authors
Georges Flexor is Associate Professor at the Department of Economics of the Multidisci-plinary Institute of the Federal Rural University of Rio de Janeiro (UFRRJ) and Professor of the graduate programme in Social Sciences for Development, Agriculture, and Society (CPDA/UFRRJ). He is a researcher at the Observatory of Public Policies for Agriculture (OPPA/UFRRJ) and also at the National Institute of Policies, Strategy and Development (INCT/PPED), Brazil. He has experience in Political Economy of Development and Pub-lic PoPub-licy. His main research topics are: institutional analysis of poPub-licy, political economy of development, and food and energy policy.
Sergio Pereira Leite is Associate Professor of the graduate programme in Social Sciences for Development, Agriculture, and Society of the Federal Rural University of Rio de Ja-neiro (CPDA/UFRRJ), and co-ordinator of both the Observatory on Public Policies for Agriculture (OPPA/UFRRJ) and the study group on ‘Social Changes, Agribusiness and Public Policies’ (GEMAP/UFRRJ), Brazil. He has received research grants from Brazil-ian agencies, such as CNPq, FAPERJ, and CAPES, and was Visiting Scholar at he City University of New York (CUNY), USA, as well as Visiting Professor at both the School for Advanced Studies in the Social Sciences (EHESS), France, and the National University of South (UNS), Argentina.
Received on 1 September 2016, and approved for publication on 6 March 2017.