Short Report
Printed in Brazil - ©2017 Sociedade Brasileira de Química0103 - 5053 $6.00+0.00
*e-mail: [email protected]
The Use of Near Infrared Spectroscopy and Multivariate Calibration for
Determining the Active Principle of Olanzapine in a Pharmaceutical Formulation
Marcelo V. P. Amorim,a,b Fernanda S. L. Costa,c Cícero F. S. Aragãob and Kássio M. G. Lima*,c
aNúcleo de Pesquisa em Alimentos e Medicamentos, bLaboratório de Controle de Qualidade,
Departamento de Farmácia and cGrupo de Química Biológica e Quimiometria,
Instituto de Química, Universidade Federal do Rio Grande do Norte, 59072-970 Natal-RN, Brazil
The aim of this study was to quantitatively determine the olanzapine in a pharmaceutical formulation for assessing the potentiality of near infrared spectroscopy (NIR) combined with partial least squares (PLS) regression. The method was developed with samples based on a commercial formulation containing olanzapine and seven excipients. Laboratory and commercial samples (n = 27 and 18, respectively) were used by defining the calibration and prediction sets. The method was validated in the range from 1.0 to 12.5 of olanzapine per 100 mg of powder (average mass 210 mg), by accuracy, precision, linearity, analytical sensitivity, limit of detection and quantification. The multivariate model developed for olanzapine was based on PLS and the determination coefficient (rc and rp), with the root mean square error of calibration and prediction
being 0.95, 0.93, 3.2 × 10⁻³ and 4.0 × 10⁻³% m/m, respectively. The proposed NIR method is an
effective alternative for quantification of olanzapine in the pharmaceutical industry.
Keywords: near infrared spectroscopy, olanzapine, partial least squares regression, figure of merit, HPLC
Introduction
Atypical antipsychotics are a group of antipsychotic drugs used to treat psychiatric conditions. Some atypical antipsychotics1 have received regulatory approval
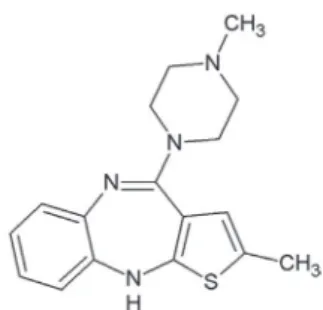
for schizophrenia, bipolar disorder, autism, and as an adjunct in major depressive disorder. The first-line psychiatric treatment for schizophrenia and bipolar disorder is antipsychotic medication which includes olanzapine.2 Olanzapine (Figure 1) is a synthetic derivative
of thienobenzodiazepine with antipsychotic, antinausea and antiemetic activities.3
Several analytical methods have been described for the quantification of olanzapine in biological fluids, pharmaceutical formulations and tissues such as high performance liquid chromatography (HPLC) with ultraviolet4,5 or electrochemical
detection,6 liquid chromatography/electrospray ionization
tandem mass spectrometry (LC-ESI-MS/MS)7 and mass
spectrometry imaging (MSI) using matrix-assisted laser desorption/ionization time-of-flight mass spectrometry (MALDI-TOF MS).8 Although these cited analytical
methods indicate the effectiveness of liquid chromatography owing to its reliability, accuracy, reproducibility of results and sensitive analytical method for the determination of olanzapine in various studies, they are time consuming and require experienced personnel to perform the analysis. Furthermore, they are also destructive methods involving sample preparations. For all of these reasons, the search for new analytical techniques is of fundamental importance, especially those which lower both analysis time and cost.
On the other hand, near infrared spectroscopy (NIRS) has been developed and proven to be a powerful tool for the pharmaceutical industry due to some characteristics such as being a fast and non-destructive
method, requiring minimal or no sample preparation and its high precision. Also, no reagents are required and no waste is produced, in contrast with traditional analytical methods (liquid chromatography, for example). Hertrampf et al.9 employed NIR spectroscopy coupled
with multivariate models to analyze tablets containing two different active pharmaceutical ingredients (API) (bisoprolol, hydrochlorothiazide) in different commercially available dosages. Two pharmaceutical excipients (lactose monohydrate and microcrystalline cellulose) and one API (acetaminophen) were used, and investigated using NIRS and partial least squares (PLS) by Sánchez-Paternina et al.10
For pharmaceutical industry examples using NIRS technique, we can cite special interest in the identification of raw materials and finished products,11 reaction monitoring
in blending processes,12 determination of active principles,13
dissolution testing,14 hardness testing15 and polymorphs.16
The use of appropriate mathematical and statistical methods (i.e., chemometrics) is largely responsible for the advancement of the NIR technique, including multivariate calibration techniques such as partial least squares (PLS),17
principal component regression (PCR),18 artificial neural
networks (ANN)19 and least squares-support vector machine
(LS-SVM).20 The main advantages of using the multivariate
calibration techniques listed above is that fast, cheap, or non-destructive analytical measurements (such as NIRS) can be used to estimate sample properties (for example, physicochemical parameters of pharmaceutical formulations) which would otherwise require time-consuming, expensive or destructive testing (such as liquid chromatography). Additionally, the establishment of validation procedures for multivariate calibration is very important because it is the first step for recognizing these methods for official analysis, especially in pharmaceutical legislation. Validation occurs via determination of several parameters, known as the figures-of-merit (FOM).21 According to ANVISA
(RE 899/2003),22 validating a pharmaceutical analysis
method is done by following the parameters of: sensibility, selectivity, accuracy, precision, linearity, range, limit of detection (LOD), quantification (LOQ) and robustness. Brazilian pharmacopeia23 and the European Medicines
Agency (EMEA)24 have also adopted guidelines for
validating methodology which employs NIR spectroscopy using established chemometrics tools, and evaluating parameters such as specificity, linearity, range, accuracy, precision and robustness.
Herein, we have attempted to quantitatively determine the active principle of olanzapine in different pharmaceutical excipients using NIRS and multivariate calibration. Nevertheless, olanzapine content has never been calibrated by NIR spectroscopy, or any other rapid technique. In
addition, data pre-processing methods were evaluated to determine the most suitable method for analyzing the data type. Finally, the best performing models were validated by calculating the FOM obtained from the analyses, which included selectivity, sensitivity, analytical sensitivity, precision, accuracy, limit of detection and limit of quantification.
Experimental
Sample preparation and mixture design
The pharmaceutical preparation studied was a powder mixture with antipsychotic action containing olanzapine as the active principle and seven excipients (lactose, microcrystalline cellulose, poloxamer, crospovidone, silicon dioxide, magnesium stearate and coating mixture). All compounds (active principle and excipients) were supplied by the Center for Food and Drug Research of the Federal University of Rio Grande do Norte (NUPLAM/UFRN), Brazil. In this work, olanzapine from NUPLAM/UFRN (Brazil) and EMS sigma pharma (State of São Paulo, Brazil) was used to correspond to form II (polymorphic).
Laboratory and commercial samples were weighed, crushed and individually placed in the same vials in variable proportions to span a concentration range (1.0 to 12.5 mg per 100 mg of powder (average mass 210 mg)) of nominal content in the active principle and ± 5% for excipients. Laboratory samples were made by individually weighing all excipients (including the coating powder mixture) and active principle, according to its mass used in the master formula. Commercial samples provided for the study were weighed, crushed and individually placed into the vials. From there, they were also homogenized using a Tube Mixer for 5 minutes to ensure the same concentration of active principle per milligram of powder. Commercial samples (2.5, 5.0 and 10.0 mg of olanzapine also per 100 mg of powder (average mass 210 mg)) were obtained from EMS sigma pharma (State of São Paulo, Brazil). The concentration of the active principle within laboratory samples was between 0.0047 to 0.0595% m/m and for the commercial samples it was 0.0119 to 0.047% m/m.
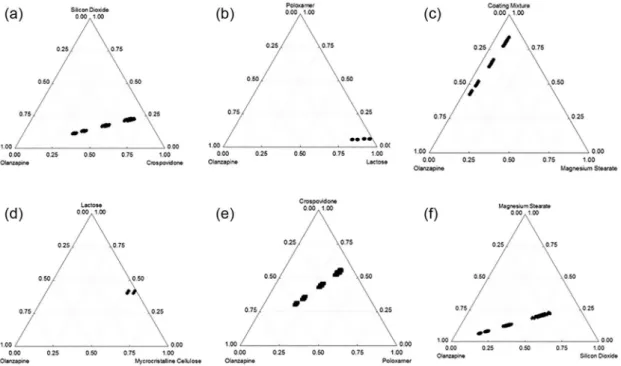
The ternary mixtures were selected according to a D-Optimal solution25 (Modde software version 4.0,
model. At the center point, all constituents in the mixture had nominal values. Six additional mixtures were made in order to achieve nearly equidistant steps in mass fraction for calibration and validation. Figure 2 illustrates the mixing ratios of the powder mixtures. One gram of every laboratory sample was homogenized in a Tube Mixer from BIOMATIC (Rio Grande do Sul, Brazil).
NIR spectroscopy
NIR spectra were collected in diffuse reflection mode via FT-NIR spectrometer (MPA, Bruker Optics, Ettlingen, Germany) equipped with an integrating sphere. Each measured spectrum (in triplicate) was the average of 32 scans obtained with a resolution of 16 cm-1 and over
the range of 900-2500 nm. The background spectrum was recorded using a gold coated slide. Spectral measurements were done in an acclimatized room under controlled temperature of 22 oC, and 60% relative air humidity.
HPLC analysis
After NIR analysis, the samples were subject to reference analysis using HPLC. The API olanzapine was determined by performing isocratic analysis by using an HPLC instrument from HITACHI equipped with pump (5160), auto-injector (5260), column oven (5310), iodine array detector (5430), all from Hitachi (Tokyo, Japan),
column Xterra® (Waters), 150 × 4.6 mm × 5 µm at 25 ºC.
For each analysis, the mobile phase used was in proportion 64:17:19 v/v of citrate buffer pH 5.9, acetonitrile and methanol, respectively.
The HPLC procedure used as reference to determine the API (olanzapine) in production tablets was as follows: each different concentration (2.5, 5.0 and 10.0 mg) tablet was weighed, dissolved in hydrochloric acid 0.1 N, sonicated for 10 min, diluted to 25 mL (2.5 mg), 50 mL (5.0 mg) and 100 mL (10.0 mg) with the same acid. An aliquot of 15 µL was injected at HPLC to obtain the chromatogram at 260 nm. The API in each sample, in milligrams of API per gram of tablets was used as reference datum.
Chemometrics procedure and software
All calculations (models and pretreatments) were performed using the MATLAB version 6.5 (The Math-Works, Natick, USA), specifically the PLS-toolbox (Eigenvector Research, Inc. ,Wenatchee, WA, USA, version 6.01). The calculated NIR spectra was log 1/R transformed in the first step, followed by the average spectra for each sample. Different pretreatments such as Smoothing Savitzky-Golay (SGS) (7 window points) followed by MSC (multiplicative scatter correction) and first-order derivative Savitzky-Golay (7 window points) were applied on the spectra in order to minimize undesirable features such as spectral offset, noise, baseline and scattering.14,26
A PLS-regression model was developed and validated by leave-one-out full-cross-validation. To avoid overfitting, test-set validated calibrations were used (75 and 25% of the spectra of laboratory and commercial samples, respectively, were applied in the calibration set and, 25 and 75% of the spectra of laboratory and commercial samples, respectively, were applied in the validation set) through the classic Kennard-Stone (KS) selection algorithm.27 The following
quality parameters were used to evaluate the calibration models, respectively: RMSEC (root mean square error of calibration), RMSEP (root mean square error of prediction), correlation coefficients of each model for calibration data set (rc) and prediction data set (rp). An elliptical joint
confidence region (EJCR) was calculated to evaluate the slope, intercept the reference regression, and to predict values at a 95% confidence interval.
Finally, validating an analytical method entails determining whether it fulfills its intended purpose. To do this, some figures of merit were determined such as sensitivity (fraction of analytical signal that is due to the increase of the concentration of a particular analyte at unitary concentration), selectivity (indicates the portion of the instrumental signal that is used for the multivariate calibration model), analytical sensitivity (ratio between the sensitivity and the instrumental noise), precision (degree of scatter between a series of measurements for the same sample under prescribed conditions), accuracy (closeness of agreement between the reference value and the value found by the calibration model, generally expressed as the root mean square error of the prediction samples (RMSEP)), limit of detection (minimum detectable value of net signal (or concentration) for which the probabilities of false negatives (β) and false positives (α) are 0.05) and limit of quantification (signal or analyte concentration value that will produce estimates having a specified relative standard deviation). The quality metrics28 used in this study for
evaluating the figures of merit results can be calculated following the equations:
Sensitivity = (1)
Selectivity = (2)
Analytical sensitivity = (3)
Precision = (4)
Accuracy = RMSEP = (5)
Limit of detection = LOD = (6)
Limit of quantification = LOQ = (7)
where the vector of sensitivities Sknas must be the same
for all calibration samples, is the vector for the net analyte signal for the k analyte and yi is the reference value
of the sample i. xk,unis the Euclidean norm of the original vector of the instrument responses. δx is an estimate for the instrumental noise, calculated as the standard deviation of 15 blank samples. n is the number of samples and m the number of replicates.
Results and Discussion
The objective of this work was to develop a methodology to determine the active principle of olanzapine in a mixture of seven pharmaceutical excipients (lactose, microcrystalline cellulose, poloxamer, crospovidone, silicon dioxide, magnesium stearate and coating mixture) in laboratory samples using a simple, rapid and non-destructive method. The raw NIR spectra (27 laboratory samples and 18 commercial samples) show the main effect of variations on NIR-spectra (baseline offset and overlapping peak). The spectrum for the pharmaceutical preparation was highly similar to that for all excipients, being consistent with the low concentrations of the active principle. The best models obtained during the pretreatment stage utilized Savitzky-Golay smoothing (with a window of 7 points), MSC and the first derivative of the Savitzky-Golay polynomial (with a window of 7 points), as can be seen in Figure 3.
A PLS-regression model was developed for active principle and validated by leave-one-out full-cross-validation and the optimal number of PLS factors chosen like the minimum in the graph of residual variance versus
the number of factors. PLS is a mathematical method that is able to describe the covariance between multidimensional NIR spectral data and response variables by means of a small number of latent variables or PLS factors. Six latent variables were found to sufficiently describe the variance in the spectra (99%). The performed calibration models achieved low RMSEC (3.2 × 10⁻³% m/m), RMSEP
(4.0 × 10⁻³% m/m) and high regression coefficients for
calibration (rc = 0.95) and prediction (rp = 0.93). Figure 4
values of the laboratory samples in the calibration and validation sets. The diagonal black line represents ideal results, where the closer the points plot to the diagonal, the better the fit to the model. All the calculated concentrations including samples of both calibration and test sets were close to the real values.
In order to gain further insight into the accuracy of the methods, linear regression analysis of nominal versus
found concentration values was applied. The estimated intercept and slope were compared with their ideal values of 0 and 1 using the EJCR test. EJCR calculations are a convenient means to ascertain if bias exists in determining both parameters when using the PLS model. As can be seen in Figure 5, the point (a = 0, b = 1) was inside the EJCR, therefore it can be concluded that constant and proportional bias are absent.
Based on the comparison analysis above, PLS model with smoothing, MSC and first derivative spectral pretreatments were applied to predict the olanzapine of 12 unknown samples (laboratory samples, n = 1-6, commercial samples, n = 7-12) after similar spectral pretreatment to the calibration ones, as is shown in Table 1. To compare the methods between conventional (HPLC) measurement and PLS algorithm, the paired t-test method was applied. The paired t-test revealed no significant statistical difference between the two methods (NIR and HPLC) at a 95% confidence level (p = 0.05 and t = 1.06). The repeatability of the chromatographic method was followed as described by ANVISA22 and assessed by the injection of the standard
preparation at the sample concentration of all samples (100 ppm) in six replicates, according to the HPLC analysis. The HPLC method presented a precision with RSD 0.042%.
Figure 3. NIR derivative spectra of the active principle of olanzapine (gray line) and original 27 laboratory samples and 18 commercial samples after pretreatment [(Smoothing, MSC and a Savitzky-Golay first derivative, black line)].
Figure 5. Elliptical joint confidence region for the regression slope and intercept of predicted versus reference concentration of olanzapine using an external validation set by PLS model.
Figure 4. Predicted versus reference concentration from calibration and validation samples for olanzapine using the PLS model. () calibration set; () validation set.
Table 1. Comparison results with reference method for commercial samples by NIR and HPLC
Sample Concentration / % (m/m) Predicted (NIR) Reference (HPLC)
1
laboratory
0.034 0.033
2 0.044 0.047
3 0.036 0.045
4 0.054 0.060
5 0.042 0.043
6 0.013 0.012
7
commercial
0.028 0.023
8 0.021 0.023
9 0.023 0.023
10 0.025 0.023
11 0.023 0.024
12 0.022 0.024
NIR: near infrared spectroscopy; HPLC: high performance liquid chromatography.
Figure 3. NIR derivative spectra of the active principle of olanzapine (red line) and original 27 laboratory samples and 18 commercial samples after pretreatment [(Smoothing, MSC and a Savitzky-Golay first derivative, black line)].
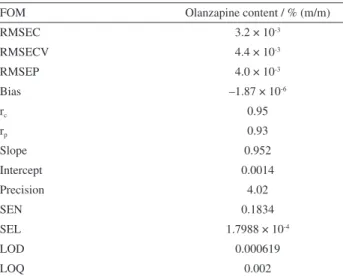
New analytical methods must be validated prior to use by the pharmaceutical industry. The proposed NIR method was validated in accordance with ICH guidelines by assessing its selectivity, sensitivity, analytical sensitivity, precision, accuracy, limit of detection and limit of quantification. Table 2 presents the FOM assessed for the optimized model. Accuracy values represented by RMSEC and RMSEP indicated the estimated multivariate model values exhibited acceptable agreement with the reference method. Precision at a level of repeatability was assessed by analyzing five samples/ten replicates per sample, with measurements recorded on the same day, through an estimate of the relative standard deviation (RSD). The method was considered precise, with a repeatability RSD value of 4.02%. Trueness was estimated through absolute error parameters, such as a RMSEP of 4.0 × 10⁻³% m/m.
Trueness and precision results corroborated that the method can be considered accurate. Considering accuracy and linearity studies, the analytical working range was defined from 1.0 to 12.5% for olanzapine. Acceptable results were observed for sensitivity and sensibility to the evaluated parameters, considering the analytical range of the model. The results estimated for LOD and LOQ values might be optimistic.
Conclusions
A NIR method was developed that allows for pharmaceutically determining olanzapine accurately and
precisely in commercial drug products with minimal sample treatment. According to the results, PLS is presented as a good regression method to be used together with pretreatment steps that must be performed initially on the sample spectra, ensuring the construction of good calibration models and consistent prediction results. The NIR method was compared with the conventional (HPLC) method for tablet samples; no difference was found at 95% confidence interval. The values for accuracy, precision, and other figures of merit exhibited promising results, indicating that the model developed by NIR spectroscopy for olanzapine can be used as an alternative methodology for pharmaceutical purposes.
Acknowledgments
Marcelo V. P. Amorim would like to thank the Center for Food and Drug Research (NUPLAM/UFRN) for all materials and equipment, and PPgDITM-UFRN and PPGQ-UFRN for scientific support. K. M. G. Lima acknowledges the CNPq (grant 305962/2014-4) for financial support. F. S. L. Costa would like to acknowledge the financial support from the PPGQ/UFRN/CAPES for a fellowship.
References
1. Seeman, P.; Can. J. Psychiatry 2002, 47, 27.
2. Citrome, L.; Holt, R. I. G.; Walker, D. J.; Hoffman, V. P.; Clin. Drug Invest. 2011, 31, 455.
3. Navari, R. M.; Eur. J. Pharmacol. 2014, 722, 180.
4. Boulton, D. W.; Markowitz, J. S.; DeVane, C. L.; J. Chromatogr. B: Biomed. Sci. Appl. 2001, 759, 319.
5. D’Arrigo, C.; Migliardi, G.; Santoro, V.; Spina, E.; Ther. Drug Monit. 2006, 28, 388.
6. Kasper, S. C.; Mattiuz, E. L.; Swanson, S. P.; Chiu, J. A.; Johnson, J. T.; Garner, C. O.; J. Chromatogr. B: Biomed. Sci. Appl. 1999, 726, 203.
7. Nirogi, R. V. S.; Kandikere, V. N.; Shukla, M.; Mudigonda, K.; Maurya, S.; Boosi, R.; Yerramilli, A.; J. Pharm. Biomed. Anal. 2006, 41, 935.
8. Hamm, G.; Bonnel, D.; Legouffe, R.; Pamelard, F.; Delbos, J.-M.; Bouzom, F.; Stauber, J.; J. Proteomics2012, 75, 4952. 9. Hertrampf, A.; Sousa, R. M.; Menezes, J. C.; Herdling, T.;
J. Pharm. Biomed. Anal. 2016, 124, 246.
10. Sánchez-Paternina, A.; Román-Ospino, A. D.; Martínez, M.; Mercado, J.; Alonso, C.; Romañach, R. J.; J. Pharm. Biomed. Anal.2016, 123, 120.
11. Alvarenga, L.; Ferreira, D.; Altekruse, D.; Menezes, J. C.; Lochmann, D.; J. Pharm. Biomed. Anal. 2008, 48, 62. 12. Blanco, M.; Bañó, R. G.; Bertran, E.; Talanta2002, 56, 203. 13. Boyer, C.; Gaudin, K.; Kauss, T.; Gaubert, A.; Boudis, A.;
Table 2. FOM (figures of merit) for the best performing PLS model: olanzapine in % m/m
FOM Olanzapine content / % (m/m)
RMSEC 3.2 × 10⁻³
RMSECV 4.4 × 10⁻³
RMSEP 4.0 × 10⁻³
Bias –1.87 × 10⁻⁶
rc 0.95
rp 0.93
Slope 0.952
Intercept 0.0014
Precision 4.02
SEN 0.1834
SEL 1.7988 × 10⁻⁴
LOD 0.000619
LOQ 0.002
Verschelden, J.; Franc, M.; Roussille, J.; Boucher, J.; Olliaro, P.; White, N. J.; Millet, P.; Dubost, J.-P.; J. Pharm. Biomed. Anal.2012, 67-68, 10.
14. Neves, A. C. O.; Soares, G. M.; de Morais, S. C.; da Costa, F. S. L.; Porto, D. L.; de Lima, K. M. G.; J. Pharm. Biomed. Anal. 2012, 57, 115.
15. Blanco, M.; Alcalá, M.; Anal. Chim. Acta2006, 557, 353. 16. Blanco, M.; Valdés, D.; Llorente, I.; Bayod, M.; J. Pharm. Sci.
2005, 94, 1336.
17. Bodson, C.; Rozet, E.; Ziemons, E.; Evrard, B.; Hubert, P.; Dellatre, L.; J. Pharm. Biomed. Anal. 2007, 45, 356.
18. Xie, Y.-L.; Kalivas, J. H.; Anal. Chim. Acta1997, 348, 29. 19. Makino, Y.; Ichimura, M.; Oshita, S.; Kawagoe, Y.; Yamanaka,
H.; Food Chem. 2010, 121, 533.
20. Shao, Y.; Zhao, C.; Bao, Y.; He, Y.; Food Bioprocess Technol. 2012, 5, 100.
21. Thompson, M.; Ellison, S. L. R.; Wood, R.; Pure Appl. Chem. 2002, 74, 835.
22. Agência Nacional de Vigilância Sanitária (ANVISA); Resolução No. 899, Guia para Validação de Métodos Analíticos e Bioanalíticos; Brasília, Brasil, 2003.
23. Farmacopeia Brasileira, 5ª ed.; Agência Nacional de Vigilância Sanitária (ANVISA): Brasília, 2010.
24. EMEA/CHMP/CVMP/QWP; Guideline on the Use of Near Infrared Spectroscopy by the Pharmaceutical Industry and
the Data Requirements for New Submissions and Variations, Agency of European Union: London, UK, 2009.
25. El-Hagrasy, A. S.; D’Amico, F.; Drennen, J. K.; J. Pharm. Sci. 2006, 95, 392.
26. Mariani, N. C. T.; da Costa, R. C.; de Lima, K. M. G.; Nardini, V.; Cunha Jr., L. C.; Teixeira, G. H. D. A.; Food Chem. 2014,
159, 458.
27. Kennard, R.; Stone, L.; Technometrics1969, 11, 137. 28. Braga, J. W. B.; Poppi, R. J.; Quim. Nova2004, 27, 1004.
Submitted: May 24, 2016