Article
*e-mail: ronei@iqm.unicamp.br
Determination and Validation of Nimesulide in Pharmaceutical Formulation by
Near Infrared Spectroscopy
Werickson F. C. Rocha,a André Luis Rosa,b José Antônio Martinsb and
Ronei Jesus Poppi*,a
aInstitute of Chemistry, University of Campinas, CP 6154, 13083-970 Campinas-SP, Brazil
bInstituto Vita Nova, Rua Barão de Itapura,135, Pq Odimar, 13186-481 Hortolândia-SP, Brazil
A determinação de nimesulida em formulações farmacêuticas na faixa de 10,38 a 39,47% m/m foi estudada e validada empregando iguras de mérito, espectroscopia no infravermelho próximo e calibração multivariada baseada no método dos mínimos quadrados parciais (PLS) e no sinal analítico líquido (NAS). Resultados satisfatórios foram obtidos com limite de detecção de 0,61%, limite de quantiicação de 2,03%, erro médio quadrático de predição (RMSEP) de 1,05%, seletividade média 0,006, sensibilidade de 0,004%, inverso da sensibilidade analítica de (0,20%)−1
e relação sinal-ruído de 181. Além disso, obtiveram-se erros relativos menores que 10%, que são valores aceitáveis para o controle de qualidade desse fármaco. Esses resultados indicam que o método proposto pode ser utilizado na indústria farmacêutica como uma alternativa ao procedimento padrão de análise.
The determination of nimesulide in pharmaceutical formulation in the range of 10.38 to 39.47% m/m using near infrared spectroscopy and multivariate calibration based on partial least squares (PLS) and net analyte signal (NAS) was studied and validated by establishing its igures of merit. Suitable results were obtained, with limit of detection of 0.61%, limit quantiication of 2.03%, accuracy estimated as root mean square error of prediction (RMSEP) of 1.05%, mean selectivity of 0.006, sensitivity of 0.004%, inverse analytical sensitivity of (0.20%)−1 and
signal-to-noise ratio of 181. In addition, it was obtained relative errors lower than 10% that are acceptable values for quality control of this drug. These results indicate that the proposed method can be used in pharmaceutical industries as an alternative to standard analytical procedures.
Keywords: near-infrared spectroscopy, nimesulide, igures of merit, net analyte signal
Introduction
Nimesulide is a non-steroidal anti-inlammatory drug (NSAID) with analgesic and antipyretic properties and its approved indications are the treatment of acute pain, the symptomatic treatment of osteoarthrosis and primary dysmenorrhoea in adolescents and adults above 12 years
old.1 It is among the top 5 non-steroidal anti-inlammatory
drugs worldwide2 and its chemical structure is shown in
Figure 1. Excipients3 usually found in pharmaceutical
products which have the drug nimesulide are: powdered cellulose, monohydrate lactose, sodium lauryl sulphate,
magnesium stearate, croscarmellose sodium, and povidone. Both powdered cellulose and lactose monohydrate are used as diluents while sodium lauryl sulphate and magnesium stearate are used as lubricant. Croscarmellose sodium is used as a disintegrant. In tableting, povidone is used in the binders wet granulation processes.
For the determination of nimesulide content, European Pharmacopoeia recommends potentiometric titration
in water-acetone (30:20 v/v) using 0.1 mol L-1 sodium
hydroxide as titrant.4 Also, it has been quantified
mainly in pharmaceutical formulations by HPLC with
spectrophotometry and mass spectrometry.5 There is also
report of application for the determination of nimesulide
are accurate, they are tedious and time-consuming and require extensive sample preparation.
In recent years, the advantages of near infrared spectroscopy (NIR) over other analytical techniques have
increased its acceptance in various analytical science ields.7
Most of the advantages of NIR spectroscopy come from the possibility of using intact samples presented directly to the instrument without any pre-treatment. This fact implies in promoting non-conventional interaction of the radiation with matter in order to extract the spectral information and generate many different measurement modes.
NIR spectroscopy has proved to be a suitable tool for
pharmaceutical analysis,8 providing the basis for predicting
several chemical9 and physical properties from a single
spectrum sample.10 By means of powerful multivariate
techniques such as partial least-squares regression (PLS), each property of interest can be regressed against the NIR spectra, resulting in a calibration model that can be used, in sequence, to predict the property values for a given test sample.
Recently, a new multivariate method has been proposed based on the concept of net analyte signal (NAS). Based on
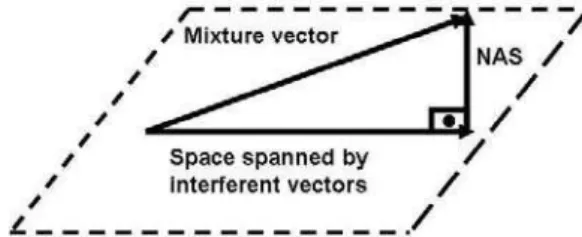
Lorber’s deinition11 for spectroscopic methods, the NAS
is the part of the sample spectrum that is orthogonal to the space spanned by the spectra of all constituents except the
analyte, i.e., all interfering constituents (Figure 2). Since the
NAS vector indicates a direction only affected by changes in the analyte concentration, it can be used in a fully selective procedure for the analyte determination.
For the calculation of the NAS, the matrix X, referent
to the sample spectra, is rebuilt based on A latent variables
calculated by PLS, yielding the matrix X^A. Subsequently,
the matrix free from the contribution of the analyte of interest k ( X^A,-K) is calculated as:12
(1)
where y^
A,-K is the concentration vector projected down onto
the A-dimensional space calculated by PLS and the ‘+’ superscript is the Moore-Penrose pseudo inverse.
The NAS vector for the calibration or validation sample
^
XA,nas
K can be written as:
(2)
where I is the identity matrix of appropriate size and X^A,nasK
is the NAS vector. It is important to note that X^A,nasK contains only the information of analyte k, thus it is possible to replace it by its Euclidean norm, generating a scalar nâs:
(3)
since the experimental responses of analyte k can be expressed as a scalar value, an univariate inverse calibration model can be built by the least squares method as:
(4)
where nâs and y are the NAS and the reference values for
the calibration samples and b^nas is the regression coeficient
of the pseudo univariate model. A more detailed description
of NAS calculation can be found elsewhere.13
The NAS also offers the possibility of estimating analytical figures of merit and method performance. Figures of merit are parameters used for characterization, comparison or development of new analytical methods. Different igures of merit such as limit of detection, limit of quantiication, sensitivity and selectivity have been reported in the literature to quantify the quality of a given
multivariate model.13,14
The knowledge of the detection or quantiication limits for a given analytical method and for a speciic analyte can help the development and the validation of accurate models for determining low analyte contents.
The aims of this work were to built and validate multivariate calibration models for determination of nimesulide in pharmaceutical formulation using near infrared spectroscopy. For this purpose, igures of merit such as: sensitivity, analytical sensitivity, selectivity, accuracy and signal to-noise ratio were calculated, and the model results were compared with reference values obtained by standard methods to conirm the applicability of the proposed method.
Figure 2. Geometrical representation of NAS vector. The NAS vector is orthogonal to the space spanned by the interferent vectors.
Analytical igures of merit
Accuracy
This igure reports the closeness of the agreement between the reference value and the value found by the calibration model. In multivariate calibration, this is generally expressed as the root mean square error of the prediction (RMSEP), that is an approximation of the
standard error of the prediction samples, obtained as:15
(5)
where n is the number of prediction samples.
Signal-to-noise ratio
This parameter represents how much the signal of the analyte is larger than the instrumental noise. In the present case, this is calculated for each sample as:
(6)
where δx is an estimate for the instrumental noise. The
instrumental noise was calculated by recording ten spectra for ten blank samples, calculating the norm of the NAS for each sample, and the corresponding pooled standard
deviation.13
Sensitivity
The sensitivity indicates to what extent the response due to a particular analyte varies as a function of its concentration. In inverse multivariate calibration models,
it is deined as:14
(7)
where the vector of sensitivities S^knas must be the same for
all calibration samples, X^knas is the vector for the net analyte
signal for the k analyte and yi is the reference value of the
sample i. A unique value of sensitivity can be estimated as:
(8)
Analytical Sensitivity
The analytical sensitivity, γ, which is deined in analogy
to univariate calibration, is calculated as:
(9)
The minimum concentration difference which is statistically discernible by a method can be expressed as
γ−1 (γ−1 = 1/γ). Thus, the inverse of the analytical sensitivity
establishes a minimum concentration difference that is discernible by the analytical method considering the random experimental noise as the only source of error, regardless of the speciic technique employed.
Selectivity
Selectivity is deined in multivariate calibration by the
ratio of the scalar nasi for each sample and the Euclidean
norm of the original vector of the instrumental responses:
(10)
where the subscript “i” is the reference value of the sample i.
Limit of detection (LOD)
Following the IUPAC recommendations, the LOD can be deined as the minimum detectable value of net signal (or concentration) for which the probabilities of false
negatives (β) and false positives (α) are 0.05.16 The LOD
can be calculated analogously as for univariate calibration:17
(11)
Limit of quantiication ( LOQ)
The ability of quantiication is generally expressed in terms of the signal or analyte concentration value that will produce estimates having a speciied relative standard
deviation.16 Following the same assumptions described
above, the LOQ in multivariate calibration has been
calculated by:18
(12)
It should be emphasized that according to oficial guidelines and the aims of the proposed method, estimations of LOD and LOQ are not required. However, they were calculated because this information can be relevant in others determinations.
Bias
According to the IUPAC definition,16 bias is the
The occurrence of systematic errors was investigated by a
t-test described in the ASTM E1655-00.19 Firstly, an average
bias is calculated for the validation set:
(13)
where n is the number of samples in the validation set. Then the standard deviation of validation (SDV) is obtained by:
(14)
Finally, the t value is given by:
(15)
If the t calculated is greater than the critical t value at the 95% conidence level, there is evidence that the bias included in the multivariate model is signiicant.
Experimental
It was prepared 69 synthetic samples containing the active principle (nimesulide) in the range 10.38-39.47% m/m in excipient (powdered cellulose, sodium lauryl sulphate, magnesium stearate, croscarmellose sodium, povidone, and monohydrate lactose), according to the ternary diagram shown in Figure 3. As lactose is the main excipient component, in the experimental design proposed for sample
preparation, it was considered a single factor (such as the nimesulide). A mixture of other excipients was also considered a single factor.
Adopting the same experimental conditions, three lots of commercial samples of nimesulide pharmaceutical formulation were also analyzed. The concentrations of these samples were previously established using the standard method used in the pharmaceutical industry based on dilution followed by spectrophotometric measurement in the UV region. The results obtained by the standard method were compared with those obtained by proposed NIR methodology and the errors were estimated.
All samples were weighted in an analytical balance with accuracy of 0.00001 g and samples with total mass of 200 mg were prepared. In this preparation, the solid constituents of the pharmaceutical formulation were mixed during 5 min using a vortex for homogenization and inally they were put into a mill for 1 min. It was used approximately 10 mg of the mixture for spectrometric measurements.
The spectra were collected at a Thermo Nicolet Antaris FT-NIR Analyser, equipped with a tungsten filament source, integration sphere module and a AsInGa detector. Acquisition of the spectra was accomplished in the range
of 4000-10000 cm−1 using 32 scans and resolution of
4 cm−1. Data analysis was performed in Matlab version
6.5 using routines developed in our laboratory and using PLS Toolbox, version 4.21 from Eigenvector Technologies.
Results and Discussion
The irst step for the model development was split the samples in calibration set (49 samples) and validation
set (20 samples) using the Kennard-Stone algorithm.20
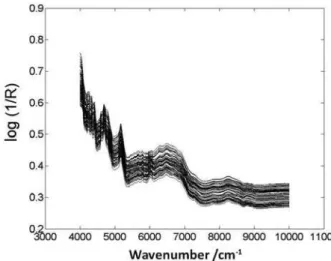
The diffuse relectance NIR spectra of the samples are presented in Figure 4. It is possible to observe additive/
Figure 3. Experimental design for sample preparation. *Other excipients:
powdered cellulose, sodium lauryl sulphate, magnesium stearate,
Figure 5. NIR spectra of nimesulide samples after correction with MSC.
Figure 6. Plot of predicted versus reference values for nimesulide by PLS. Calibration (o) and validation (+) samples.
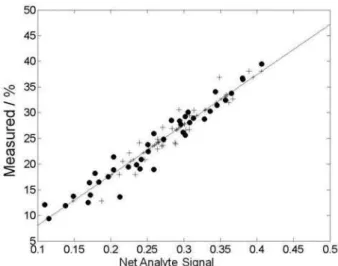
Figure 7. Plot of NAS versus reference values for nimesulide. Calibration
(o) and validation (+) samples.
signiicant difference in the determination of concentrations of nimesulide in pharmaceutical formulation given by the two models.
The value found for the paired t-test was 0.84 and the critical value of t is 2.09 (P = 0.05). Then, it was concluded that the methods do not provide signiicantly different values for determination of nimesulide in pharmaceutical formulation.
Furthermore, the percentile relative errors concerning these its are shown in Figures 8 and 9. In these igures, the calibration samples errors present a random distribution, indicating a suitable it. The calculation of the relative errors was performed by using the equation 16 below:
(16)
yref contains the values for concentration of nimesulide and
ypredis the value predicted by the model.
Also, in these igures, it is possible to notice, that the majority of predictable samples have relative errors lower
than ±6% that are acceptable limits for quality control.22
Figure 8 refers to the PLS model errors. Analyzing this igure it is possible to notice that only 3 validation samples have errors higher than 4%. However, in Figure 9, which shows the errors related to the adjust of the pseudo-univariate model, there are 8 validation samples with errors greater than 4%.
On the other hand, analyzing all the validation samples it is possible to assume that most of them present errors of the same level, as a result these models do not have signiicant differences as shown in the paired t-test. multiplicative effects in spectral data, typical of solid
measurements. These effects were corrected by the utilization of MSC (multiplicative scatter correction), while for the concentration vector no pre-processing was used. The spectra after scattering correction are shown in Figure 5.
The PLS model was built using 6 latent variables. This number was chosen because it presented a lower root mean squares error of cross-validation (RMSECV) and
explains 100% of X variance and 99.93% of y. Therefore,
a calibration model was also built in its pseudo univariate form using NAS. In the following Figures 6 and 7 the reference values are shown against the predicted values using PLS and pseudo-univariate model, respectively. It is possible to notice a good it between the reference values and the ones predicted by the models. Besides that, for
this adjust comparison, it was performed a paired t-test,21
The validation of the multivariate calibration model was performed by the determination of parameters known as igures of merits. Results for the igures of merit are presented in Table 1. Accuracy values represented by RMSECV (root mean square error of cross validation), RMSEC (root mean square error of calibration) and RMSEP (root mean square error of prediction) show that the estimated values are close to the reference ones prepared in laboratory, since those values are about 1%. Therefore, it is possible to conclude that these errors are acceptable for quality control of nimesulide in pharmaceutical
formulation.22 Regarding the signal-to-noise ratio, it was
found the maximum value of 181, which means that the scalar NAS is approximately 181 greater than the instrumental noise. This result shows that the obtained signal suffers small inluence from the instrumental noise which allows reaching even smaller values of detection and qualiication limits. Considering the detection and quantiication limit values, it can be concluded that the
developed NIR model can only detect values higher than 0.61% of nimesulide and for quantiication the model cannot determine values below 2.03% of nimesulide. Since the concentration of nimesulide varies in the range of 10.38-39.47%, the proposed method can be considered eficient to detect and quantify this active principle in pharmaceutical formulations. The model presented a
low sensitivity value (0.004%)−1, probably due to the
preprocessing applied in the spectral data. The value for the inverse analytical sensitivity, presented in Table 1, can be interpreted in a clearer way, since it has a direct relation with the concentration. According to this value, the model is able to distinguish samples with different concentrations in the order of 0.2%. Since the concentration values among the samples are higher than 0.2%, the model is suitable to differentiate all samples here used. The value found for the model selectivity was 0.006. It means that, about less than 1% of the information of the analyte contained in the spectrum of the sample is orthogonal to the space of interferences, or, used for the model development. The selectivity indicates that around 99% of the analytical signal is removed during the NAS calculation. This result suggests that, for the multivariate calibration model, the selectivity parameter only informs the quantity of the original signal used by the model.
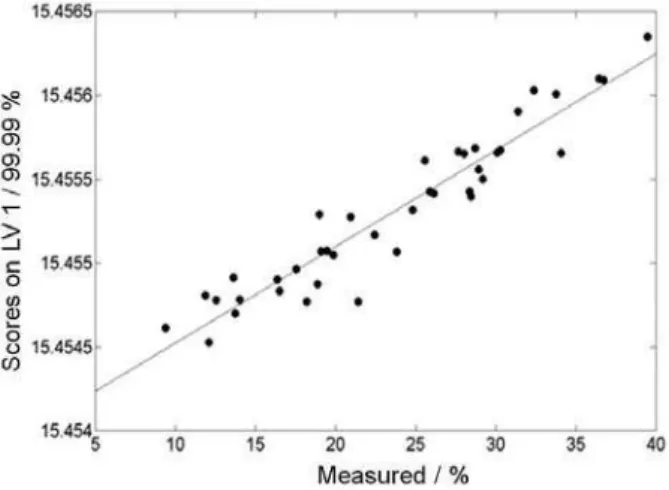
The quantitative measurement of linearity in multivariate calibration models is not simple, or even possible. Qualitatively the plot of the errors of the calibration and validation samples can indicate whether the data follows a linear behavior or not. The random distribution of these errors is an indication of linear behavior. Figures 8 and 9 show a random distribution of the errors and consequently a linear behavior. Another way to visualize this behavior is the plot of the irst latent variable of PLS model against the nimesulide concentration. Figure 10 presents this plot, where it is clearly observed a tendency to a linear behavior. It must be pointed out that in this analysis it was taken into Table 1. Analytical igures of merit.
Accuracya RMSECV 0.98
RMSEC 0.65
RMSEP 1.12
Sensitiviyb 0.004
Analytical sensitivitya 4. 9
Selectivity 0.006
S/N ratio Maximum 181
Limit of detectiona 0.61
Limit of quantiicationa 2.03
aResults in % nimesulide. bResults in % nimesulide-1. Figure 8. Relative errors obtained by the PLS model. Calibration ()
and validation (+) samples.
account only the irst latent variable that explains most part of the data variance. Consequently the points that present a deviation of linear behavior should not be understood as linear deviations, because the PLS model uses 6 latent variables.
The presence of relevant bias was tested with the predicted results for the validation samples by the t-test
suggested by ASTM E1655-00.19 The results showed that
the bias included in the model was not signiicant, since
the t value obtained of 0.31 is lower than the critical value
of 2.10 with 95% of conidence.
In respect to the commercial samples of three different lots, compared with the standard method based on extraction and UV-analysis, errors calculated using equation 16 were 3, 5 and 6%. The results obtained can be considered satisfactory, since errors lower than 6% were obtained and they are acceptable for quality control.
Conclusions
The determination of the nimesulide in pharmaceutical formulations was accomplished using diffuse relectance NIR spectroscopy and multivariate calibration based on PLS and NAS. The models were built and validated by determination of the igures of merit, obtaining feasible and acceptable results. The prediction errors estimated were all below to 7% and it was possible to determine the limits of detection and quantiication. The method showed a large sensitivity capacity, differentiating concentrations of 0.2%. The values for linearity, selectivity, and S/N ratio also showed results in acceptable levels that make the application of the proposed method as a possible alternative to the standard method, which is based on that extraction and UV-analysis.
Figure 10. Scores of the 1st latent variable versus the nimesulide % in
the calibration samples.
It can also be concluded that by using NAS it was possible to developed models of multivariate calibration in a pseudo-univariate calibration, similar to univariate calibration, making clearer the results interpretation. Moreover, the proposed method allows the analysis of a given sample in less than 3 min, while the analysis used by the pharmaceutical industry takes approximately 30 min. This demonstrates the rapidity of the proposed method compared to the standard method used by the pharmaceutical industry.
Acknowledgments
The authors thank the CAPES, CNPqand International
Institute of Pharmaceutical Researches (IIPF) for fellowships and financial support of their research projects.
References
1. Rainsford, K. D.; Nimesulide: Actions and Uses; Birkhauser Verlag: Bassel, 2005.
2. Goodman, L. S.; Gilman, A.; The Pharmacological Basis of Therapeutics, 9th ed., Macmillan Publishing Co: New York, 1975.
3. Rowe, R. C.; Sheskey, P. J.; Owen, S. C.; Handbook of Pharmaceutical Excipients, 5th ed., American Association,
Washington, DC, 2006.
4. European Pharmacopoeia, 3rd ed., Council of Europe:
Strasbourg, 1997.
5. Starek, M.; Krzek, J.; Talanta2009, 77,925.
6. Álvarez-Lueje, A.; Vásquez, P.; Núñez-Vergara, L. J.; Squella, J. A.; Anal. Lett. 1998, 31, 1173.
7. Pasquini, C.; J. Braz. Chem. Soc. 2003, 14, 198.
8. Mantanus, J.; Ziémons, E.; Lebrun, P.; Rozet, E.; Klinkenberg, R.; Streel, B.; Evrard, B.; Hubert, P.; Talanta 2010, 80, 1750. 9. Martnes, H.; Naes, T.; Multivariate Calibration, John Wiley &
Sons: Chichester, 1991.
10. Otto, M.; Chemometrics: Statistics and Computer Application in Analytical Chemistry, Wiley-VCH Verlag: Weinheim, 1999. 11. Lorber, A.; Faber, K.; Kowalski, B.; Anal. Chem.1997, 69,
1620.
12. Ferré, J.; Brown, S. D.; Rius, F. X.; J. Chemometr.2001, 15, 537.
13. Braga, J. W.; Poppi, R. J.; J. Pharm. Sci.2004, 93, 2124. 14. Valderrama, P.; Braga, J. W.; Poppi, R. J.; Quim. Nova2009,
32, 1278.
15. Faber, N. M.; J. Chemometr. 1998, 12, 405. 16. Curie, L. A.; Anal. Chim. Acta 1999, 391,105.
17. Boqué, R.; Rius, F. X.; Chemom. Intell. Lab. Syst.1996, 32, 11. 18. Boqué, R.; Faber, N. M.; Rius, F. X.; Anal. Chim. Acta 2000,
19. Annual Book of ASTM Standards, Standard Practices for Infrared Multivariate Quantitative Analysis- E1655-00, ASTM International, West Conshohocken: Pennsylvania, USA, 2000. 20. Kennard, R. W.; Stone, L. A.; Technometrics1969, 11, 137. 21. Skoog, D. A.; West, D. M.; Holler, F. J; Fundamentals of
Analytical Chemistry, Saunders College Publishing: Florida, 1992.
22. The United States Pharmacopoeia, 25th revision, U.S.
Pharmacopoeia Convention: Rockville, 2002.
Submitted: February 17, 2010 Published online: July 1, 2010


