Artigo
*e-mail: [email protected]
ELUCIDATION OF THE ELECTRONIC SPECTRUM CHANGES OF KA-Al3+ COMPLEX BY POTENTIOMETRIC
TITRATION, FTIR, 13C RMN AND QUANTUM MECHANICS
Mário S. Piantavinia, Alan G. Gonçalvesa,Ângela C. L. B. Trindadea, Miguel D. Nosedab, Ana L. R. Mercêc, Antonio E. H.
Machadod and Roberto Pontaroloa,*
aDepartamento de Farmácia, Universidade Federal do Paraná, 80210-170 Curitiba – PR, Brasil bDepartamento de Bioquímica, Universidade Federal do Paraná, 81531-990 Curitiba – PR, Brasil cDepartamento de Química, Universidade Federal do Paraná, 81531-990 Curitiba – PR, Brasil dInstituto de Química, Universidade Federal de Uberlândia, 38400-902 Uberlândia – MG, Brasil
Recebido em 29/12/2016; aceito em 03/04/2017; publicado na web em 31/05/2017
Kojic acid (KA) is an organic acid widely used in pharmaceutical industry, mainly as a skin lightening agent. Based on the ability of KA to form complexes with ions, we found the most possible kind of complex formed with cation aluminum. KA-Al3+ complex structures were studied using potentiometric and spectrophotometric (UV) titrations, FTIR and 13C NMR. The electronic spectroscopy showed that the KA-Al3+ complexes absorb at higher wavelengths (λ
max= 305 nm) than do the non-complexed KA (λmax= 269 nm), confirming complexation. The IR spectra of KA complexed and not complexed allowed us to correlate the changes in the absorption of enol and carbonyl groups in absence and presence of Al3+ in aqueous solutions. The complexation suggested by the potentiometric titration and FTIR spectroscopy are in accordance with the data obtained from NMR results. Calculations based on quantum mechanics were utilized to understand the differences found in the noncomplexed and complexed KAH electronic spectra Keywords: Kojic acid; aluminium complexes; spectrophotometry; complexometry; DFT/TDDFT.
INTRODUCTION
Kojic acid (KAH), 5-hydroxy-2-(hydroxymethyl)-4H-pyran-4-one, is an organic acid that was first isolated by Saito in 1907 from mycelia of Aspergillus oryzae.1 KAH has shown to be an effective
metal chelator, forming complexes with metal ions,2 such as,
copper,3 iron4 and aluminum.5 Other metals including magnesium
and manganese,6 nickel and zinc,7 organometallic compounds8 and
cadmium9 have also been studied in complexes involving KAH.
Cooper-chelating property is probably the main factor related to KAH ability to suppress isolated tyrosinase activity, which is a copper-containing enzyme.10 In addition, KAH can prevent the conversion of
the o-quinones of DL-DOPA to melanin.11 Based on these properties,
it has been used as a food additive to prevent enzymatic browning12
and also employed as skin lightening agent in cosmetics because of its excellent whitening properties.13
Cosmetic preparations based on the association of KAH and hydroquinone have been employed for skin lightening treatments. The quantification of KAH in this type of cosmetics by the use of electronic espectroscopy is considered a challenge. This fact is related to the overlapping of the absorbing bands of KAH and hydroquinone. To overcome this problem, we recently developed a UV method based on KAH aluminium complexation.14 This approach
provides the displacement of the absorbing bands, which gives a more selective analytical method for KAH measurement. Thus, it was considered important to study the complex structures involved in KAH and aluminium complexation, as well as to understand electronic phenomena related to the differences found between the noncomplexed and complexed UV spectra.
Aluminium (III) is one of the most common Lewis acids and has been used for the formation of innumerous coordination compounds. The coordination modes of aluminum span the gamut of structural motifs from low three-coordinate (trigonal planar and
T-shaped) and normal four-coordinate (tetrahedral) to high five-coordinate (trigonal bipyramidal and square pyramidal) and six-coordinate (octahedral) complexes.15 Aluminium (III) complexes with
pyromeconic acid, kojic acid and maltol were investigated because of their neurological properties.16 The Al3+ forms a series of highly
stable Al3+L
n3-n complexes (n=1-3) with kojic acid17 Even though
some of the mentioned studies provided both spectrophotometric experiments and quantum mechanical calculations, a detailed correlation between quantum mechanical calculations and experimental data of KAH aluminum complexes is still uncovered. Theoretical studies with noncomplexed kojic acid and analogues are established in literature18-22 and the complexes from KAH and
vanadium23 by electron paramagnetic resonance (EPR) spectroscopy,
pH-potentiometry and density functional theory DFT methods. The present work contributes to the structural elucidation of KAH:Al3+ complexes through complementary techniques, namely,
potentiometric titration, electron spectroscopy, spectrophotometric UV titrations, 13C NMR and FTIR. In addition, calculations based
on quantum mechanics were utilized to understand the differences found in the noncomplexed and complexed KAH electronic spectra.
EXPERIMENTAL
Chemicals
KA (≥98.0%) and D2O were purchased from Sigma Aldrich
Chem. Co. and methanol (analytical grade) from F. MAIA®. Ultrapure
water was obtained from a Milli-Q® Plus apparatus (Millipore®).
The AlCl3.6H2O solution, in HNO3, was purchased from MERCK ®. Data treatment
For the potentiometric titration data, the first protonation constant of KA was taken from the literature7 and from this present
the HYSS program,8 BEST77 microcomputer software was used to
calculate the protonation and the overall formation constants for the complexed species found higher than 10% of all metal species present at equilibrium. The calculations proceeded until the simulated curve best fit the experimental data. The HYSS (Hyperquad simulation and speciation) program calculated the species distribution diagrams using previously calculated potentiometric titration data as the input.
Potentiometry and spectrophotometry
Spectrophotometric measurements were conducted using an UV/Vis Agilent 8453E spectrophotometer and an UV/Vis Shimadzu 1601PC, both with a 1 cm path length quartz cuvette. Potentiometric titrations were performed with an automatic Titrando 805E potentiometric titrator (METROHM) under inert atmosphere of aqueous KOH saturated nitrogen (White-Martins, Brazil) in a water-jacketed vessel maintained at 25.0 ± 0.1 ºC (Thermostated bath: MQBTC 99-20, Microquímica, Brazil). The pKw used was 13.78 at 25.0 ± 0.1 ºC. The titrant was a CO2-free aqueous solution of standard KOH (Merck, Germany,
0.1 mol L-1, 0.02 mL ± 0.01), and pH values were directly saved
and manipulated using TIAMO (METROHM), BEST77 and HYSS8
software. The concentration of aluminum was determined using an AA-220 FS Varian Atomic Absorption Spectrophotometer and aqueous aluminum ion standards in nitric acid. Speciation distribution diagrams were obtained using HYSS.8 Potentiometric and spectrophotometric
titrations were carried out with 0.1 mmol of KAH and with 0.00, 0.03, 0.05 and 0.1 mmol Al3+ solutions. Constant increments of titrant
volume (0.10 ± 0.02 mL, standardized 0.1 mol L-1 KOH) were added
to the system and it was adjusted to a 0.100 mol L-1 constant ionic
strength (I). The corresponding pH was read and plotted to calculate the protonation values and binding constants of the systems. Each titration was performed in triplicate.
Infrared spectroscopy
The IR spectra of solid KAH and the KAH:Al3+ complexes were
recorded on a MB 100 Bomem FTIR Spectrometer using a DTGS detector. For the final KBr pellets (99% m/m, 1% m/m sample), 64 scans between 400 and 4000 cm-1 were performed. Standard KAH
aqueous solutions (1.06x10⁻⁴ mol L-1) at pH 3, 7, 9 and 14 and KAH
acidic solutions 0.2 % aluminum chloride (molar ratio KA 1:1 Al3+)
at pH 1, 3, 5, 8, 11 and 14 were freeze-dried. The adjustment to basic pH was performed using 0.1 mol L-1 KOH. All samples were
prepared as KBr pellets. IR spectra were collected for KAH as received, and after being dissolved in water and lyophilized. These physical operations were performed for all complexes assayed by IR to confirm that no significant differences were observed between the samples and the standard.
13C NMR
The 13C NMR spectra were recorded on a BRUKER Avance III
400 at 100.63 MHz in D2O 10% at 30 ºC, with acetone used as an
internal standard at 30.20 ppm. Spectra were obtained from standard aqueous KAH solutions (0.07 mol L-1) containing 10% D
2O, with
pHs adjusted to 4, 7, 9, 11 and 14, and aluminum-complexed KAH solutions at pH 2 and 4 (molar ratio 1:1 KA:Al3+) also containing
10% D2O.
Theoretical calculations
The minimum energy geometry of kojic acid and possible Al3+
coordination complexes, formed at different pH, proposed from
experimental data, were minimized and optimized considering implicitly the presence of methanol as solvent using the Integral Equation Formalism variant of the Polarizable Continuum Model (IEFPCM).17 These calculations were performed using Gaussian 09,18
using the B3LYP hybrid functional,19 based on Density Functional
Theory (DFT),20 and the 6-31G (d,p) atomic basis sets.
The absence of negative frequencies in the vibrational frequencies calculated using DFT at the B3LYP/6-31G(d,p) level ensure that the optimized structures are representative of global minimum energy. The theoretical vibrational spectra of KAH and KA- were compared to experimental data. The electronic spectrum was also simulated for KAH, its anionic form and some representative complexes, simulating the solvation in methanol (IEFPCM),17 using the time dependent
approach of DFT, and compared to the experimental absorption spectra. The representation of the electronic and vibrational spectra was obtained using the software GaussView.21
The electronic spectra were calculated using the approach of the time-dependent density functional theory (TDDFT), the same functional hybrid previously mentioned, and the set of atomic bases 6-311++g (2d,p).
The estimating of Gibbs free energy and other thermodynamic parameters for the optimized species were performed with the semi-empirical method PM6 (Ampac).22
RESULTS AND DISCUSSION
Potentiometric titration
The complexed species, with the overall stability constants (log β) associated with the equilibrium in this paper, can be represented using some examples of the generic equations below, where M is the metal ion Al3+, HL is the protonated ligand KAH, and L is the
deprotonated ligand KA.
KA + H = KAH KH = [HL]/([L] x [H]) (1)
KA +Al = AlKA KML= βML = [ML]/([L] [M]) (2)
––––––––––––––––––––– ––––––––––––––––––––––––– H +Al + 2 KA = AlHKA2 βMHL2 = [MHL2]/([L]
2 [M] [H]) (3)
Al + 3 KA = AlKA3 βML3 = [ML3]/([L]3 [M]) (4)
H +Al + 3 KA = AlHKA3 βMHL3 = [MHL3]/([L]
3 [M] [H]) (5)
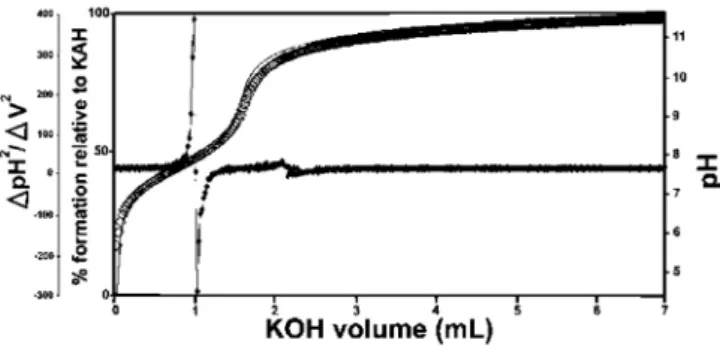
A potentiometric titration profile of KA provides a sharp inflection (Figure 1). The continuous line represents the calculated titration and the sequence of squares represents the experimental titration with the confidence interval calculated using the chi-square test. The calculation was terminated when the best overlap between the curves was reached and the error did not decrease any further.
Based on the presence of two isosbestic points in the UV titration of KAH alone and to verify the probable existence of another inflection in the potentiometric profile, the second derivative of these data was calculate (Figure 1). It was found that there is only one point where the second derivative crosses zero at the maximum variation of the two axes. By looking at this Figure, it is certain that, under the experimental conditions employed, KAH has only one deprotonation, leading to one deprotonation constant value (pKa = 7.68 ± 0.02, 25.0ºC, I= 0.100 mol L-1 KCl), in agreement with other values
reported in the literature.1-5 Through the pH variation, in different
hydroxyl group that is directly bound to the pyran ring.6
Figure 2 shows the potentiometric pH profile of KA and Al3+
with a ligand-to-metal ratio of 1:1. The continuous line represents the calculated profile and the sequence of squares represents the experimental profile with a confidence interval, calculated using the chi-square test. Based on the one deprotonation model and, with the experimental potentiometric titration values from all experiments, the hydrolysis constants, knowing that H-x is x mols of OH-, are: AlH-1
(-5.4091), AlH-2 (-9.9816), AlH-3 (-15.6916), AlH-4 (-23.4551), Al-2H-2
(-7.7), Al-2H
-3 (-9.5742), Al -3H
-4 (-13.6944), Al -3H
-11 (-54.694), Al -6H
-15
(-49.398) and Al-8H
-22 (-76.425)23 and all stoichiometric quantities of
all reagents were calculated. The BEST77 and HYSS8 programs were
used to calculate the binding constants and the species distribution diagrams of all systems studied (ligand-to-metal ratios: 1:1, 1:0.5 and 1:0.3). The greater the agreement between the calculated and experimental curves, the smaller the standard deviation and the more precise the calculated binding constant values.
The species distribution diagram obtained taken the total metal ion concentration as 100%, for KAH and Al3+ in the 1:1 ligand-to-metal
ion ratio demonstrates the formation of complexes early from pH 2 to 12, even in the presence of hydrolytic aluminum species found at pHs higher than 7. According to the same species distribution diagram (Figure not shown), at pH lower than pKa, the most abundant species are [KA3AlH2]+2 and [KA2AlH]+2. At pH > pKa, the most abundant
species are [(KA)2Al] +, [(KA)
3Al] and [(KA)4Al]
- (Table 1).
The complex species [(KA)3AlH]+ was reported in the literature
and detected by mass spectrometry.9 This complex was also found
in the present study and represents 25% of all the species present in the equilibrium at pH 8.5 and higher than 10%. Likewise, the [(KA)2Al]+ complex species is in its highest proportion at pH 8. The
main, potentiometric and NMR, results are in accordance with those found by Toso et al.24
According to Table 1 (potentiometric titration and molecular modeling results), it is possible to correlate the abundance of
species in terms of their stability, estimated in terms of ∆GF. It is suggested that the most abundant species are those with the most negative ∆GF. It was not possible to optimize the isolated species [(KAH)2 Al]
3+, [(KA)
3 Al] and [(KA)6 Al]
3-. Thus, the
species [(KAH)4 Al]3+, [(KA)5 Al]2- and [(KA)4(KAH)Al]- must
be present in the mixture in proportions measured at pH > pKa, similarly to [(KA)Al]2+ and [(KAH)Al]3+, which must exist at pH
< pKa, but probably in concentration lower than 10%, threshold to potentiometric calibration.
The UV spectra of KA- in the presence of aluminum ions were
monitored at various molar ligand-to-metal ratios (1:1, 1:0.5 and 1:0.3) and at different pH values. Above pH 6, all of the studied systems formed insoluble products, preventing any reliable measurement. From pH 2 to 6, the KA UV spectrum showed absorption maxima at 215 and 269 nm. After the addition of the Al3+ acidic solution, the band
at 215 nm remained constant, but the band at 269 nm was displaced to 305 nm as the pH increased. These results are consistent with the formation of complexed species in the solutions tested.
Infrared
The IR spectroscopy is the most widely used technique for the analysis of metal carbonyl complexes.10 This is because the
characteristic frequencies of the carbonyl bond can be seen even in qualitative studies, especially for the metal-carbon π bond carbonyl and the C-O bond.
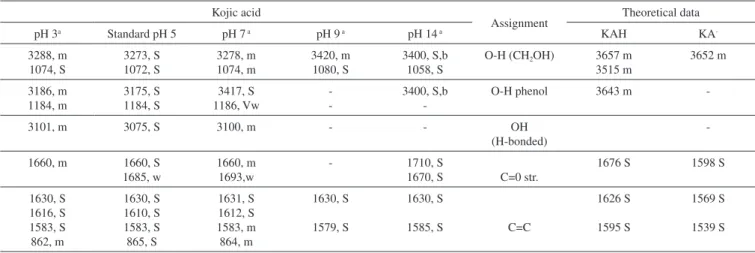
The band assignments for the absorptions of standard KA, in the absence and presence of aluminum ion, can be seen in Tables 2 and 3, respectively. The theoretical frequencies were corrected using the scaling factor recommended for calculations using B3LYP and 6-31G(d,p).11
It is noteworthy the similarity of the KAH theoretical and the experimental values at pH 5 in terms of the absorbing bands related to C=O e C=C bonds. The main band (C=O stretching) that involves the complexes at 1660 cm-1 is close to theoretical data (1676 cm-1)
Figure 1. Potentiometric titration of kojic acid and second derivative of kojic acid potentiometric titration data
Table 1. Complex formation constants KCl at 0.1 mol L-1, I, 25 ºC, and Gibbs
free energy of formation for some of the studied complexes, estimated using the semiempirical model PM6 (AMPAC)
Species ∆GF(300K)/kcal mol-1 log β
KA H -21.45 7.84 ± 0.1
KA- -22.61
H+ -6.32
Al3+ -9.26
[(KA)Al]2+ -22.34 14.7 ± 0.3
[(KAH)Al]3+ -26.97 19.8 ± 0.1 [(KA)2 Al]
+ -31.59 25.9 ± 0.3
[(KA)2AlH]2+ -32.25 34.0 ± 0.6 [(KAH)2 Al]
3+ NOp 39.6 ± 0.1
[(KA)3 Al] NOp 32.5 ± 0.1
[(KA)3AlH]+ -42.15 45.1 ± 0.1 [(KA)3AlH2]
2+ -43.13 52.6 ± 0.1
[(KA)4 Al]- -54.33 44.2 ± 0.6 [(KAH)4 Al]3+ -52.83 77.1 ± 0.3 [(KA)5 Al]2- -63.13 52.8 ± 0.1 [(KA)4(KAH)Al]- -57.30 61.2 ± 0.3 [(KA)6 Al]
3- NOp 57.8 ± 0.7
and do not appear in chelates, indicating a linkage with the metal involving this group.
The main KA IR bands are in accordance with those found in the literature.12-14,25 The regions that significantly changed were
700-800 cm-1, 1100-1050 cm-1 and 1300-1700 cm-1 for all complexes
obtained at pHs higher than 3. The first two regions were used to observe the effect of complexation on the alcohol groups (-C-OH and –C=C-OH), whereas the last region was useful for studying the carbonyl group. Comparing the spectral profile of non-complexed (Table 2) and 1:1 complexed (Table 3) KA, it is possible to observe the differences in all IR spectral ranges. The most significant peaks and assignments monitored included: the primary alcohol at 1070 cm-1,
phenolic OH at 1150 to 1200 cm-1, intramolecular hydrogen bonds at
3050 to 3100 cm-1, which were absent in the complexes’ spectra, and
carbonyl groups at 1660 cm-1. In general, only the non-complexed KA
shows a v(C=O) stretching frequency near 1770 cm-1. Both bands near
1600 cm-1, assigned to the v(C=O) and v(C=C) stretching frequency,
undergo a complexation-promoted bathochromic shift.12 These data
strongly support the theory that KA is coordinated to the aluminum ion through the oxygen atom of the -OH (enolic) group, forming a five-membered chelate.
In accordance with the NMR experimental data obtained, it is very likely that the metal is complexed through the carbonyl (C-4) and hydroxyl enol (C-5) of KAH. This is supported by the spectral differences observed starting around pH 3. All main important absorption bands monitored showed significant differences, especially
the intramolecular hydrogen bonds, which completely disappeared when KA was in the presence of Al3+ above pH 3. Additionally, the
absorptions around 1430 cm-1 (CH2-CO-) and 1390 cm-1 (CO stretch)
of all of the studied spectra showed very significant changes. These changes also help to explain that the complexed KA molecules vibrate differently than KAH alone. These changes in vibration strongly support the intense spectral modification that was observed when KA binds to aluminum. At pH less than 1, significant differences between the spectra of complexed and non-complexed KAH were not observed. Above pH 8, it was not possible to establish spectral differentiation due to the formation of hydrolytic insoluble species as well as aluminates in the Al3+ systems, which prevented further
assessments. In general, the IR results indicated that all complexes studied at pHs higher than 3 were gels and very hygroscopic. Below pH 3, the spectra presented the same profile as KA alone. All IR spectra above pH 3 showed broader bands around 3600 and 2700 cm-1,
thus, complexation must start above pH 3.
NMR
To establish which chemical groups of the KA molecule are involved in the complexation with the aluminum, tests were performed using 13C NMR.
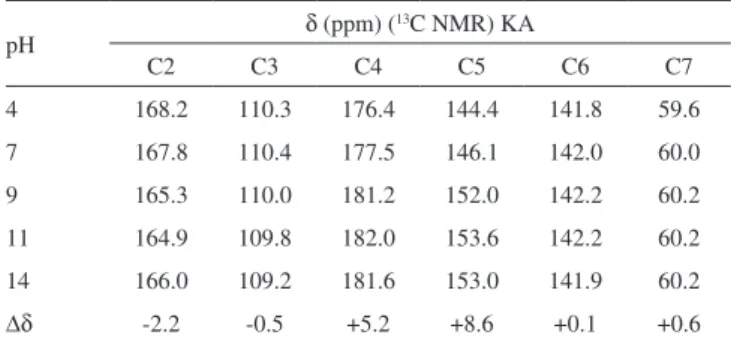
First, KAH was analyzed at different pH values (4.0, 7.0 and 11.0) using 13C NMR to evaluate the effect of the hydroxyl group ionization
on the carbon chemical shifts (Figure 5). Carbons assigned as 2, 4
Table 2. Most significant IR absorptions (4000 to 600 cm-1) in the KA system (pH 3 – 14)
Kojic acid
Assignment Theoretical data
pH 3a Standard pH 5 pH 7 a pH 9 a pH 14 a KAH KA
-3288, m 1074, S 3273, S 1072, S 3278, m 1074, m 3420, m 1080, S 3400, S,b 1058, S
O-H (CH2OH) 3657 m 3515 m 3652 m 3186, m 1184, m 3175, S 1184, S 3417, S 1186, Vw - -3400, S,b
-O-H phenol 3643 m
-3101, m 3075, S 3100, m - - OH
(H-bonded)
-1660, m 1660, S 1685, w
1660, m 1693,w
- 1710, S
1670, S C=0 str.
1676 S 1598 S
1630, S 1616, S 1583, S 862, m 1630, S 1610, S 1583, S 865, S 1631, S 1612, S 1583, m 864, m 1630, S 1579, S 1630, S
1585, S C=C
1626 S 1595 S
1569 S 1539 S
S: strong ; m: medium; w: weak; Vw: very weak; b: broad. a KA pure, solubilized in aqueous solution and subsequently lyophilized.
Table 3. Most significant bands and their likely assignments in the IR spectrum for the KAH complex after a change in pH (KAH/Al3+)
Kojic acid 1:1 Al3+(molar proportion) Assignment
pH 3a pH 5a pH 8a pH 11a pH 14 a
3419, S, b 1078, S
3431, S 1060, Vw
3442, S 1060, Vw
3300, S, b 1070, S 1078, S
3400, S, b 1058, S
O-H (CH2OH)
- 1159, w - 1184, Vw - 1184, Vw
3300, S, b
-3400, S, b
-O-H phenol
- - - OH (H-bonded)
- - - 1699, Vw 1701, Vw C=0 str.
1622, S - 1573, S -1622, m - 1579, m 860, Vw 1622, m - 1573, m 860, Vw 1630, S 1610, S 1585, S -1630, S - 1585, S 860, S C=C
and 5 had significant changes in their chemical shifts with increasing pH (Table 4 and Figure 3).
As the pH varies, C2 is shielded. C4 and C5 are strongly deshielded due to the resonance effect, mainly from C5, which is directly linked to the enolic hydroxyl. The chemicals shifts seen here are very similar to those found by Kingsbury et al.15 Figure 4 (A)
shows a possible resonance model of KA before (A) and after (B) losing a proton.
Similarly, tests were performed with the 1:1 KA:Al3+ molar ratio
solution (chemical shifts in Table 5), but only in the acidic range (pH 2 and 4) because of the formation of insoluble aluminum products at pHs higher than 8.
At pH 2, KAH and Al3+ were not completely complexed, because
there are two groups of signals with significant shifts for each carbon. The first group was practically coincident with the non-complexed KA values. Considering only the chemical shifts from the complexation, there were no significant differences between pH 2 and 4. Comparing, at the same pH, the chemical shifts obtained for KAH and Al3+ in the
1:1 KA:Al3+ molar ratio, a variation in the chemical shifts was more
evident for carbons 2, 3, 4 and 5 as described in Table 6.
The upfield shift of the signal observed for C3 can be attributed to an increase in the electronic traffic. The downfield shift of the C2 signal is due to charge division and to lower electronic protection because of the double bond when complexed. C4 undergoes the lowest downfield shift, probably because the ketone chemical shift is already high. C5 undergoes the highest downfield shift. This large shift is because C5 is directly connected to the oxygen atom that is bonded to the metal ion, which, in turn, attracts electrons to itself, thus
Table 4. Kojic acid not complexes carbon chemical shifts at various pHs
pH δ (ppm) (
13C NMR) KA
C2 C3 C4 C5 C6 C7
4 168.2 110.3 176.4 144.4 141.8 59.6 7 167.8 110.4 177.5 146.1 142.0 60.0 9 165.3 110.0 181.2 152.0 142.2 60.2 11 164.9 109.8 182.0 153.6 142.2 60.2 14 166.0 109.2 181.6 153.0 141.9 60.2
∆δ -2.2 -0.5 +5.2 +8.6 +0.1 +0.6
Figure 3. Acid carbon chemical shift: Non-complexed (at pH 4, 7 and 11) and comparison to complexed and non-complexed Kojic acid (at pH 4.0)
Figure 4. Hypothetical resonance structures of KAH in the acid (A) and basic (B) forms
Table 5. KA complexes carbon chemical shift at pHs 2 and 4
pH δ (ppm) (13C NMR) 1:1 KA:Al3+
C2 C3 C4 C5 C6 C7
2 168.0 110.2 176.1 143.9 141.6 59.5 171.2 105.8 177.9 149.3 142.0 60.0 4 171.3 105.9 178.1 149.4 141.8 60.0
∆δ -0.1 -0.1 -0.2 -0.1 +0.2 0
Table 6. Comparison of carbon chemical shifts of kojic acid non complexed
and complexed with aluminum at pH 4
δ (ppm) (13C NMR) pH 4.0
C2 C3 C4 C5 C6 C7
KA 168.2 110.3 176.4 144.4 141.8 59.6 KA + Al 171.3 105.9 178.1 149.4 141.8 60.0
presenting less electronic charge to protect carbon C5. Figure 4 (B) shows a possible resonance model of KA before and after losing a proton in the complex formation.
Using nuclear magnetic resonance for experiments on KA hydrogens, the disappearance of the complexation peak corresponding to enolic hydroxyl can be observed and a shift of two hydrogens to a lower field can be attributed to the involvement of carbonyl C4 and C5 of the enolic group.12 According to Peana et al.,26 the trivalent
aluminium mainly forms dinuclear helicate complexes of M2L3 stoichiometry, and its coordination involves the two hydroxypyrone oxygen donor atoms. NMR results give evidence of a rigid and symmetric structure of L9–Al III complexes up to physiological pH.
Molecular modelling
Complexation structures proposed have the binding site composed mainly of oxygen atoms of C4 and C5. The most probable coordination configuration of the copper complex is either tetrahedral or planar, while the divalent nickel, cobalt, iron, and manganese complexes are tetrahedral.16 According to Singh et al.,27 the preferred
geometries for the kojate complexes are tetrahedral for Mn (II), Zn (II), Cd (II), Hg (II), trans square planar for Co (II), cis square planar for Ni (II) and Cu (II).
Theoretical calculations
The vibrational frequencies did not present any negative frequency for optimized structures, being representative of species presenting the minimal global energy. Gibbs free energy (∆GF) estimative and other thermodynamic parameters (not shown) for the formation of the mentioned species suggest that all complexes optimized were thermodynamically stable (see Table 1).
Electronic spectroscopy
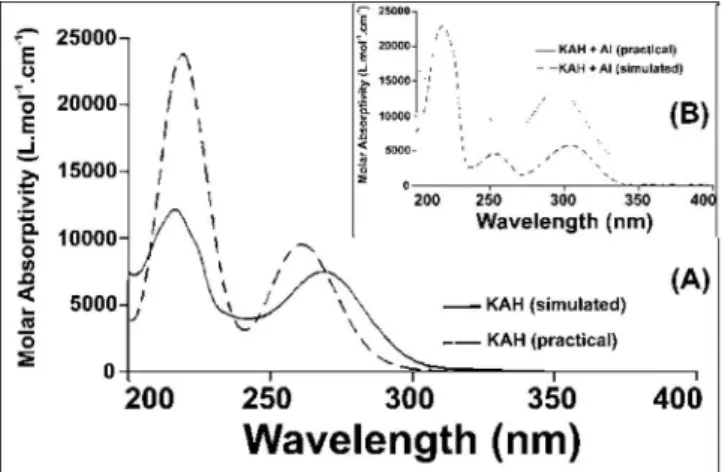
The UV spectrum of KAH in methanolic solution presents maximum absorption bands at 215 and 269 nm. The peak values predicted by TDDFT calculation showed good agreement, being respectively 219 and 261 nm (Figure 5(A)).
With the addition of an acidic AlCl3 solution, a new band appears
near 305 nm (Figure 5(B)). KAH/Al3+ coordination likely occurs at
the non-bonding electrons located at the KAH enolic hydroxyl group and/or at the carbonyl group. KAH or acidic solutions of AlCl3 alone
do not absorb at 300 nm, significantly. Thus, the appearance of a new absorption band can be explained by the formation of KAH-aluminum complexes. At pH lower than pKa, the most abundant species, according to the speciation diagram, are [(AK)3AlH2]+2 (around 37 %
at pH=5) and [(AK)2AlH]
+2 (around 57 %, at pH=5). In addition, the
presence of the [(AK)2Al]3+ complex is also expected in a proportion
lower than 6% at pH=5. In the simulated spectrum for pH=5 where a mixture of the above-mentioned species is predicted, a reasonable correlation to the experimental spectrum shown in Figure 5(A) is observed, for pH lower than pKa. The appearance a fairly intense band (ε = 12000 L mol-1 cm-1) at 300 nm in the simulated spectrum
and the shoulder at 225, which is probably related to the band at 215 of the experimental spectra.
In the experimental electronic spectra of kojic acid (Figure 5(A)), the bands with peaks at 215 nm and 269 nm, respectively, has been attributed to π→π* transition in the free ligands, according to the analysis of molecular orbitals involved in these transitions. For the simulated spectrum of non-protonated kojic acid (Figure 5(B)) these transitions appear respectively at 219 and 261 nm, with oscillator strengths compatible with π→π* transitions (respectively 0.3326
and 0.1369), and involve in the first case the linear combination of three superpositions of molecular orbitals: HOMO-2 → LUMO, HOMO-2 → LUMO+1 and HOMO → LUMO, being the first and the third with the major weigth (0.522 and 0.406)
The transition at 261 nm involves the linear combination of two superpositions of molecular orbitals: HOMO-2 → LUMO+1 and HOMO → LUMO, being the first and the second with the major weigth (0.678).
As can be seen by the analysis of the superpositions of molecular orbitals showed in Figure 6 (HOMO-2 → LUMO and HOMO → LUMO), both transitions involve a p orbital of the hydroxyl group and the π system of pyran ring. Additionally, the superposition HOMO → LUMO+1 that appears in the transition at 219 nm involves the charge transfer from p orbital of carbonyl group to pyran ring, and suggests the participation of the carbonyl group of the transition at 215 nm. The band characterized by this transition shifts to longer wavelength on complexation, showing the involvement of the C=O group in complexation.12 For example, the complex [(KA)
3AlH2] 2+,
whose geometry optimized structure is shown below.
Although the simulated electronic spectrum appears to be slightly different than the presented by kojic acid itself, with a significant Figure 5. (A) Absorption spectra of kojic acid (1.06x10⁻⁴ mol L-1) in
metha-nolic solution and simulated (TDDFT) absorption spectrum of a methametha-nolic solution of kojic acid; (B) Absorption spectra of kojic acid (1.06x10⁻⁴ mol L-1)
with acidic solution of 0.2% aluminum chloride (w/V) ([H+]= 0.1 mol L-1) in
methanolic solution and simulated (TDDFT) absorption spectrum
number of intense electronic transitions, what stands out are those occurring at 232 and 272 nm, confirming the expected red shift of the characteristic bands (Figure 7). Both bands in the spectrum correspond to π →π* transitions where transition probabilities are partially compromised (f=0.0546 for transition at 232 nm), because the transition occurs between ligands, partially prevented by symmetry.
The most representative orbital molecular superposition (HOMO → LUMO+4), regarding the transition that occurs at 232 nm, is characterized by a charge transfer π from KA system bonding (anion) to the KAH bonding system π* (KA neutral form).
CONCLUSION
Comparisons between IR spectra of KA complexed and not complexed, at different pH values, allowed us to correlate the changes in the absorption of enol and carbonyl groups while in the absence and in the presence of Al3+ in aqueous solutions.
After collection of the data for species distribution, obtained using potentiometric titration data, it was found that kojic acid complexes to the aluminum ion in different ways depending on their molar ratio. The complexation is also dependent on the pH range, which can result in complexes that are very different from each other.
Analyzing the chemical shifts from 13C NMR spectra, mainly
the shifts of carbon C5, it can be inferred that the complexation suggested by the potentiometric titration and IR spectroscopy are in accordance with the results of NMR data obtained. Some possible complexation structures were suggested for the studied systems described in this paper.
ACKNOWLEDGMENTS
The authors are grateful to CNPq, FAPEMIG, CAPES and UFPR.
REFERENCES
1. Buglyó, P.; Kiss, E.; Fábián, I.; Kiss, T.; Sanna, D.; Garribba, E.; Micera, G.; Inorg. Chim. Acta 2000, 306, 174.
2. Murakami, I.; Bull. Chem. Soc. Jpn. 1962, 35, 52.
3. Nurchi, V. M.; Crisponi, G.; Lachowicz, J. I.; Murgia, S.; Pivetta, T.; Remelli, M.; Rescigno, A.; Niclós-Gutíerrez, J.; González-Pérez, J. M.; Domínguez-Martín, A.; Castiñeiras, A.; Szewczuk, Z.; J. Inorg. Biochem. 2010, 104, 560.
Figure 7. Simulated electronic spectrum for [(AK)3H2Al]2+ complex in
metha-nolic solution and optimized structure of [(KA)3H2Al]2+ complex
4. Petrola, R.; Finn. Chem. Lett. 1986, 13, 129.
5. Sallam, S. A.; Haggag, S. S.; Masoud, M. S.; Thermochimica Acta 1990,
168, 1.
6. Zborowski, K.; Grybos, R.; Proniewicz, L. M.; J. Mol. Struct.: THEO-CHEM 2003, 639, 87.
7. Martell, A. E.; Motekaitis, R. J.; The Determination and Use of Stability Constants, Vol. 1, 2nd ed., Wiley-VCH: Weinheim, 1992.
8. Alderighi, L.; Gans, P.; Ienco, A.; Peters, D.; Sabatini, A.; Vacca, A.;
Coord. Chem. Rev. 1999, 184, 311.
9. Stenson, A. C.; Cioffi, E. A.; Rapid Commun. Mass. Spectrom. 2007, 21, 2594.
10. Huheey, J. E.; Keiter, E. A.; Keiter, R. L.; Inorganic chemistry: Prin-ciples of structure and reactivity, 4a ed., Harper Collins: New York, 1993.
11. Scott, A. P.; Radom, L.; The J. Phys. Chem. 1996, 100, 16502. 12. Jain, R.; Kaushik, N. K.; J. Therm. Anal. 1997, 49, 713.
13. Masoud, M. S.; El-Thana, S. A.; El-Enein, A.; Transition Met. Chem.
1989, 14, 155.
14. Murakami, Y.; Mera, K.; Bull. Chem. Soc. Jpn. 1965, 39, 396. 15. Kingsbury, C. A.; Cliffton, M.; Looker, J. H.; J. Org. Chem. 1976, 41,
2777.
16. J. W. Wiley, G. N. Tyson, J. S. Steller, J. Am. Chem. Soc. 1942, 64, 963. 17. Tomasi, J.; Mennucci, B.; Cancès, E.; J. Mol. Struct.: THEOCHEM
1999, 464, 211.
18. Frisch, M. J.; Trucks, G. W.; Schlegel, H. B.; Scuseria, G. E.; Robb, M. A.; Cheeseman, J. R.; Scalmani, G.; Barone, V.; Mennucci, B.; Peters-son, G. A.; Nakatsuji, M. C. H.; Li, X.; Hratchian, H. P.; Izmaylov, A. F.; Bloino, J.; Zheng, G.; Sonnenberg, J. L.; Hada, M.; Ehara, M.; Toyota, K.; Fukuda, R.; Hasegawa, J.; Ishida, M.; Nakajima, T.; Honda, Y.; Kitao, O.; Nakai, H.; Vreven, T.; Montgomery, J. A.; Peralta, J. E.; Ogliaro, F.; Bearpark, M.; Heyd, J. J.; Brothers, E.; Kudin, K. N.; Staroverov, V. N.; Keith, T.; Kobayashi, R.; Normand, J.; Raghavachari, K.; Rendell, A.; Burant, J. C.; Iyengar, S. S.; Tomasi, J.; Cossi, M.; Rega, N.; Millam, J. M.; Klene, M.; Knox, J. E.; Cross, J. B.; Bakken, V.; Adamo, C.; Jaramillo, J.; Gomperts, R.; Stratmann, R. E.; Yazyev, O.; Austin, A. J.; Cammi, R.; Pomelli, C.; Ochterski, J. W.; Martin, R. L.; Morokuma, K.; Zakrzewski, V. G.; Voth, G. A.; Salvador, P.; Dannenberg, J. J.; Dapprich, S.; Daniels, A. D.; Farkas, O.; Foresman, J. B.; Ortiz, J. V.; Cioslowski, J.; Fox, D. J.; Gaussian 09, Gaussian, Inc.,Wallingford CT, 2010.
19. Stephens, P. J.; Devlin, F. J.; Chabalowski, C. F.; Frisch, M. J.; J. Phys. Chem. 1994, 98, 11623.
20. Koch, W.; Holthausen, M. C.; A Chemist’s Guide to Density Functional Theory, 2nd ed., Wiley-VCH: Weinheim, 2001.
21. GaussView, Gaussian, Inc., Wallingford CT, 2008.
22. AMPAC™9, Semichem Inc., Shawnee, KS 66216., 1992-2008. 23. Baes, C. F.; Mesmer, E.; The Hydrolysis of Cations, Wiley: New York,
1976.
24. Toso, L.; Crisponi, G.; Nurchi, V. M.; Crespo-Alonso, M.; Lachowicz, J. I.; Mansoori, D.; Arca, M.; Santos, M. A.; Marques, S. M.; Gano, L.; Niclós-Gutíerrez, J.; González-Pérez, J. M.; Domínguez-Martín, A.; Choquesillo-Lazarte, D.; Szewczuk, Z.; J. Inorg. Biochem. 2014, 130, 112.
25. Bhatia, P. H.; Kohn, G. K.; Molloy, K. C. Transition Met. Chem. 2015,
40, 459.
26. Peana, M.; Medici, S.; Nurchi, V. M.; Lachowicz, J. I.; Crisponi, G.; Crespo-Alonso, M.; Santos, M. A.; Zoroddu, M. A.; J. Inorg. Biochem.
2015, 148, 69.
![Figure 7. Simulated electronic spectrum for [(AK) 3 H 2 Al] 2+ complex in metha- metha-nolic solution and optimized structure of [(KA) 3 H 2 Al] 2+ complex](https://thumb-eu.123doks.com/thumbv2/123dok_br/18986932.459217/7.892.53.412.292.540/figure-simulated-electronic-spectrum-complex-solution-optimized-structure.webp)
