A New Technique to Manage Big Bioinformatics
Data Using Genetic Algorithms
Huda Jalil Dikhil
Dept. of Comoputer Sciecne Applied Science Private UniversityAmman, Jordan
Mohammad Shkoukani
Dept. of Comoputer Sciecne Applied Science Private UniversityAmman, Jordan
Suhail Sami Owais
Dept. of Comoputer Sciecne Applied Science Private UniversityAmman, Jordan
Abstract—The continuous growth of data, mainly the medical data at laboratories becomes very complex to use and to manage by using traditional ways. So, the researchers started studying genetic information field in bioinformatics domain (the computer science field, genetic biology field, and DNA) which has increased in past thirty years. This growth of data is known as big bioinformatics data. Thus, efficient algorithms such as Genetic Algorithms are needed to deal with this big and vast amount of bioinformatics data in genetic laboratories. So the researchers proposed two models to manage the big bioinformatics data in addition to the traditional model. The first model by applying Genetic Algorithms before MapReduce, the second model by applying Genetic Algorithms after the MapReduce, and the original or the traditional model by applying only MapReduce without using Genetic Algorithms. The three models were implemented and evaluated using big bioinformatics data collected from the Duchenne Muscular Dystrophy (DMD) disorder. The researchers conclude that the second model is the best one among the three models in reducing the size of the data, in execution time, and in addition to the ability to manage and summarize big bioinformatics data. Finally by comparing the percentage errors of the second model with the first model and the traditional model, the researchers obtained the following results 1.136%, 10.227%, and 11.363%, respectively. So the second model is the most accurate model with less percentage error.
Keywords—Bioinformatics; Big Data; Genetic Algorithms; Hadoop MapReduce
I. INTRODUCTION
The important evaluation of the Bioinformatics and genetics field in the recent years has helped scientists and doctors to understand illnesses and diagnose it the better way and discover the reasons behind many diseases and genetic mutations, including muscular degeneration, which causes disability of many children around the world. To diagnose genetic diseases at medical laboratories, it requires a comparison procedure between the defective genes with the natural ones by alignment and matching sequence of Nucleated (nitrogenous bases) in the genes through National Center for Biotechnology Information (NCBI), which consider as the largest database and repository of genes.
Processing medical data due to the large size of bioinformatics data is hard to manage and it is not easy to reduce the size of needed data. For this and other reasons, it becomes important to develop such models and algorithms that
can manage big bioinformatics data that are produced by genetic laboratories, and have the ability to find the defective gene in less time with less error because medical application requires high accuracy.
So, for managing big bioinformatics data, the authors proposed two new models. The original model used only the Hadoop MapReduce. Since Genetic Algorithms GAs have many benefits especially in optimization problems, the authors tried to propose two new models by applying Genetic Algorithms before and after MapReduce. So, the first model was by applying Genetic Algorithms before MapReduce, and the second model was by implementing Genetic Algorithms after the MapReduce.
The paper consists of eight sections. The first section is an introduction. The second Section discusses the Big Data, its characteristics, and the architectures. The third section demonstrates the Bioinformatics. The fourth section explains the Genetic Algorithms and its features. The fifth section presents the problem statement of the research. The sixth part discussed the two proposed models. Section seven explains the data description. Part eight explored the results of the proposed models.
II. BIG DATA
Big Data is a term used to describe the enormous and massive amounts of data that could not be handled and processed using traditional methods. Big Data size has increased conspicuously in various fields over the past twenty years, where the volume of the generated and duplicated data has grown more than ten times in the over years, which cannot be predicted because data continuously increased to be double every two years. Data in Big Data are structured and unstructured. Thus, it needs more complicated tools rather than the traditional ones to be analyzed and managed. Managing this data brings more challenges and requires more efficient methods [1, 2].
Managing Big Data is one of the main challenges that faces large corporations, and has attracted the interest of researchers in the past years [1, 2]. Big Data has several characteristics known by nV’s characteristics, and it has several type of architectures for Big Data analysis.
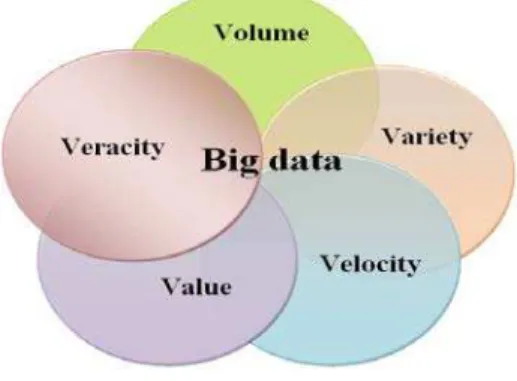
A. Big Data Characteristics
Value, and Veracity [14, 15]. The 5Vs characteristics of the Big Data were illustrated in Fig. 1.
Fig. 1. The 5Vs Characteristics of the Big Data
Some other researchers have different views and consider only 3Vs (Volume, Velocity, and Variety) as fundamental features. And others add Veracity as 4Vs [1, 2, 3, 4].
B. Architectures of Big Data Analytics
On the different type of sources and different structures. There are three main types of architectures for Big Data analysis, MapReduce architectures, fault-tolerant graph architectures and streaming graph architectures. Some of the characteristics of these styles as shown in Table 1 in terms of the used memory type: if the used memory is local memory or shared global memory, in addition to the fault tolerance [2].
III. BIOINFORMATICS
Bioinformatics is relatively an old field, it started before more than a century and introduced by the Austrian scientist Gregor Mendel, who known as the "father of genetics." Since then, the understanding of genetic information has increased, especially in past thirty years. The researches and studies in the domain of bioinformatics led to the creation of the largest international organization (HUGO), the first international organization that published the first complete map of the genome of sustainable in bacteria. Bioinformatics is the relationship between computer science and biology [5, 6, 7].
TABLE I. CHARACTERISTICS OF DIFFERENT TYPES OF ARCHITECTURES FOR BIG DATA ANALYTICS
Architectures
Characteristics
MapReduce architecture
Fault tolerant graph architecture
Streaming graph architecture
Memory Local memory
Global memory Global Memory
Data not need to be stored into disks Fault Tolerance
Allow Allow Allow Not
Operations
Synchronization Synchronization Synchronization Asynchronous
Fig. 2. Bioinformatics in general [6, 7, 8]
Fig. 2 shows that the bioinformatics in general which is an intersection between the biology and the computer science. It can be used in different fields such as crime scene investigation, comparing genes, and evaluation.
Bioinformatics characteristic debate the collaborative resources that work together for such task [8].
The theory “structure prediction” as a technique to recruit computer tools and algorithms is themost important objective of bioinformatics (Molecular Bioinformatics) in addition to being an alternative method and attractive [8]. Molecular bioinformatics logic and dealing with the concepts of biology regarding molecules and the application of the "information" to understand the technology and organization associated with these biomolecules in cells and organisms information. New genes discovered by searching for systematic data available to genome sequence, so through the sequence identity algorithms are appointed the supposed new genes function [8].
IV. GENETIC ALGORITHMS
Genetic algorithm GAs is one of the most powerful computer algorithms that based on natural living genes combining, producing and inheritance acts; it has vital importance in Computer Sciences branches like Artificial Intelligent and Computer Vision techniques. Genetic algorithms are useful tools for search and optimization problems. [9, 10].
The most important characteristic of genetic algorithms is solving hard problems with an optimal solution. Fig. 3 presents the simple Genetic Algorithm flowchart which it briefly describes the four basic operators to resolve a problem as follows: fitness function, selection operator, crossover operator, and mutation operator [9, 10, 11, 12, 13, 14].
V. PROBLEM STATEMENT
The development of Computer Science (CS) helped other scientific fields and became a key and essential part in most biological and medical experimentations. With the continuous growth of data, especially the medical data at laboratories (lab), it becomes very hard to use this data and manage it using the traditional ways, so efficient algorithms are needed to deal with this large and vast amount of bioinformatics data in genetic laboratories, which includes a gene and protein sequence. Thus, the researchers used one of the evolutionary algorithms which are genetic algorithms.
VI. PROPOSED MODELS
Data management is a very arduous task, especially when you have an enormous amount of data such as DNA. The proposed model based on genetic algorithm and Hadoop MapReduce. The researchers presented two models, the first one (GAHMap) by applying Genetic Algorithm before Hadoop MapReduce. The second one (HMapGA) by executing Genetic Algorithm after Hadoop MapReduce.
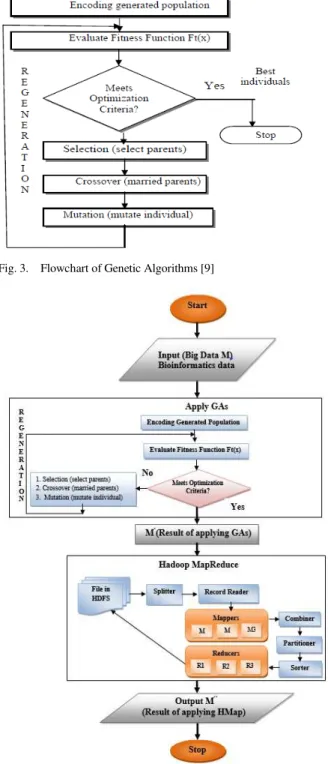
C. Model 1 (GAHMap): GAs beforeHadoop MapReduce
Fig. 4 demonstrates the stages of the first proposed model (GAHMap) as follows:
1) The input of prototype 1 is the big bioinformatics data which is denoted by (M).
2) Applying Genetic Algorithms on (M), which will produce an optimized data which is indicated by (M′).
3) Carrying out Hadoop MapReduce on (M′), the result will be the reduced data which is denoted by (M″).
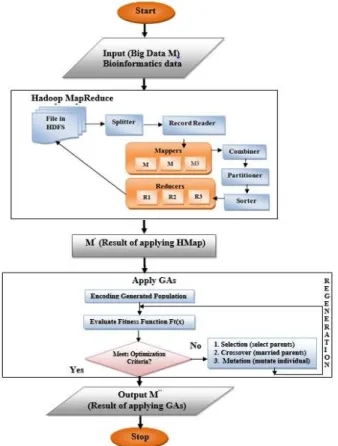
D. Model 2 (HMapGA): GAs afterHadoop MapReduce.
The second paradigm (HMapGA) presented in Fig. 5 and it has the following stages:
1) The input of prototype II is the big bioinformatics data which is denoted by (M).
2) Applying Hadoop MapReduce on (M), the result will be the reduced data which is denoted by (M′).
3) Executing Genetic Algorithms (M′), which will produce
an optimized data which is indicated by (M″).
Fig. 3. Flowchart of Genetic Algorithms [9]
Fig. 5. Proposed Model II HMapGA Stages
The two models were fully implemented using MATLAB and applied as graphical user interface (GUI) system as shown in Fig. 6. The system mainly consists of two parts: the first part is the Create Data Server that reads the big bioinformatics data as input dataset (M). The second part consists of three options to manage the Big Data: the first alternative to execute the first model GAHMap, the second option to perform the second model HMapGA, and the third option to proceed the original model which uses Hadoop MapReduce without genetic algorithms (HMap).
The results from the first and second models will be compared to identify the model that can give the best result which reduces the size of the data with better accuracy. After that, the outcome of the chosen model will be compared with the result from the original Hadoop MapReduce. Finally, the outcomes will determine the best model among them.
VII. DATA DESCRIPTION
The dataset of genes used in this research acquired from the Genetics Center at Specialty Hospital–Amman, Jordan. The dataset is related to Duchene Muscular Dystrophy (DMD), which is a popular and widespread genetic disease in the country as well as all over the world. It was an 88 sample from 88 individuals (genes). Each gene in the dataset represents 108 gigabytes of DNA tape; gene number 19 was obtained for this research and saved in text file format (txt file). Each gene and file contain 2,220,388 nucleotides; the nucleotides consist of a base (one of four chemicals and amino acids: cytosine, guanine, adenine, and thymine). The dataset with the 88 genes
location of the genes NCBI website by the genetic center to find the defective and normal genes. The results showed that 48 of the genes were defective and suffer from DMD disease, and the other 40 genes were normal. A sample of one of the genes from the DNA sequence was saved in a text file as shown in Fig. 7.
Fig. 6. Graphical User Interface of the Proposed Method
Fig. 7. Gene text file with nucleotides sequence
VIII. SYSTEM TEST RESULT
The system was tested using dataset within 88 genes (40 normal genes and 48 defective genes) as an input of Bioinformatics’ Big Data (M) to find which model will be better. So, after data server reads the dataset, it was tested by applying the three models on the same dataset. During execution, each model will display the result with the following information:
• TP: True Positive, which means the number of standard genes.
• FP: False Positive, which means the number of genes which is regular and detected as defective.
• FN: False Negative, which implies the number of genes which is defective and detected as deranged.
Fig. 8 shows the outcome of GAHMap implementation, which concludes that there are 40 TP and zero FP which implies that there are no normal genes revealed as defective genes, and there are 39 TN and 9 FN which means that there are 9 defective genes detected as standard genes which listed in FN sequence.
Fig. 9 displays the result of second model HMapGA execution, which concludes that there are 40 TP and zero FP which means that there are no natural genes revealed as defective genes, and there are 47 TN and 1 FN which signifies that there is only one deficient gene exposed as standard genes.
Fig. 10 presents the consequence of the original model HMap enforcement, which determines that there are 40 TP and zero FP which implies that there is no normal genes appeared as defective genes, and there are 38 TN and 10 FN which means that there are 10 deficient genes detected as normal genes.
Fig. 8. GAHMap Model 1 Result
Fig. 9. HMapGA Model Results
Fig. 10. HMap Model Results
Table 2 summarizes the results of the three models GAHMap, HMapGA, and HMap.
TABLE II. THREE MODELS SUMMARY RESULTS
Model TP TN FP FN
GAHMap 40 39 0 9
HMapGA 40 47 0 1
HMap 40 38 0 10
For more accuracy of the results, the percentage error (%Error) was calculated for each model by using the mathematic formula which is the difference between the experimental value and theoretical value divided by theoretical value as shown in equation (1) [15]:
% 100 lValue
Theoretica
% = − ×
lValue Theoretica
alValue Experiment
Error (1)
Where, the TheoreticalValue means the total number of genes used in the research (natural + defective), and the
ExperimentalValue means the total number of correctly detected genes (natural + defective) by the system.
As shown in Table 3 by applying the percentage error equation, it was found that the percentage error of the first model GAHMap =|(Total number of genes used in the research (normal + defective)) - (total number of correctly detected genes (normal + defective)|/ (total number of genes used in the thesis (normal + defective))*100
=| (40+48) – (40+39)| / (40+48) * 100% = |88-79| / 88 * 100
= 10.227 %
For the second model HMapGA % Error =| (40+48) – (40+47)| / (40+48) * 100
= |88-87| / 88 * 100 = 1.136%
For the original model HMap % Error =| (40+48) – (40+38)| / (40+48) * 100
= |88-77| / 88 * 100 = 11.363%.
TABLE III. THREE MODELS RESULTS OF PERCENTAGE ERROR
Model GAHMap HMapGA HMap
% Error 10.227% 1.136% 11.363%
According to the results in Table 3 the researchers conclude that the HMapGA is better than the GAHMap, and if the HMapGA compared with the original model HMap it found that the HMapGA is also better than the original one HMap. So the HMapGA proved to be the most accurate model with less percentage error and succeed in achieving the objectives of this research which includes organizing big bioinformatics data by matching and finding normal and defective genes with less time and less percentage error.
IX. CONCLUSION
genetic algorithms after Hadoop MapReduce. The proposed models in addition to the original model were tested using the real dataset of 88 genes related to DMD disorder.
By comparing the results of the three paradigms, the researchers found that the number of genes which is natural and revealed as defective (FP) was zero for all models, but the number of genes which is faulty and detected as normal (FN) were 9, 1, and 10 defective genes for the first, second, and original models respectively. The researchers conclude that the HMapGA detected less number of defective genes as natural ones.
Also, when comparing the percentage error for the three models, the second model has 1.136 % which is the most accurate model with the less percentage error.
Finally, the researchers conclude that the second model HMapGA is the best model since it succeeds in matching and finding normal and defective genes in less time and less percentage error. So HMapGA provides an efficient technique to manage and reduce the size of big bioinformatics data in the laboratory.
REFERENCE
[1] M. Chen, S. Mao, Y. Zhang, and V. C. Leung, Big data: related technologies, challenges and future prospects. Springer, 2014.
[2] H. Kashyap, H. A. Ahmed, N. Hoque, S. Roy, and D. K. Bhattacharyya, Big data analytics in bioinformatics: a machine learning perspective. Arxiv preprint arxiv:1506.05101, 2015.
[3] M. Moorthy, R. Baby, and S. Senthamaraiselvi, “An analysis for big data and its technologies”, International Journal of Computer Science
Engineering and Technology (IJCSET), Vol. 4, no 12, pp. 412-418, December 2014.
[4] J. Hurwitz, A. Nugent, F. Halper , M. Kaufman, Big Data For Dummies, 2013.
[5] S. M. Thampi, Introduction to Bioinformatics, LBS College of Engineering, 2009.
[6] Ralf Hofestädt, Bioinformatics: german conference on bioinformatics, GCB'96, Leipzig, Germany, Springer Science & Business Media, vol. 1278, September 30-October 2, 1996.
[7] D. C. Rubinsztein, Annual review of genomics and human genetics, 2001.
[8] P. Narayanan, Bioinformatics: A Primer. New Age International, 2006. [9] S. S. Owais, P. Krömer, and V. Snásel, Query optimization by Genetic
Algorithms. In Proceedings of the Dateso 2005 Annual International Workshop on databases, pp. 125-137, April 2005.
[10] R. Kaur, and S. Kinger, Enhanced genetic algorithm based task scheduling in cloud computing. International Journal of Computer Applications, vol. 101, no 14, pp. 1-6, 2014.
[11] S. N. Sivanandam, and S. N. Deepa, Introduction to genetic algorithms, Springer Science & Business Media, 2007.
[12] A. E. Eiben, and J. E. Smith, Introduction to evolutionary computing. Springer Science & Business Media, 2003.
[13] C. Y. Jiao, and D. G. Li, Microarray image converted database-genetic algorithm application in bioinformatics. In biomedical Engineering and Informatics, International Conference, vol. 1, pp. 302-305, May 2008. [14] M. Chen, S. Mao, Y. Zhang V. C. Leung. Big data related technologies,
challenges and future prospects. SpringerBriefs in Computer Science, New York Dordrecht London, 2014.