Artigo
*e-mail: [email protected]
OUTDOOR/INDOOR AIR QUALITY IN PRIMARY SCHOOLS IN LISBON: A PRELIMINARY STUDY
Priscilla Nascimento Pegas*, Margarita G. Evtyugina, Célia A. Alves, Teresa Nunes, Mário Cerqueira, Mariana Franchi e Casimiro Pio
Centro de Estudos do Ambiente e do Mar, Departamento de Ambiente e Ordenamento, Universidade de Aveiro, 3810-193 Aveiro, Portugal
Susana Marta Almeida e Maria do Carmo Freitas
Instituto Tecnológico e Nuclear, Estrada Nacional 10, 2686-953 Sacavém, Portugal
Recebido em 8/10/09; aceito em 27/1/10; publicado na web em 3/5/10
OUTDOOR/INDOOR AIR QUALITY IN PRIMARY SCHOOLS IN LISBON: A PRELIMINARY STUDY. Simultaneous measurements of outdoor and indoor pollution were performed at three schools in Lisbon. Volatile organic compounds (VOCs), formaldehyde and NO2 were passively monitored over a two-week period. Bacterial and fungal colony-forming units and comfort
parameters were also monitored at classrooms and playgrounds. The highest indoor levels of CO2 (2666 µg/m 3), NO
2 (40.3 µg/m 3),
VOCs (10.3 µg/m3), formaldehyde (1.03 µg/m3) and bioaerosols (1634 CFU/m3), and some indoor/outdoor ratios greater than unity,
suggest that indoor sources and building conditions might have negative effects on air indoors. Increasing ventilation rates and use of low-emission materials would contribute towards improving indoor air quality.
Keywords: indoor air quality; VOCs; formaldehyde.
INTRODUCTION
Outdoor air quality has become of growing concern during the past 50 years, because of increasing trafic and industrial emissions. However, evidence has been found that citizen spend most of their time in buildings and are far more exposed to pollution indoors than outdoors.1
In Lisbon, the number of children with asthma and rhinitis represents, respectively, about 15 and 40% of the school-age popu-lation2 and almost nothing is known about indoor air quality (IAQ) in schools. Mendell et al.3 observed that health problems from poor indoor environments may reduce the performance of occupants in buildings. According to Mendell and Heath,4 indoor environments in schools need to be studied with the aim of inding connections between IAQ and performance or attendance, due to two primary reasons: (i) schools are seen as particularly likely to have environ-mental deiciencies because chronic shortages of funding contribute to inadequate operation and maintenance of facilities. (ii) children have greater susceptibility to some environmental pollutants than adults, because they breathe higher volumes of air relative to their body weights and their tissues and organs are actively growing. In addition, a child’s immune system is not fully developed. Currently, children also spend more time in school than in any indoor environ-ment other than their home.
Persuasive evidence links higher indoor NO2 concentrations to reduced school attendance and low ventilation rates to reduced per-formance. Concerning indirect associations, some studies link indoor dampness and microbiologic pollutants to asthma exacerbations and respiratory infections, which in turn have been related to reduced performance and attendance.4,5
The irst aim of this preliminary study was to measure comfort parameters, CO2, bacterial and fungal contamination and gaseous inorganic and organic pollutants in indoor and outdoor air of three schools in winter. The second aim was to study associations between these factors and possible sources inside or outside the schools. As far as we know, this is the irst IAQ monitoring study in schools of Lisbon.
EXPERIMENTAL
Schools description
Indoor and outdoor air samples were collected at three schools (183, SJB and SJ) in Lisbon (Portugal), in December 2008. These schools were located in the city centre and were previously considered representative of all the elementary-level educational institutions.2,6 Two classrooms from each of the three schools were selected for this study. One of the classrooms of both 183 and SJB schools always had the electric heating connected and closed windows. This classroom of the 183 School presen-ted activities of arts with paints and glue in one day during the sampling; the other classrooms had windows and doors opened frequently. In the SJ School, both classrooms were always shut. All the classrooms depend only on the natural ventilation through the doors and windows existent. Details of each sampling site are listed in Table 1.
Sampling and analysis
Pollutants and parameters of interest were carbon dioxide (CO2), temperature, relative humidity (RH), total VOCs, bacte-rial and fungal colony-forming units per cubic metre, NO2, spe-ciated VOCs and formaldehyde. Continuous measurements of temperature, relative humidity (RH), CO2 and total VOCs were Table 1. Characteristics of each school
183 SJB SJ
Environment Urban Urban Urban
Heating Yes Yes No
Ventilation Windows/Doors
Type of board Blackboard and chalk
White board with pen
Blackboard and chalk
Floor Ceramic tile
Material of desks
and chairs Wood, plywood, plastic and metal
Plants Outdoor Outdoor Indoor/Outdoor
performed with an automatic portable Indoor Air IQ-610 Quality Probe (GrayWolf® monitor) in one classroom of each school. This IAQ monitor includes a Pt100 probe for measuring temperature, a capacitance probe to sense RH and a CO2 non-dispersive infrared sensor, all of them with an extremely fast response. The monitor also includes a photo-ionisation detector to track total VOCs over time. It displays measurements in real time allowing logged data to be downloaded to WolfSense® PC software for analysis. The equipment was supplied with a factory calibration certiicate, but it is checked prior to next use with appropriate calibration kits. Based on their results, it was expected to evaluate the contribution of ventilation, combustion processes, tobacco smoke and trafic for the IAQ. Bacterial and fungal colony-forming units per cubic metre of air were monitored by liquid impinger sampling in the two classrooms and playgrounds during one day in each school selected.7 Passive samplers for VOCs, formaldehyde and NO2 were used for the simultaneous measurements of indoor (in one classroom of each school) and outdoor levels. At each point, samples were collected in duplicate. NO2 concentrations were passively monitored for a two-week period. The diffusive tubes (with steel grids impreg-nated with triethanolamine) chemiadsorb NO2, as nitrite, which was quantiied by visible spectrophotometry.8 Passive samplers for VOCs and formaldehyde from Radiello®9,10 were used to obtain a screening of heavy and light molecular weight compounds over a two-week period. Indoor passive samples were collected at a height of about 1.5 m above the loor. They were positioned at a distance that should exceed 1 m from a window or a door. Outdoor passive samples were collected at heights of about 2 m above the ground. VOCs adsorved in activated charcoal cartridges were recovered by 2 mL of carbon disulide (CS2) with the internal standard, during 30 min. Analyses were performed by gas chromatography (Chrompack CP 9001) coupled to a lame ionisation detection (GC/ FID), using nitrogen carrier gas at constant pressure of 20 psi.9 A 100% dimethylpolysiloxane column (0.2 mm, 50 m, ilm thickness 0.5 µm) was used under the following temperature program: 50 oC for 5 min, 5 oC/min up to 80 oC, 15 oC/min up to 135 oC, 20 oC/ min up to 220 oC, inal isotherm for 20 min. Injector and detector temperatures were 240 and 300 oC, respectively. The equipment was calibrated before and during the analyses of samples by injecting standard solutions of all compounds identiied in CS2, speciically: pentane, n-hexane, ciclohexane, n-heptane, n-butyl acetate, styrene, α-pinene, sabinene, β-pinene, n-decane, (+)-3-carene, limonene (all from Fluka), methyl acetate, ethyl acetate, isooctane, m,p-xylene, o-xylene (all from Merck), benzene (AnalytiCals), toluene (Lab-Scan), and γ-terpinene (Aldrich). Four standard solutions, each one containing ive compounds in CS2, have been prepared. The analytes in these four standard solutions were present in concentrations of 40, 20, 10 and 5 ng/µL.
Formaldehyde collected in the 2,4-dinitrophenylhydrazine in sam-pling cartridges reacted to give the corresponding 2,4-dinitrophenyl-hydrazones. The analytes were extracted with 2 mL of acetronitrile and analysed by high-performance liquid chromatography (HPLC). The analytical system consisted of a Jasco PU- 980 pump, a Rheodyne manual injection valve (sample loop of 20 µL), a Supelcosil LC-18 column (250×4.6 mm; 5 µm; Supelco) and a Jasco MD-1510 diode array detector, all connected in series. Isocratic elution at room tem-perature was performed using an acetonitrile/water solution (60/40, v/v) as the mobile phase at a low rate of 1.5 mL/min. The carbonyl concentrations were quantiied with external calibrations curves cons-tructed from standard solutions of formaldehyde-DNPH derivative in acetonitrile.10, 11 After compilation of data, the different environments were compared with the aim of inding a relation between indoor and outdoor pollutants and the possible compound sources.
Evaluation of the chromatographic analysis
Parameters, such as selectivity, linearity, reproducibility and limit of detection, were evaluated by 12 injections of three standard solutions of 10 compounds with 3 concentrations each one, between 5 and 40 ng/µL. The selectivity of an instrumental separation method refers to the ability to discriminate between the analyte and interfering compo-nents.12 As condition for the method selectivity, the absence of peaks in the region of the retention time for the investigated compounds was observed. Linearity is the ability to elicit test results that are directly proportional to the concentration of analytes in samples within a given range.12 The repeatability measures are the success rate in successive ex-periments conducted by the same experimenters. It was evaluated from the calculation of the standard deviation of the chromatographic peak areas corresponding to 10-12 injections, each day, in 5 successive days. The limit of quantiication (LOQ) represents the lesser concentration of the substance in examination that can be quantitatively analysed with reasonable reliability. Limit of detection (LOD) represents the lesser concentration of the substance in examination that can be detected, but it is not necessarily quantiied by a method. The LOQ and LOD have been calculated as described in Ribani et al..12
RESULTS AND DISCUSSION
Results of the evaluation of the chromatographic analysis
The chromatographic analyses of samples exhibited good selec-tivity and separation capability of analytes. After multiple injections of different concentration standard solutions, it was observed that the plots of peak areas, as a function of analyte mass, produced regression lines that had an intercept not signiicantly different from 0 and Pearson correlation coeficients ranging from 0.958 to 0.999 (Table 2). Consecutive injections of the same sample under variable conditions showed repeatability among measurements. The maximum standard deviation did not exceed 0.04 (Table 2). Depending on the analyte, LOQ and LOD were in the ranges 1.04-7.64 and 0.34-2.52 ng/µL, respectively (Table 2).
Air quality monitoring data
The average room temperature for the three schools was 20 ± 1.4 oC, and the relative humidity presented values between 52 and 61%. Table 2. Average relative response factor, standard deviation (STDEV), linearity, limit of detection and limit of quantiication for each compound Compounds Average
RRF* STDEV
Pearson correlation coeficients
LOD** (ng/µL)
LOQ*** (ng/µL) Ethyl acetate 0.27 0.01 0.999 2.52 7.64 Ciclohexane 0.82 0.02 0.999 1.35 4.10 Isooctane 0.89 0.02 0.996 1.06 3.22
n-Heptane 0.97 0.02 0.958 1.03 3.11
Toluene 1.15 0.02 0.999 0.74 2.25
Internal
stan-dard 1.00 0.00 0.999 1.06 3.21
o-Xylene 1.28 0.04 0.999 0.43 1.31
β-Pinene 1.23 0.04 0.999 0.38 1.15
n-Decane 1.20 0.04 0.999 0.34 1.04 Limonene 1.15 0.04 0.999 0.38 1.14 *RRF (relative response factor) = (area of compound/mass of compound) ×
These high indoor relative humidity values are not surprising since, according to the Environment Portuguese Agency, the Lisbon region usually records values between 75 and 85%. It should be stated that higher relative humidity values contribute to the survival and the dispersion of airborne allergens such as mould spores and bacteria, worsening the symptoms of allergy suffers.
Carbon dioxide concentrations are often used as a surrogate of the rate of outside supply air per occupant. Indoor CO2 concentrations above approximately 1000 µg/L are generally regarded as indicative of ventilation rates that are unacceptable with respect to body odours.13 The National System for Energy and Indoor Air Quality Certiication of Buildings (Regulamento dos Sistemas Energéticos de Climatização de Edifícios - RSECE)14 establishes an acceptable maximum value (AMV) of CO2 of 1800 µg/L for buildings in Portugal. The indoor concentrations of CO2 showed inadequate classroom air exchange rates. Figure 1 depicts the variation of indoor CO2 concentrations in a typical working day at the three schools. A strong correlation of the CO2 level with occupancy has been observed. CO2 spikes were even more pronounced when students started physical activities inside the classrooms, as for example, art classes or entrance and exits to the playgrounds. Room 12 of the 183 School presented the greatest CO2 concentration (2666 µg/m3). This room was the only one that had the electric wall heating constantly connected and windows and doors always closed. Lower outdoor air ventilation rates at homes have been associated with increased prevalence of asthma and allergic symptoms in children.15
No standards have been agreed upon for nitrogen oxides in indoor air in Portugal. ASHRAE13 and the U.S. EPA National Ambient Air Quality Standards list 0.053 ppm as the average 24-h limit for NO2 in outdoor air. NO2 concentrations were higher outdoors than indoors (Table 3), probably as a result of vehicular exhaust emissions from nearby trafic. The I/O NO2 ratio ranged between 0.63 and 0.84. SJ School, which is located near an avenue with intense trafic, presented the smallest level of indoor NO2, possibly because the windows and the doors were always closed.
In the SJ and SJB Schools, the total fungal colony-forming units in both indoor and outdoor air (Figure 2) were below the acceptable maximum value (AMV) of 500 CFU/m3 deined by the Portuguese
Legislation, Decree-Law 79/2006. In the 183 School, fungal colony-forming units higher than this standard were observed in both indoor and outdoor air. Fungal species exceeding 500 CFU/m3 may be indicative of building-related sources, poor ventilation rates or over-crowding, highlighting the need for remedial action.16
Excepting for the outdoor measurements of SJ School, the total bacteria colony-forming units presented values above 500 CFU/m3 for all the environments. The main factors affecting atmospheric dispersion and survival of microorganisms are the relative humidity, temperature, oxygen, wind and air turbulence, air pollutants and water and nutrient availability. The high amounts of bacteria in both indoor and outdoor may derive from several factors, including high seasonal level of bioaerosols in outdoor air, from the human self-activities, such as breathing, sweating and movement causing particle resuspension. Cold weather favours children’s respiratory infections, which are usu-ally caused by bacteria or virus. Thus, respiratory morbidity among children may also contribute to the airborne spread of bioaerosols.
Two institutions presented indoor/outdoor (I/O) fungal ratios in the range 0.45-0.86, while values higher than 1 have been registered for the SJ School. Depending on classroom, variable I/O bacterial ratios, ranging from 0.62 and 1.95, have been found. Scheff et al.17 reported that, in a middle school of Springield, the indoor fungal and bacterial counts were signiicantly higher than the outdoor concentrations. Conversely, Godwin and Batterman18 found that the outdoor bioaerosol levels exceeded indoor levels in 64 school classrooms in Michigan.
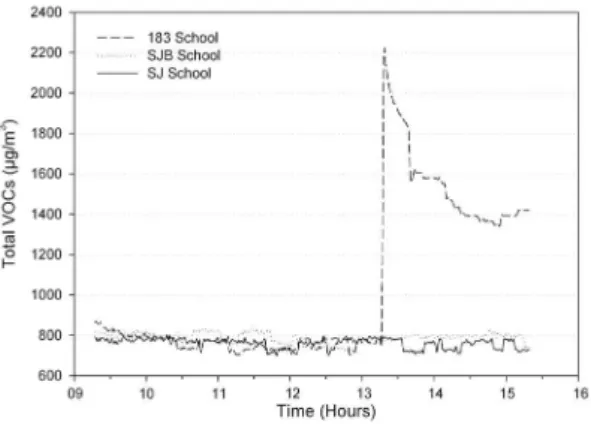
Total VOC concentrations could give information about the inluence of aerosol sprays, solvents, cleaning agents, pesticides, paints and repellents. Figure 3 shows a daily proile for the total VOC concentrations. SJ and SJB Schools exhibit very constant levels and similar daily patterns. In the 183 School, there was a huge increase in the VOC concentrations around 13 pm, when pupil’s art class was occurring with the use of glue and paints. This makes evident that collage and painting materials increase the VOC levels in indoor air. Zhang et al.19 also identiied a visual art classroom with a relatively high level of VOCs. Standards have been agreed upon for total VOCs by Decree 79/2006 of the Portuguese Legislation that establishes the thermal regulations for buildings.14 The results obtained in schools were above the proposed target guideline value of 600 µg/m3.
Table 4 present the results for the VOC concentrations and speciation. In general, concentrations of VOCs were higher indoors than outdoors for all schools. Those compounds that have only been detected in indoor air have a probable indoor source. Ethyl acetate, methyl acetate, styrene, ethanol and limonene were only found in the indoor air. Pollutants identiied in both indoor and outdoor samples, Figure 1. Indoor carbon dioxide levels in the three schools
Figure 2. Average of total bacteria and fungal colony-forming units per cubic metre of air and standard deviation
Table 3. Indoor and outdoor NO2 concentrations (µg/m3) in the three schools
Indoor Outdoor Indoor/Outdoor
SJB School 40.3 48.0 0.84
SJ School 36.4 56.9 0.64
but with higher concentrations in the indoor environments, may indicate additional indoor sources or inadequate ventilation ratios. I/O ratios higher than 1 were observed for n-hexane, n-heptane, n -butyl-acetate and o-xylene at all the schools. I/O ratios exceeding the unity were also determined for pentane, toluene α-pinene, n-decane and terpinene, but not in all institutions. The measured benzene concentrations were below the annual ambient EU limit value of 5 µg/m3. Toluene concentrations were higher than those reported by Stranger et al.20 in primary schools of Antwerp, Belgium. The high benzene and toluene concentrations observed in Lisbon are in the same range of those measured in schools of Oporto, Portugal.21 In this preliminary study, the toluene levels were very similar to those found in schools of Curitiba, Brazil.22
SJ School, which has the oldest building among all institutions, registered both the highest concentrations and diversity of VOC compounds. Perhaps the inadequate ventilation observed favours accumulation of pollutants with additional indoor sources. The hi-ghest levels of limonene, β-pinene, sabinene, n-butyl acetate, methyl Figure 3. Diurnal variation of total VOCs (non-methane hydrocarbons) in the three schools
Table 4. VOC concentrations (µg/m3) in the three schools
COMPOUNDS SJB School 183 School SJ School Indoor Outdoor Indoor Outdoor Indoor Outdoor Pentane 3.61 0.71 0.97 1.08 1.40 1.13
Methyl acetate 52 ni 34 ni 83 ni
Ethyl acetate 2.08 ni 1.30 ni 3.55 ni
n-Hexane 2.98 0.53 1.15 0.62 1.06 0.84 Benzene 2.88 <ld 3.01 3.13 2.54 2.46 Ciclohexane 0.87 0.22 0.17 0.13 1.60 0.16 Isooctane 1.19 0.15 0.16 0.19 0.44 0.21
n-Heptane 3.22 0.37 3.35 0.50 0.95 0.52 Toluene 10.3 2.00 2.51 2.58 4.59 2.93
n-Butyl acetate 4.18 0.62 1.41 0.87 6.74 1.42
m,p-Xylene 8.8 1.22 1.42 1.26 2.82 1.78
Styrene ni ni ni ni 0.28 ni
o-Xylene 3.09 0.39 1.05 0.46 5.45 0.57
α-Pinene 0.50 ni 0.15 ni 4.27 0.16 Sabinene 0.77 ni ni 0.14 12.2 0.17
β-Pinene ni ni ni ni 29 ni
n-Decane 1.00 0.40 0.46 0.30 1.71 0.65
(+)-3-Carene ni ni ni ni 0.24 ni
γ-Terpinene 0.65 ni ni 0.18 0.78 0.23
Limonene 3.17 ni 0.39 ni 86 ni
ld – below limit of detection; ni – not identiied.
acetate and formaldehyde (1.03 µg/m3) were achieved in this school. n-hexane, n-heptane and n-decane could have indoor sources in some architectural inishes, loor adhesives, PVC looring, consumer pro-ducts (e.g. loor waxes and aerosol air fresheners). Limonene could be derived from cleaning products, air fresheners and many other consumer products. Benzene, toluene, xylenes and styrene could be originated from engine vehicle exhaust, gasoline/fuel, tobacco smoke, solvent-based paints, loor adhesives, PVC looring, carpe-ting, printed material and solvent-based consumer products.23 The 183 School registered the lowest concentrations of VOCs, probably because this institution had better ventilation than the other schools, higher classroom volumes and lesser number of pupils.
CONCLUSIONS
Indoor and outdoor concentrations of NO2, VOCs, formaldehyde and microbiological components were measured for the irst time in 3 elementary schools in Lisbon during December 2008. The results suggest that schools with closed windows could have smaller I/O ratios of NO2 (0.64), but higher indoor levels of VOCs (10.3 µg/m3) and formaldehyde (1.03 µg/m3) with an origin in building materials and consumer products. Total VOC concentrations increase during art classes, reaching about 2200 µg/m3. Low ventilation ratios and the children’s physical activities have also an impact upon the CO2 levels. Fungal and bacterial counts exceeding 500 CFU/m3 for one school (765 CFU/m3) and for all of them (934-1634 CFU/m3), respectively, may be indicative of building-related sources, poor air exchange rates or overcrowding, highlighting the need for remedial action. Most of the assessed gaseous pollutants can be credited to the trafic emissions and indoor sources (some architectural inishes, loor adhesives, PVC looring, consumer products and cleaning products). More studies are needed (currently underway), to ind additional possible sources of indoor contamination, to calculate air exchange rates on a seasonal basis, to evaluate if there is a causal relationship between pollutant exposure and health symptoms in schools, and to assess if school IAQ can adversely affect academic performance or attendance.
ACKNOWLEDGMENTS
This project was inancially supported by Fundação para a Ciên-cia e a Tecnologia (FCT) through the PTDC/SAU-ESA/65597/2006 project. P. N. Pegas thanks FCT for the Ph.D. Scholarship (SFRH/ BD/45233/2008). The authors would also like to thank the support of principals, staff and students at the three schools. In addition, an acknowledgement is addressed to Profs. A. Cunha and A. Almeida (University of Aveiro) for their support in bioaerosol determinations. REFERENCES
1. Blondeau, P.; Iordache, V.; Poupard, O.; Genin, D.; Allard, F.; Indoor Air 2005, 15, 2.
2. Khan, I.; Freitas, M. C.; Dionísio, I.; Pacheco, A.; Proceedings of the
Ninth REHVA World Congress Clima 2007 “WellBeing Indoors”, Hel-
Hel-sinki, Finland, 2007a.
3. Mendell, M.; Fisk, W.; Kreiss, K.; Levin, H.; Alexander, D.; Cain, W.; Girman, J.; Hines C.; Jensen, P.; Milton, D.; Rexroat, L.; Wallingford, K.; Am. J. Public Health 2002,92, 1430.
4. Mendell, M.; Heath, G.; Indoor Air 2005, 15, 27.
5. Kim, J.; Elfman, L.; Wieslander, G.; Smedje, G.; Norbäck, D.; Indoor Air 2007, 17, 153.
6. Khan, I.; Freitas, M. C.; Pacheco, A.; Proceedings of the Ninth REHVA
World Congress Clima 2007 “WellBeing Indoors”, Helsinki, Finland,
7. May, K.; Harper, G.; J. Ind. Med.1957, 14, 287. 8. Bhugwant, C.; Hoareau, J.; Atmos. Res. 2003, 66, 241.
9. http://www.radiello.com/english/cov_chim_en.htm, accessed in Septem-ber 2009.
10. http://www.radiello.com/english/ald_en.htm, accessed in September 2009.
11. U. S. EPA; Compendium Method TO-11A. EPA-625/R-96/010b. Cincin-EPA-625/R-96/010b. Cincin-nati, 1997.
12. Ribani, M.; Bottoli, C.; Collins, C.; Jardim, I.; Melo, L.; Quim. Nova
2004, 27, 771.
13. ASHRAE - American Society of Heating Refrigerating and Air-Conditioning Engineers; Standard 62-1999: ventilation for acceptable
indoor air quality, American Society of Heating, Refrigerating and
Air-Conditioning Engineers: Atlanta, 1999.
14. Decreto-Lei n.º 79/2006 – Regulamento dos Sistemas Energéticos de Climatização em Edifícios (RSECE), de 04/04/2006, Ministério das Obras Públicas, Transportes e Comunicações.
15. Bornehag, C.; Sundell, J.; Hagerhed-Engman, L.; Sigsgaard, T.; Indoor Air2005, 15, 275.
16. Godish, T.; Sick Building: Deinition, Diagnosis, and Mitigation; CRC Press: USA, 1995, p. 273.
17. Scheff, P.; Paulius, V.; Curtis, L.; Conroy, L.; Applied Occupational and
Environmental Hygiene2000, 43,298.
18. Godwin, C.; Batterman, S.; Indoor Air 2006, 17, 109.
19. Zhang, G.; Spickett, J.; Rumchev, K.; Lee, A.; Stick, S.; Indoor Air
2006, 16, 74.
20. Stranger, M.; Potgieter-Vermaak, S.; van Grieken, R.; Indoor Air 2008,
18, 454.
21. Madureira, J.; Alvim-Ferraz, M.; Rodrigues, S.; Gonçalves, C.; Azevedo, M.; Pinto, E.; Hum. Ecol. Risk Assess. 2009, 15, 159.
22. Godoi, R.; Avigo Jr, D.; Campos, V.; Tavares, T.; de Marchi, M.; Grie-22. Godoi, R.; Avigo Jr, D.; Campos, V.; Tavares, T.; de Marchi, M.; Grie-ken, R.; Godoi, A.; Water, Air, Soil Pollut. 2009, 9, 171.