Artigo
*e-mail: [email protected]
EVALUATION OF A BUFFERED SOLID PHASE DISPERSION PROCEDURE ADAPTED FOR PESTICIDE ANALYSES IN THE SOIL MATRIX
Ana María Domíngueza,*, Mario Funesb, Ximena Fadicb, Fabian Placenciab, Francisco Cerecedab and Juan Pablo Muñozb
aDepartamento de Química, Universidad Técnica Federico Santa María, Av. España 1680, Valparaíso, Chile
bCentro de Tecnologías Ambientales, Departamento de Química, Universidad Técnica Federico Santa María, General Bari 699, Valparaíso, Chile
Recebido em 09/12/2014; aceito em 22/05/2015; publicado na web em 06/07/2015
An evaluation of the pesticides extracted from the soil matrix was conducted using a citrate-buffered solid phase dispersion sample preparation method (QuEChERS). The identification and quantitation of pesticide compounds was performed using gas chromatography– mass spectrometry. Because of the occurrence of the matrix effect in 87% of the analyzed pesticides, the quantification was performed using matrix-matched calibration. The method’s quantification limits were between 0.01 and 0.5 mg kg−1. Repeatability and intermediate
precision, expressed as a relative standard deviation percentage, were less than 20%. The recoveries in general ranged between 62% and 99%, with a relative standard deviation < 20%. All the responses were linear, with a correlation coefficient (r) ≥0.99.
Keywords: soil; pesticide; solid phase dispersion extraction.
INTRODUCTION
The world’s population has grown twice over the last 50 years,1 requiring an increase in global food production. To solve these problem two practices were implemented: greenhouse cultivation to satisfy the year round demand for some vegetables; and the extensive use of pesticides to fight against pests and reach production goals.
Over the course of many years, the intensive use of pesticides led to them becoming environmental contaminants.2 Insecticides are toxic to harmful insects but also to beneficial insects like pollinators; 3,4 birds, fish, amphibian, and other organisms including humans.5-7 Pesticides can cause ecological unbalance, contaminating soils and waters (groundwater, rivers and lakes),8,9 by drainage, from agricul-tural soils and run-off; resulting in the accumulation of contaminants in different parts of the hydrosphere.10
Soil is an important resource and in agriculture is the direct receptor of pesticides which are applied directly to it or by foliar application. Soil works as the main reservoir for pesticides and other environmental contaminants.11 The adsorption of pesticides in the soil is affected by the soil and the pesticide’s physico-chemical properties. These compounds can be retained in the soil clay and organic matter, and could affect the uptake of nutrients by plants and the soil fertility. There are reports about the detrimental effects on the earthworm population from pesticides like dimethoate (even at doses lower than those recommended for application)12 and other organophosphates.13 In addition, some authors report the negative effect on nitrogen-fixing and phosphorus solubilizing microorganisms by pesticides in conta-minated soil.14 Chowdhury et al, report a reduction of soil microbial biomass due to the application of pesticides like captan, carbosulfan, 2,4-D, thiram, among other.15 Lo reports the harmful effects of buta-chlor on the Azospirillum population and aerobic nitrogen fixers in non-flooded soil or fenamiphos on nitrification bacterias.16
On the other hand, the degradation of highly lipophilic and persistent organochloride pesticides, takes many years generating breakdown products, sometimes more toxic than their precursors17,18 and producing bioaccumulation in some soil microorganisms19 and thus, in the trophic chain.20
Many techniques have been used for the extraction of pesticides from soils, such as: Soxhlet extraction,21 microwave assisted ex-traction (MAE),22,23 solvent assisted extraction (ASE),24 ultrasound assisted extraction,25 supercritical fluid extraction,22,26 solid phase extraction (SPE),27 among others.
The “Quick, Easy, Cheap, Effective, Robust and Safe” (QuEChERS) procedure was implemented some years ago, for the extraction of pesticides in fruits and vegetables. QuEChERS extraction requires simple and low cost equipments; it’s a fast me-thod with good results.28 But, with time this solid phase dispersion methodology has been widely applied to other matrices like soil and biological samples;20,29-31 and also to environmental contaminants such as polycyclic aromatic hydrocarbons (PAHs), polychlorinated biphenyls (PCBs), benzene, toluene, ethylbenzene, and xylenes (BTEX), among others.31,32 This procedure has been applied either alone or in combination with other extractive techniques like super-critical fluid extraction.26
MATERIALS AND METHODS
Reagents
Acetone and acetonitrile (pesticide grade), were purchased by Fisher Chemical, USA. Pesticide neat standards (> 98% of purity): dimethoate, trifluralin, simazine, 4,4’-DDT, 4,4’-DDE, iprodione, azinphos-methyl, permethrin, and the internal standard triphenylphos-phate (TPP) were obtained from Accustandard, USA. Sodium citrate dibasic sesquihydrate (>99% of purity for analysis), were acquired from Sigma-Aldrich-Fluka, Spain and; the Emsure sodium chloride (> 99% of purity), tri-sodium citrate dehydrate (> 98% of purity), and anhydrous sodium sulphate (>99% of purity) from Merck, Germany. Selectra PSA (primary and secondary amine) was purchased by UCT, USA. Individual and multi-residue pesticides stock solutions
Individual pesticides stock solutions between 1000 to 3000 mg kg−1 were prepared in acetone, using the proper amount of each neat pesticide solid standard. The multi-residue working solution (20 mg kg−1) was prepared in acetone, from the individuals stock solutions. The stocks and working solutions were stored in an amber bottle at 4 °C. Working solutions were prepared every week.
Sample collection and treatment
Two soils were collected at the same location (Fundo San Jorge, Valparaiso, Chile): one uncultivated soil and one soil using for orga-nic farming (chemical free agriculture soil). A composite sample of two kilograms for each soil was collected, from 0 to 15 cm of depth. Sampling was performed using the zig-zag method.34 Samples were dried at room temperature, sieved with a 2 mm mesh and stored at
−20 ºC in a glass container, until analysis. Soil characterization
pH, conductivity and humidity percentage were determined for each soil sample. pH and conductivity were measured in a Sper Scientific equipment, Bench-Top Meter, USA.
pH
50 mL of calcium chloride solution 0.01 mol L−1 was added to 20 g of soil. The mixture was shaken for 2 hours and allowed to stand for 1 hour. pH was registered in the supernatant solution.
Conductivity
150 mL of deionized water was mixed with 30 g of soil. The samples were shaken for 2 hours and allowed to stand by 1 hour. The conductivity measurements were taken in the supernatant solution. Humidity percentage
5 g soil, in triplicate, was heated at 105 °C for 48 hours; then the sample let cold down at ambient temperature and weighted. The procedure was repeated until constant weight.
Spike soil procedure
The spiked soil samples were prepared adding to 5 g of soil, the appropriated volume of multi-residues working solution to reach concentrations of 0.2 and 0.8 mg kg−1. Then 5 mL of acetone was
added to the sample and shaked for 2 hours at 200 rpm in order to achieve a better analyte homogenization into de soil matrix. Later, the sample was dried and aged for 48 hours at room temperature before the extraction procedure.
Solid phase dispersion procedure
The extraction procedure was based on a buffered QuEChERS methodology (EN 15662) for food and plant origin,35 with some modifications. The procedure had been employed by Rouvière with dichloromethane partition;36 but, in this study, acetonitrile was used as partition solvent for pesticide extraction from soils samples and the purification step was slightly modified.
A sample of 5 g of soil spiked with 100 µL of TPP was mixed with 10 mL of acetonitrile and vortex mix for 1 minute, in a 50 mL centri-fuged tube. After that, 0.5 g of sodium chloride, 0.5 g of tri-sodium citrate dehydrate, 250 mg of sodium citrate dibasic sesquihydrate and 3 g of anhydrous sodium sulphate (replacing the magnesium sulphate) were added and mix again for 1 minute. The organic extract containing the pesticides was isolated from the soil after centrifuging the mixture for 15 minutes at 5000 rpm at 15 ºC. Finally, 2 mL of the organic extract was filtered through a glass Pasteur pipette packed with silanized glass wool and anhydrous sodium sulphate, and 1 µL of the filtrated organic extract was introduced directly in the injector port for the chromatographic analysis.
Extract clean-up using PSA
The cleanup step was carried out in a 15 mL falcon centrifuged tube adding 25 mg PSA and 150 mg anhydrous sodium sulphate, per organic extract milliliter. Then, the extract was agitated for 30 s and centrifuged for 5 min at 5000 rpm28 before the analysis.
Matrix match calibration solutions
Six calibration points, ranging from 0 to 1 mg kg−1, were prepared by spiking the soil blank extract with the appropriated amount of the multi-residue working solution, and 100 µL of the internal standard (TPP). The soil blank extract was obtained by extracting uncultivated soil with the proposed QuEChERS procedure.
Matrix effect evaluation
In order to study the matrix effect a calibration curve prepared with the pesticides working solution, from 0 to 1 mg kg−1, on a soil blank extract was injected in the chromatographic system. Moreover a calibration curve prepared with a pesticides working solution on pure acetonitrile was also injected. The matrix effect (%) was determined by statistical comparisons between the slopes of these curves. Chromatographic analysis
source temperature were set at 200 ºC and 170 ºC, respectively; and the Register Ion Monitoring (SIR = SIM) mode method was used for the analysis, selecting three fragments of each pesticide (see Table II), two for verification purpose and one for quantification (underlined). RESULTS AND DISCUSSION
Soil characterization
Humidity, pH and conductivity of uncultivated soil and organic farming soil were measured. As can be seen in Table I, both soils had similar percentage of humidity. The organic farming soil that was used for organic tomato cultivation showed slightly acidic pH, as expec-ted. This pH value was higher than the one founded on uncultivated soil. The electric conductivity (EC) indicates that both soils had low indirect salinity values, meaning a low amount of soluble salts.37 Although, as expected, the organic farming soil presented slightly higher soluble salt content than the uncultivated soil.
Pesticides
The pesticides structure and acid dissociation constant (pka) va-lues are shown in Table II. The pka vava-lues indicate that we have acidic pesticides like simazine but also strong basics such as permethrin. In order to make a simultaneous determination of these pesticides it was necessary to make a compromise, also taking into account some reports about the rate of hydrolysis of some pesticides with pH. So we determined to work under buffered conditions with pH values of about 5 to 5.5 to protect the base and acid sensitive species, also allowing the extraction of the acids.
Selectivity
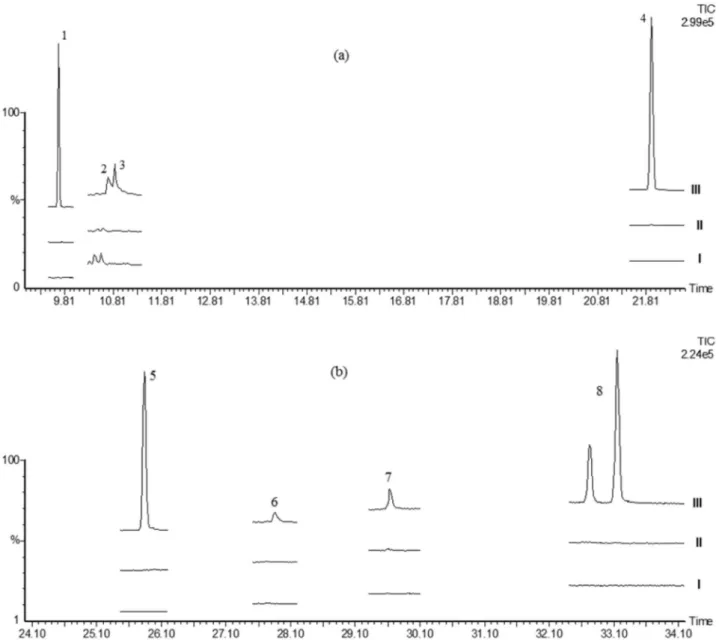
The presence of interferent compounds in the soil matrix, from the studied pesticides retention time segments, was determined through GC/MS-SIR analysis for both soil (uncultivated and organic), after its extraction by QuEChERS. Both soils chromatograms: uncultivated (bottom chromatogram) and organic (medium chromatogram) were compared in Figure 1, with the 0.8 mg kg−1 pesticide spiked uncul-tivated soil extract (upper chromatogram).
The uncultivated soil chromatogram shows two signals in the GC/ MS-SIR segment of dimethoate and simazine, close to the retention time of these pesticides. But as can be seen in the figure the signals are well resolved and those matrix compounds will not interfere with our analytes determination in the SIR mode, although they are close to them.
The purity analysis of the signals reveals values less than 48%; probably corresponding to more than one compound with low re-solution. The responsible for those signals could not be identified, neither using full scan, nor was there a match in the Nist library v. 2.0. Their mass spectrum shows an intense mass fragment of m/z 91 and less intense m/z 77, associated commonly with tropylium and benzene, which can be formed by alkyl, substituted aromatic compounds fragmentation.
The organic farming soil also shows little signals at the dimethoate and simazine retention time segment. For the purpose of validation, this soil was used in the fortification studies and the uncultivated soil was employed as a blank soil matrix.
Soil extraction with and without the clean-up step
The uncultivated soil (blank soil matrix) was extracted by the citrate buffered solid phase dispersion technique, with and without the purification step with primary and secondary amine sorbent (PSA). From the results was no appreciable difference between the blank soil extract with or without purification (supplementary information). So we concluded that it was not necessary to perform the purification step with adsorbents, but in order to avoid introducing fine soil particles in the GC/MS instrument, the samples were filtrated by silanized glass wool and, anhydrous sodium sulphate was used to eliminate any remaining water.
Matrix effect
For this study the solvent and the soil matrix blank were extracted by QuEChERS. Then, calibration curves were prepared spiking both extracts (in triplicate), independently, with different concentrations of pesticides.
The pesticide matrix effect (ME) was determined using the statistical comparison between the average solvent curves slope and the average slope of the blank soil matrix extract.
From the results (Table III), all the pesticides had ANOVA P-values < 0.05, except for simazine; point out the influence of the matrix soil in 87.5% of the analyzed pesticides. The extent of the matrix effect was also calculated. From all of the pesticides with matrix effect, 75% presented negative matrix effect influence. Some authors attribute this matrix phenomenon to a pesticide interaction and co-elution with the matrix compounds, which are not at trace levels, resulting in a rise of the chromatogram background and a subsequent suppressing of the pesticides signal.38 As more than 50% of the analyzed pesticide showed the matrix effect, the matrix match calibration procedure should be used for quantification; and the pre-concentration of the final extract avoided.
Detection and quantification limits
The detection limit (LOD), for each pesticide, was calculated as the concentration corresponding to three times of the standard devia-tion (3S) of ten independent soil matrix blanks and; the quantificadevia-tion limit (LOQ) was based on ten times the standard deviation (10S). The detection and quantification method limit was calculated considering the internal standard and the matrix match calibration slope.
The obtained LOD and LOQ values for trifluralin, dimethoate, simazine, 4,4’-DDE, 4,4’-DDT, iprodione, methyl azinphos and permethrin are presented in Table IV with other validation results. LOD values ranged from 0.003 to 0.05 mg kg−1 in accord with Lesueur2 (0.003 and 0.09 mg kg−1), and in general with the values for GC/MS detection reported by Vera et al.39 except for dimethoate 0.2 mg kg−1.
Linearity
Determination coefficient (R2) values for each calibration curve (reported in Table III) indicates a linear relationship between areas and concentrations values. The ANOVA P-values for the regressions were less than 0.05 at 95% of confidence level, for the linear concentration range from the LOQ of each pesticide to 1 mg kg−1.
Table 1. Organic farming soil and uncultivated soil pH, humidity percentage
and conductivity values
Soil pH Conductivity
(µS cm-1)
% Humidity
Table 2. Pesticides structure and pka values
Pesticide structure Name pka Observation
Trifluralin 5.3a
-Simazine
1.62b rate of hydrolysis increases at basic pHc
Dimethoate N/A rate of hydrolysis increases at basic pHc
4,4’-DDE N/A
-4,4’-DDT N/A rate of hydrolysis increases at basic pHd
Iprodione N/A rate of hydrolysis increases at basic pHc
Azinphos Methyl 5.0b rate of hydrolysis increases at basic pHc
Permethrin -7.1e Stable at acid pHf
N/A- No applicable. aChelme et al. Water Res.2010, 44(7), 2221-2228; bPPDB: Pesticide Properties Database-Hertfordshire University; cBoletín Técnico N°14,
Departamento Técnico ASP, Chile, 2013; dWolfe et al.Environ. Sci. Tecnol.1977, 11, 1077; ehttp://www.drugbank.ca/drugs/db04930; fhttp://www.who.int/
Table 3. Principal fragments andsoil matrix effect determination for each pesticide Pesticide m/z Average solvent
slope
Average matrix slope
P-value
Student test ME % ME ME extent
trifluralin 145/264/306 6.9 ± 0.5 3.2 ± 0.3 0.0003 Yes <100 % negative
dimethoate 87/93/125 0.7 ± 0.1 1.3 ± 0.3 0.03 Yes >100 % positive
simazine 173/186/201 1.2 ± 0.1 1.4 ± 0.3 0.4 No ≅ 100 % without ME
4,4’-DDE 246/248/318 11.0 ± 0.4 8.4 ± 1.9 0.01 Yes <100 % negative
4,4’-DDT 165/235/237 13.0 ± 0.8 6.2 ± 1.0 0.0008 Yes <100 % negative
iprodione 70/187/314 2.6 ± 0.2 1.9 ± 0.3 0.02 Yes <100 % negative
methyl azinphos 77/132/160 2.6 ± 0.1 1.2 ± 0.1 < 0.0001 Yes <100 % negative permethrin 163/165/183 19.0 ± 1.9 13.0 ± 2.3 0.03 Yes <100 % negative Average slopes of solvent and matrix were calculated from three independent curves, respectively.
Figure 1. Chromatograms of uncultivated soil (I), organic farming soil (II) and organic farming soil spiked (III) with 0.8 mg kg-1 of a multi-standard solu-tion of pesticide. Figure (a): trifluralin (1), dimethoate (2), simazine (3) and 4,4’-DDE (4); Figure (b): 4,4’-DDT (5), iprodione (6), azinphos-methyl (7) and permethrin mixture cis-trans (8)
Intermediate precision and repeatability
The mean intermediate precision and repeatability were expres-sed as relative standard deviation percentage (RSD). The RSD were
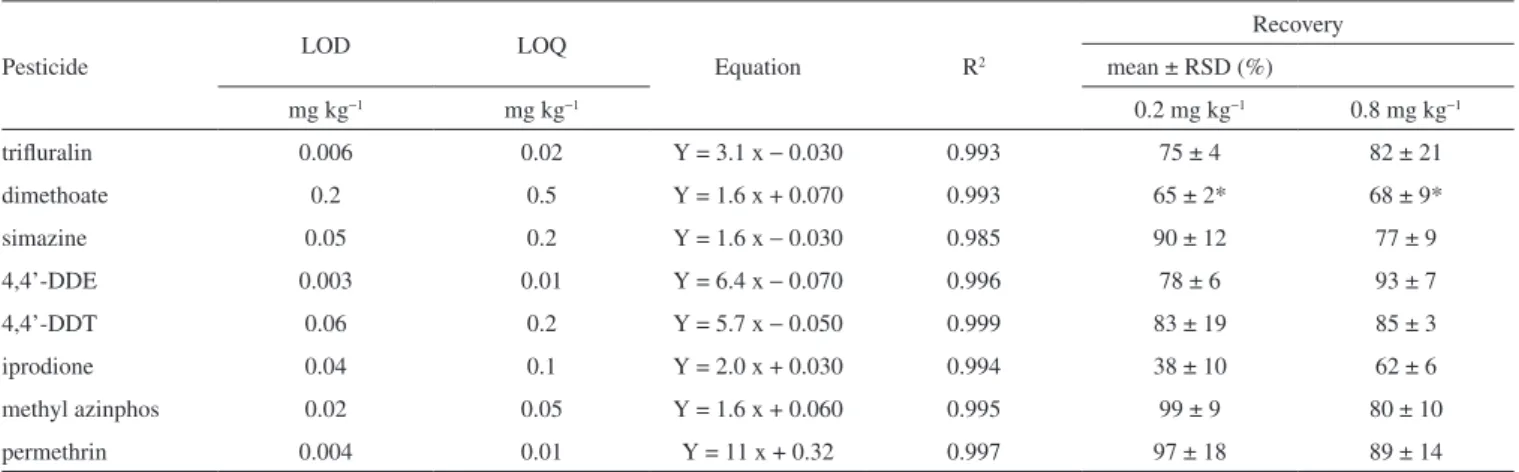
Table 4. Validation parameters for pesticide analysis in soil, by QuEChERS extraction and GC/MS detection
Pesticide LOD LOQ Equation R2
Recovery mean ± RSD (%)
mg kg−1 mg kg−1 0.2 mg kg−1 0.8 mg kg−1
trifluralin 0.006 0.02 Y = 3.1 x − 0.030 0.993 75 ± 4 82 ± 21
dimethoate 0.2 0.5 Y = 1.6 x + 0.070 0.993 65 ± 2* 68 ± 9*
simazine 0.05 0.2 Y = 1.6 x − 0.030 0.985 90 ± 12 77 ± 9
4,4’-DDE 0.003 0.01 Y = 6.4 x − 0.070 0.996 78 ± 6 93 ± 7
4,4’-DDT 0.06 0.2 Y = 5.7 x − 0.050 0.999 83 ± 19 85 ± 3
iprodione 0.04 0.1 Y = 2.0 x + 0.030 0.994 38 ± 10 62 ± 6
methyl azinphos 0.02 0.05 Y = 1.6 x + 0.060 0.995 99 ± 9 80 ± 10
permethrin 0.004 0.01 Y = 11 x + 0.32 0.997 97 ± 18 89 ± 14
*dimethoate: low spiked level 0.6 mg kg−1 and high spiked level 1.0 mg kg−1; quantification range: from the LOQ to 1 mg kg−1.
48 hours and then extracted by QuEChERS after adding TPP (internal standard). Repeatability had values < 20% for all the analytes, similar to other reported soil studies.2 The intermediate precision also had va-lues less than 20%, with the exception of simazine with 23% of RSD. Recovery
Recovery percentage was determined by spiking organic farming soil with 0.20 mg kg−1 and 0.80 mg kg−1, as shown Table IV, except for dimethoate which was evaluated at 0.6 and 1.0 mg kg−1. As can be seen, the pesticides iprodione and dimethoate showed recovery values lower than 70%. This percentage varied on dependence of the pesticide and its concentration level. For the evaluated concentration levels, all the analytes had recoveries between 62 to 99%, except for iprodione which had low recovery (38%) at 0.2 mg kg−1 of concen-tration level, near its quantification limit; it can be associated with stronger matrix/analyte interactions and co-elution of interferents, decreasing its detectability. The range of those results was in accord with other reported recovery values for soil pesticide analysis using different variations of the QuEChERS methodology. Some authors reported recoveries between 60 to 93% for chlorinated compounds employing ethyl acetate40 and; with water/dichloromethane partition from 60 to 100%.36 Using clean-up by liquid/liquid partition with hexane, the informed recoveries for organochlorides reached 70 to 100%.20 Pesticides from organophosphate, triazines and pyrethroid chemical families had been analyzed by solid phase dispersion using 10 grams of soil and PSA for cleanup, reaching recoveries between 70 to 110%; while a median recovery 65.7% was obtained using the European Norm DIN 12393.2
CONCLUSIONS
For the multi-residues method 87.5% of the studied pesticides were affected by the presence of the soil matrix; therefore the quantitation must be carried out in the presence of the matrix. 75% showed negative matrix effect (detection signal suppression), while dimethoate enhanced its chromatography response. Only the herbicide simazine was not influenced by the matrix of soil. The extraction by buffered citrate solid phase dispersion methodology had acceptable recoveries between 62 to 99%, except for iprodione with low recov-ery at concentration near its quantification limits. The clean-up step with absorbents was not necessary. Intermediate precision values were in general ≤ 20%. LOD values range from 0.003 (4,4’-DDE) to 0.2 mg kg−1 (dimethoate) and LOQ goes from 0.01 to 0.5 mg kg−1. Dimethoate, simazine, 4,4’-DDT and iprodione had the higher
quantification limits ≥ 0.1 mg kg−1. The method was shown to be ef-fective for extraction and quantification of pesticide from soil matrix with different physico-chemical properties, except for iprodione. But this compound could be quantified at concentrations higher than 0.2 mg kg−1 using the matrix match calibration procedure.
SUPPLEMENTARY MATERIAL
Figure 1S presents SIR chromatograms of the uncultivated soil extracted by solid phase dispersion with and without clean up step. The supplementary material can be freely accessed at http://quimi-canova.sbq.org.br in pdf format.
ACKNOWLEDGEMENTS
The authors want to thank CONICYT for their financial support through the Integration Project No. 79095004-2010 and Fondef Project No. D09I1070; also to the DGIP- UTFSM for their support in the course of the Internal Project No. 131434; the collaboration of Dra. Beatriz Cámara, Dr. Mario Ollino, and Alison Sherman for this study edition; and organic farmer Mr. Daniel Rabb.
REFERENCES
1. Kummu, M.; Varis, O.; Applied Geography2011, 31, 495.
2. Lesueur, C.; Gartner, M.; Mentler, A.; Fuerhacker, M.; Talanta2008, 75, 284.
3. Whitehorn, P. R.; O’Connor, S.; Wackers, F. L.; Goulson, D.; Science
2012, 336, 351.
4. Stokstad, E.; Science 2013, 340, 674.
5. González, N.V.; Molinari, G.; Soloneski, S.; Larramendy, M. L.; Theoria
2008, 17, 27.
6. Martínez, C.; Gómez, S.; Rev. Int. Contam. Ambient. 2007, 23, 185. 7. Oosthoek, S.; Nature 2013, doi:10.1038/nature.2013.13214.
8. Kookana, R.; Holz, G.; Barnes, C.; Bubb, K.; Fremlin, R.; Boardman, B.; J. Environ. Manage.2010, 91, 2649.
9. Struger, J.; Fletcher, T.; J. Great Lakes Res. 2007, 33, 887.
10. Belmonte, A.; Garrido, A.; Martínez, J. L.; Anal. Chim. Acta 2005, 538,117.
11. Andrade, M. L.; Fernández, E.; Alonso, M. F.; Rev. Pilquen. secc. cienc. soc.2005, VII(7), 1.
12. Velki, M.; Hackenberger, B. K.; Soil Biol. Biochem. 2013, 57, 100. 13. Reinecke, S. A.; Reinecke, A.; Ecotoxicol. Environ. Saf.2007, 66, 244. 14. Hussain, S.; Siddique, T.; Saleem, M.; Arshad, M.; Khalid, A.; Adv.
15. Chowdhury, A.; Pradhan, S.; Saha, M.; Sanyal, N.; Indian J. Microbiol.
2008, 48, 114.
16. Lo, C.C.; J. Environ. Sci. Health, Part B2010, 45, 348. 17. Darko, G.; Akoto, O.; Oppong, C.; Chemosphere2008, 72, 21. 18. Wang, D. Q.; Yu, Y. X.; Zhang, X. Y.; Zhang, S. H.; Pang, Y. P.; Zhang,
X. L.; Yu, Z. Q.; Wu, M. H.; Fu, J. M.; Ecotoxicol. Environ. Saf.2012, 82, 63.
19. Tejada, M.; Gómez, I.; del Toro, M.; Ecotoxicol. Environ. Saf. 2011, 74, 2075.
20. Rashid, A.; Nawaz, S.; Barker, H.; Ahmad, I.; Ashraf, M.; J. Chromatogr. A2010, 1217, 2933.
21. Wong, F.; Alegria, H. A.; Bidleman, T. F.; Environ. Pollut.2010, 158, 749.
22. Sun, L.; Lee, H. K.; J. Chromatogr. A 2003, 1014, 165. 23. Merdassa, Y.; Liu, J.F.; Megersa, N.; Talanta 2013, 114, 227. 24. Popp, P.; Keil, P.; Möder, M.; Paschke, A.; Thuss, U.; J. Chromatogr. A
1997, 774, 203.
25. Hoai, P. M.; Sebesvari, Z.; Minh, T. B.; Viet, P. H.; Renaud, F. G.; Environ. Pollut. 2011, 159, 3344.
26. Naeenia, M. H.; Yamini, Y.; Rezaee, M.; J. Supercrit. Fluid 2011, 57, 219.
27. Nanita, S. C.; Pentz, A. M.; Grant, J.; Vogl, E.; Devine, T. J.; Henze, R. M.; Anal. Chem. 2009, 81, 797.
28. Anastassiades, M.; Lehotay, S. J.; Stajnbaher, D.; Schenck, F. J.; J. AOAC Int. 2003, 86, 412.
29. Bragança, I.; Plácido, A.; Paíga, P.; Domingues, V. F.; Delerue, C.; Sci. Total Environ. 2012, 433, 281.
30. Tomasini, D.; Sampaio, M. R. F.; Caldas, S. S.; Buffon, J. G.; Duarte, F. A.; Primel, E. G.; Talanta 2012, 99, 380.
31. Norli, H.R.; Christiansen, A.; Deribe, E.; J. Chromatogr. A 2011, 1218, 7234.
32. Padilla, J. A.; Plaza, P.; Romero, R.; Garrido, A.; Martínez, J. L.; J. Chromatogr. A 2010, 1217, 5724.
33. Camino, F. J.; Zafra, A.; Ruiz, J.; Bermúdez, R.; Ballesteros, O.; Navalon, A.; Vílchez, J. L.; J.Food Comp. Anal.2011, 24, 427. 34. Mejías, J.; Jerez, J.; In Guía para la toma de muestras de residuos de
plaguicidas. Aguas, sedimentos y suelos; Boletín 154, Ministerio de Agricultura: Temuco, 2006, 30. (ISSN-0717-4829).
35. http://phx.phenomenex.com/lib/tn97851012_W.pdf, accessed September 2013.
36. Rouvière, F.; Buleté, A.; Cren, C.; Arnaudguilhem, C.; Talanta 2012, 93, 336.
37. http://www.pir.sa.gov.au/pirsa/more/factsheets/fact_sheets/salinity/ testing_for_soil_and_water_salinity, accessed September 2013. 38. Hajšlová, J.; Holadová, K.; Kocourek, V.; Poustka, J.; Godula, M.;
Cuhra, P.; Kempný, M.; J. Chromatogr. A 1998, 800, 283.
39. Vera, J.; Correia-Sá, L.; Paíga, P.; Bragança, I.; Fernandes, V. C.; Domingues, V. F.; Delerue-Matos, C.; Sample Preparation2013, 54. Doi: 10.2478/sampre-2013-0006.