Article
0103 - 5053 $6.00+0.00
*e-mail: [email protected], [email protected]
Isolation, X-ray Crystal Structure and Theoretical Calculations of the New
Compound 8-Epicordatin and Identiication of others Terpenes and Steroids from
the Bark and Leaves of
Croton palanostigma
Klotzsch
Davi S. B. Brasil,a,b Adolfo H. Müller,*,a,c Gisele M. S. P. Guilhon,a Cláudio N. Alves,a
Gabriel Peris,d Rosa Llusard and Vicent Molinerd
aInstituto de Ciências Exatas e Naturais, Universidade Federal do Pará, Av. Augusto Corrêa, 01,
66075-900 Belém-PA, Brazil
bFaculdade de Engenharia Química, Instituto de Tecnologia, Universidade Federal do Pará,
Av. Augusto Corrêa, 01, 66075-900 Belém-PA, Brazil
cCentro Universitário do Estado do Pará, Av Nazaré, 630, 66035-170 Belém-PA, Brazil
dDepartament de Química Física i Analítica, Universitat Jaume I, 12071, Castellón, Spain
Estudos itoquímicos com as cascas do caule e com as folhas de Croton palanostigma Klotzsch
(Euphorbiaceae) levaram ao isolamento do novo diterpeno clerodânico 8-epicordatina (2), além de éster metílico do ácido 12-oxohardwickiico (3), aparisthmano, cordatina (1), ácido ent
-trachiloban-18-óico, óxido de ent-13-epimanoila, óxido de ent-3-oxo-13-epimanoila, óxido de ent-3β -hidroxi-13-epimanoila, sitosterol, estigmasterol, estigmastan-3-ona, 6β-hidroxiestigmast-4-en-3-ona, 6b-hidroxiestigmasta-4,22-dien-3-ona, estigmast-4-en-3-ona, estigmasta-4,22-dien-3-ona, ácido 3-O-acetilaleuritolico, 11a-hidroxiurs-12-en-3-ona, a-amirenona, 24-metilenocicloartenona
e lupenona. Estas substâncias foram isoladas através de procedimentos itoquímicos usuais e suas estruturas foram deduzidas por estudos espectroscópicos, incluindo experimentos em 2D. Adicionalmente, a estrutura cristalina de 8-epicordatina (2) foi determinada por difração de raios-X. Cálculos teóricos de RMN ao nível B3PW91/DGDZVP foram usados para conirmação dos assinalamentos dos deslocamentos químicos dos hidrogênios H-7a e H-7β de 8-epicordatina.
Phytochemical studies of the bark and leaves of Croton palanostigma Klotzsch(Euphorbiaceae) led to the isolation of a new clerodane diterpene, 8-epicordatin (2), in addition to 12-oxohardwickiic acid methyl ester (3), aparisthman, cordatin (1), ent-trachyloban-18-oic acid, ent-13-epimanoyl
oxide, ent-3-oxo-13-epimanoyl oxide, ent-3b-hydroxy-13-epimanoyl oxide, sitosterol, stigmasterol,
stigmastan-3-one, 6b-hydroxystigmast-4-en-3-one, 6b-hydroxystigmasta-4,22-dien-3-one, stigmast-4-en-3-one, stigmasta-4,22-dien-3-one, 3-O-acetylaleuritolic acid, 11a -hydroxyurs-12-en-3-one, a-amyrenone, 24-methylenecycloartenone and lupenone. These compounds were isolated using typical phytochemical procedures and the structures were deduced from spectroscopic studies, including 2D NMR experiments. In addition, the crystalline structure of 8-epicordatin (2) was determined by X-ray diffraction. NMR theoretical calculations at the B3PW91/DGDZVP level were used to conirm the assignment of the chemical shifts of the H-7a and H-7b hydrogens of 8-epicordatin.
Keywords:Croton palanostigma Klotzsch, terpenes, steroids, NMR DFT calculations, X-ray
crystallography
Introduction
Croton palanostigma Klotzsch (Euphorbiaceae) is a medium-sized tree native to the Northern Brazilian
coastal region. Phytochemical studies of the bark of C. palanostigma under the erroneous identiication of Aparisthmium cordatum1 yielded two furan diterpenes with
a clerodane skeleton, namely, aparisthman2 and cordatin
(1).3 These compounds showed anti-ulcer activity similar
treatment of peptic ulcers.4,5 This species, together with
various Croton spp., is known to produce a red viscous
sap called dragon’s blood. The sap of C. palanostigma is
reported to have various pharmacological and physiological
actions.6 Phytochemical studies of dragon’s blood obtained
from Croton spp. led to the isolation of the alkaloid taspine,7
the dihydrobenzofuran lignans 3´,4-O-dimethylcedrusin8
and 4-O-methylcedrusin,9 and proanthocyanidins.10
The principal mechanism of the anti-ulcerogenic
effect of cordatin (1) remains unknown. It seems to be
related to an anti-secretory property, but the involvement of a mucosal defensive mechanism should not be
ignored.5 Other anti-ulcerogenic drugs, such as the
proton pump inhibitors omeprazole, lansoprazole and pantoprazole, exist as pro-drugs that need activation
for interaction with gastric H+,K+-ATPase.11 Protonation
of these compounds results in extensive molecular rearrangement followed by the formation of a positively charged sulfenamide species that has a low permeability coeficient across membranes and reacts covalently with free sulfhydryl group(s) on the extracellular surface of
H+,K+-ATPase.12 The sulfonamide forms a disulide that
covalently modiies the enzyme’s extracellular domain and inhibits it with a stoichiometry of ~2 molecules of
drug per subunit of H+,K+-ATPase.11
In the present work, a new phytochemical study of C.
palanostigma was undertaken. The dichloromethane extract of the bark resulted in the new compound 8-epicordatin
(2) (Figure 1). The hexane extract of the bark yielded
12-oxohardwickiic acid methyl ester (3), together with
other six diterpenoids, seven steroids and one triterpenoid. The hexane extract of the leaves yielded four triterpenoids. This study demonstrates the use of theoretical calculations in determining geometric parameters, chemical shifts and NMR coupling constants. The molecular electrostatic potential (MEP) was also calculated to deine the most probable sites of interaction of 1 and 2 with H+ ions in
gastric luid.
Results and Discussion
The structures of the isolated compounds were deduced
mainly from 1H and 13C NMR spectroscopic data at 300
and 75.4 MHz, respectively, with the aid of 1H, 1H-COSY,
13C,1H-COSY-1J (CH) and 13C, 1H-COSY-2;3J (CH)
spectra. DEPT pulse sequences were used to determine the hydrogenation pattern of the carbons.
12-Oxohardwickiic acid methyl ester (3) was isolated
as an oil. Its molecular formula is C21H28O4 (EIMS). Its IR
spectrum is consistent with the presence of two conjugated carbonyl groups corresponding to peaks at 1668 (ketone
adjacent to a furan ring) and 1714 cm-1 (ester adjacent to a
double bond) and a furan ring (3135, 1509 and 872 cm-1).13
Table 1 shows the 1H and 13C NMR spectroscopic data for
3; these data are in complete agreement with those reported
in the literature for 3, which was obtained by oxidation of
12-hydroxyhardwickiic acid methyl ester, isolated from a
hexane extract of the roots of Croton sonderianus.14 This
compound (3) was isolated for the irst time as a natural
product from Crotonpolyandrous.15
The new natural product 8-epicordatin (2) was isolated
as crystals. Its IR spectrum is consistent with the presence
of an O–H group (3540 cm-1), two carbonyl groups
corresponding to peaks at 1704 (δ-lactone) and 1733 cm-1
(methyl ester) and a furan ring (3100, 1503 and 873 cm-1).13
Its molecular formula is C21H26O6 (HRMS). This compound
was identiied by comparison of its NMR data (Table 1)
with those reported in the literature for cordatin (1)3,
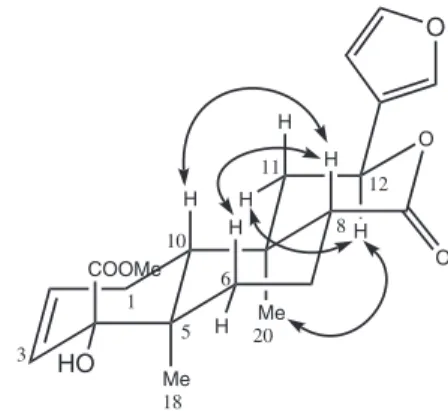
crotobrasilin A16 and epi-cordatin.17 In addition, the NOESY
data are similar to those reported in the literature used to propose the relative conigurations at asymmetric centers
for crotobrasilin A16 (Figure 2). Therefore, the new natural
product 8-epicordatin (2) is the non-acetylated form of
crotobrasilin A.16 Finally, the structure of 8-epicordatin
(2) was also conirmed by X-ray diffraction. The ORTEP
representation for the molecular labeling in the X-ray
structure of 2 is shown in Figure 3. The most relevant X-ray
Figure 1. Structures of 1, 2 and 3. Figure 2. Signiicant NOESY correlations of 2.
and theoretical structural parameters for 2 are shown in
Tables 2 and 3; complete data for the X-ray structure are shown in the supplementary material.
The configurations of the asymmetrical centers
of aparisthman and cordatin (1) were determined by
comparison of their NMR spectroscopic data with those
obtained for authentic samples. Detailed NMR data for 1
are presented in Table 1.
The known compounds were identiied by comparison of their spectroscopic data with those reported in the
literature. The 13C NMR spectral signals of ent
-trachyloban-18-oic acid at d 16.2 (Me-19) and 14.9 (Me-20) excluded
the possible epimer ent-trachyloban-19-oic acid18
[d 28.8 (Me-18) and 12.4 (Me-20)]. Furthermore, the
coniguration of ent-8a,13S to ent-3-oxo-13-epimanoyl
oxide was conirmed by comparison of its optical rotation,
Table 1. NMR spectroscopic dataa (300 and 75.4 MHz, CDCl
3) for cordatin (1), 8-epicordatin (2) and 12-oxohardwickiic acid methyl ester (3)
Position Cordatin (1) 8-Epicordatin (2) 12-Oxohardwickiic acid methyl ester (3)
dC, mult. dH (J in Hz) dC, mult. dH (J in Hz) dC, mult. dH (J in Hz)
1 23.1, CH2 2.02, m 22.9, CH2 2.10, m 18.9, CH2 a, 1.52, ddd (1.3, 7.5, 13.5) b
, 1.76, m
2 130.0, CH 5.93, ddd
(2.7, 4.6, 10.1) 130.0, CH
5.95, ddd
(2.9, 4.6, 10.0) 27.0, CH2
a, 2.15, m
b, 2.07, ddd (3.3, 7.5, 11.4) 3 128.5, CH (2.3, 10.1)5.31, dt 128.7, CH (1.8, 2.5, 10.0)5.36, ddd 137.3, CH 6.56, dd (3.3, 4.5)
4 80.7, qC 81.2, qC 141.9, qC
5 40.6, qC 40.5, qC 37.9, qC
6 28.4, CH2 a, 1.54, dt (3.6, 13.4) b
, 1.36, m 33.2, CH2
a, 1.86, dt (2.7, 13.3)
b, 0.91, td (3.0, 13.3) 35.3, CH2
a, 2.23, dt (3.0, 12.7)
b, 1.12, m 7 17.7, CH2 b, 2.10, dq (3.6, 15.2)a, 1.78, m 18.1, CH2 a, 1.60, m b, 2.10, m 27.4, CH2 1.40, m
8 44.9, CH 2.48, dd (1.9, 3.6) 51.4, CH 2.07, m 37.3, CH 1.86, m
9 35.3, qC 36.4, qC 42.4, qC
10 44.7, CH 2.29, dd (5.6, 10.4) 44.7, CH 2.33, dd (5.2, 11.0) 47.1, CH 1.70, dd (1.3, 13.5) 11 48.9, CH2 a, 2.00, dd (1.8, 14.1) b
, 1.78, m 44.4, CH2
a, 2.29, dd (5.4, 13.6)
b, 1.67, dd (11.7, 13.6) 47.6, CH2
a, 2.70, d (14.8) b, 2.77, d (14.8) 12 69.8, CH 5.24 br, d (11.0) 71.9, CH 5.48, dd (5.4, 11.7) 194.9, qC
13 123.9, qC 125.8, qC 129.6, qC
14 108.5, CH 6.42, dd (0.9, 1.9) 108.5, CH 6.41, dd (0.9, 1.9) 108.9, CH 6.73, dd (0.8, 1.9)
15 143.6, CH 7.41, t (1.9) 143.7, CH 7.41, t (1.9) 144.1, CH 7.41, dd (1.4, 1.9)
16 139.6, CH 7.47 br, s 139.3, CH 7.44, m 146.7, CH 7.99, dd (0.8, 1.4)
17 173.8, qC 171.9, qC 16.6, CH3 0.90, d (6.8)
18 14.8, CH3 1.10, s 15.2, CH3 1.12, s 20.6, CH3 1.26, s
19 175.9, qC 175.5, qC 167.7, qC
20 24.4, CH3 1.32, s 15.4, CH3 1.17, s 17.6, CH3 0.84, s
21 53.4, CH3 3.78, s 53.2, CH3 3.81, s 51.0, CH3 3.66, s
a1H NMR referenced to CHCl
3 at d 7.26 ppm; 1H, 1H-COSY spectra were used to determine spin-spin interactions.;13C NMR referenced to CHCl3 at
d 77.00 ppm. All assignments were conirmed by 1H, 1H-COSY 13C, 1H-COSY-1J
CH and 13C, 1H-COSY-2;3 JCH experiments.
[a]2
D5 –50.9° (CHCl3, c 0.11) and spectroscopic data to those
reported in the literature.19 The same coniguration was
proposed for ent-13-epimanoyl oxide and ent-3b
-hydroxy-13-epimanoyl oxide.
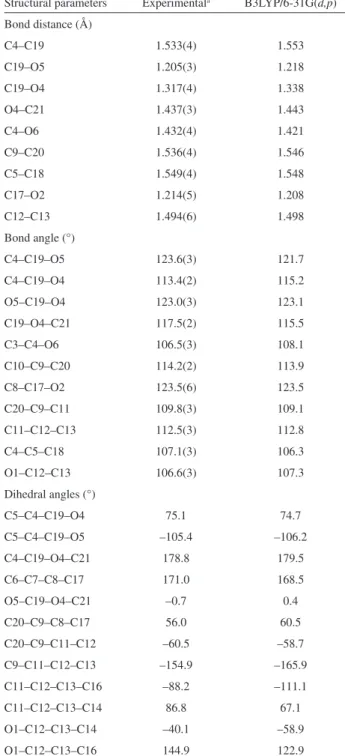
The atomic distances, angles and torsion angles for
both X-ray and B3LYP/6-31G(d,p) optimized structures
of 2 presented in Table 3 are common for this type of
compound. The hydroxyl group O6-H is involved in an intramolecular hydrogen bond with O5 at 2.128 Å (1.941 Å in calculations).
The crystallographic parameters for 2 were compared
with data from the literature for 1,1,3 revealing similar
structural parameters in the case of a trans relationship
between the methyl group (C-20) attached to C-9 and the hydrogen borne by C-10, and the same type of relationship between the methyl group (C-18) attached to C-5 and the
carbonyl carbon (C-19) linked to C-4. The cis relationship
existing between the hydrogen on C-8 and the methyl
group (C-20) located at C-9 in 11,3 is not present in 2. In
this case, a trans relationship is observed. These results
demonstrate that 2 has a trans-clerodane skeleton with a
chair conformation for ring B and half-chair conformations for rings A and C due to the location of the double bond between C-2 and C-3 and the ester group at C-17.
Table 2. Crystallographic data for 2
Empirical formula C21 H26 O6
Molecular weight 374.42
Temperature 273(2) K
Wavelength 0.71073 Å
Crystal system Tetragonal
Space group P4(1)2(1)2
Unit cell dimensions a = 11.9617(5) Å, a = 90° b = 11.9617(5) Å, b = 90° c = 26.1728(15) Å, g = 90°
Volume 3744.9(3) Å3
Z 8
Density (calculated) 1.328 g/m3
Absorption coeficient 0.097 mm-1
F(000) 1600
Crystal size 0.50×0.36×0.29 mm3
q range for data collection 1.87-26.37°
Index ranges –10≤h≤10, 0≤k≤14, 0≤l≤32 Relections collected 3832
Independent relections 3832 [R(int)=0.0000] Completeness to q = 26.37° 100.0%
Absorption correction Semi-empirical from equivalents Max. and min. transmission 0.9725 and 0.9532
Reinement method Full-matrix least-squares on F2
Data/restraints/parameters 3832/0/249 Goodness-of-it of F2 1.015
Final R indices [I > 2sigma(I)] R1 = 0.0576, wR2 = 0.1489 R indices (all data) R1 = 0.0915, wR2 = 0.1775 Extinction coeficient 0.0063(13)
Largest diff. peak and hole 0.243 and –0.179 e Å–3
Table 3. Experimental and theoretical structural parameters for 2 Structural parameters Experimentala B3LYP/6-31G(d,p)
Bond distance (Å)
C4–C19 1.533(4) 1.553
C19–O5 1.205(3) 1.218
C19–O4 1.317(4) 1.338
O4–C21 1.437(3) 1.443
C4–O6 1.432(4) 1.421
C9–C20 1.536(4) 1.546
C5–C18 1.549(4) 1.548
C17–O2 1.214(5) 1.208
C12–C13 1.494(6) 1.498
Bond angle (°)
C4–C19–O5 123.6(3) 121.7
C4–C19–O4 113.4(2) 115.2
O5–C19–O4 123.0(3) 123.1
C19–O4–C21 117.5(2) 115.5
C3–C4–O6 106.5(3) 108.1
C10–C9–C20 114.2(2) 113.9
C8–C17–O2 123.5(6) 123.5
C20–C9–C11 109.8(3) 109.1
C11–C12–C13 112.5(3) 112.8
C4–C5–C18 107.1(3) 106.3
O1–C12–C13 106.6(3) 107.3
Dihedral angles (°)
C5–C4–C19–O4 75.1 74.7
C5–C4–C19–O5 –105.4 –106.2
C4–C19–O4–C21 178.8 179.5
C6–C7–C8–C17 171.0 168.5
O5–C19–O4–C21 –0.7 0.4
C20–C9–C8–C17 56.0 60.5
C20–C9–C11–C12 –60.5 –58.7
C9–C11–C12–C13 –154.9 –165.9
C11–C12–C13–C16 –88.2 –111.1
C11–C12–C13–C14 86.8 67.1
O1–C12–C13–C14 –40.1 –58.9
O1–C12–C13–C16 144.9 122.9
The 1H and 13C NMR spectra were calculated for 2 and
TMS (internal standard) (shielding constants of 32.1843 to
1H and 186.3296 to 13C). Calculated and experimental 1H and
13C NMR chemical shifts, as well as theoretical, predicted and
experimental results for the coupling constants [nJ (H-H)]
of 2 are presented in the supplementary material. The most
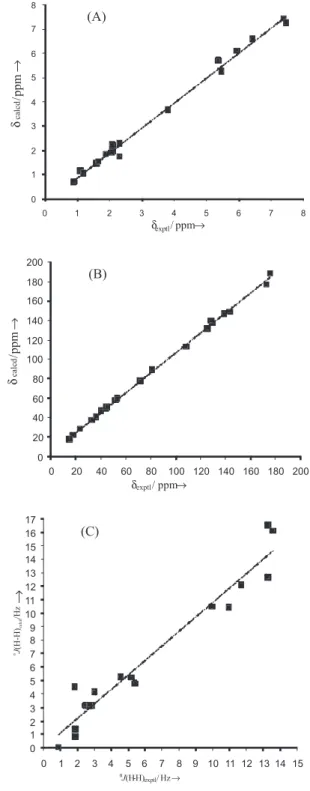
relevant statistical parameters are presented in Table 4. Figure 4 shows the correlation between calculated and
experimental 1H chemical shifts (A), 13C chemical shifts
(B) and coupling constants (C). Statistical analysis revealed
good correlation for the model of 1H and 13C chemical
shifts (R2 = 99.41%, F = 2703.85, s = 0.19, Q2 = 99.26%
for 1H and R2 = 99.89%, F = 18054.82, s = 1.84, Q2 = 99.86%
for 13C) (Figure 4 A and B). Calculations for the coupling
constant yielded slightly worse results compared to
those for the chemical shifts (Figure 4 C) (R2 = 94.68%,
F = 289.42, s = 1.22, Q2 = 92.80%), but they are considered
satisfactory. These results conirm the relevance of the theoretical data used to conirm chemical shifts for the
hydrogens H-7a (1.60 experimental and 1.55 predicted) and
H-7b(2.10 experimental and 2.32 predicted) because the
NMR experiments performed did not allow this deinition. In Figure 4B, we can see that the general correlation to
statistical analysis of 13C NMR parameters is satisfactory,
because all signals originating from different functional groups fall into their own distinctive regions. Thus, the overall reliability of this calculation is borne out. However some signals appear in reverse order than they would in the experimental spectrum. We note that these inversions do occur, nevertheless, only for closely spaced points, hence presumably originating from nuclei in the same functional
group. The order is correct for 17 (out of 21) 13C NMR
signals, but two pairs are interchanged with respect to the experimental ordering: C-2, C-3 (theoretical = 137.6 and 139.5 ppm; experimental = 130.0 and 128.7 ppm, respectively) and C-10, C-11(theoretical = 50.1 and 51.3 ppm; experimental = 44.7 and 44.4 ppm, respectively).
Despite the signiicant results in the statistical analysis, the individual differences between experimental and
theoretical 13C NMR data are considerably high. For
example, there are chemical shifts of some sp2 carbons
in which the theoretical and experimental chemical shifts differ by more than 8 ppm (for C-3 the residue is 10.8 ppm, for C-19 the residue is 12.2 ppm).
Recently, we successfully used three-dimensional MEP surfaces to deine the most probable sites of protonation of dipyridamole and on the study of the molecular mechanisms
Figure 4. Correlation between calculated (B3PW91/DGDZVP) and experimental 1H (A) 13C (B) NMR chemical shifts and coupling constant
[nJ(H–H)] (C) of 2.
Table 4. Correlation and itting parameters for calculated NMR properties of 2a
A b R2 F s Q2
d (1H) –0.17 1.03 99.41% 2703.85 0.19 99.26%
d (13C) 3.91 1.03 99.89% 18054.82 1.84 99.86% nJ(H–H) 0.05 1.08 94.68% 289.42 1.22 92.80% aLinear itting parameters refer to d
calcd = a+bdexptl. For coupling constants
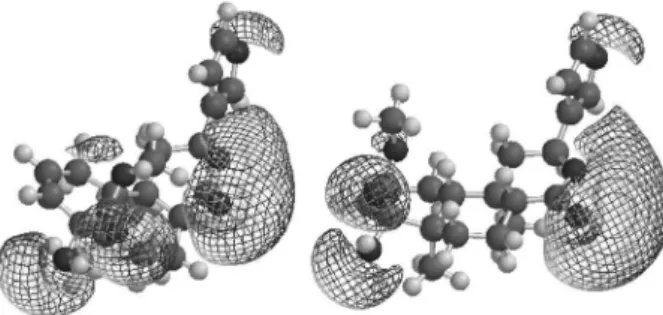
the Diels-Alder reaction.20 The MEP surfaces of 1 and 2
(Figure 5) in terms of total electron density show that the lowest electronic potential is in the proximity of oxygen atoms of the lactone (O1, O2), the hydroxyl group (O6) and the carbonyl group of ester (O5). The large negative potential of oxygen atoms may be regarded as a nucleophilic
suction pump,21 acting as a possible magnet for electrophilic
attack of H+ or part of a biological receptor. The surfaces
of 1 and 2 are visually similar, suggesting that 2 may have
anti-ulcer activity similar to that of 1. Experimental studies
are being conducted to prove this hypothesis for 2.
Experimental
General Experimental Procedures
IR spectra were recorded on NaCl for compound 3 and
using the pure substance for compound 2. 1H and 13C NMR
data were obtained at 300 and 75.4 MHz, respectively, in
CDCl3 using the solvent peak as the internal standard. EIMS
spectra were obtained at 70 eV (probe) for compound 3
and HREI-MS data were obtained for compound 2. TLC
was on silica gel 60H (Merck 7736) and CC on silica gel (Merck 7734).
Plant Material
Croton palanostigma Klotzsch (Euphorbiaceae) was collected in March 2007 in Terra Alta, Pará, Brazil. A voucher specimen was identiied by Dr. Ricardo Secco and is deposited in the herbarium of Museu Paraense Emílio Goeldi, Belém, Pará, Brazil (MG 182.822).
Extraction and isolation
Dried and powdered bark (740 g) and leaves (590 g) of C. palanostigma were successively extracted in a Soxhlet
apparatus using hexane, CH2Cl2 and MeOH. During
concentration of the hexane bark extract, a white solid (1.5 g) composed mainly of aparisthman and cordatin
(1) (1:1) precipitated. The remaining hexane bark extract
was concentrated under vacuum to yield a gum (20.5 g). The gum was subjected to CC and TLC on silica gel and eluted with mixtures of hexane, EtOAc and MeOH
in increasing order of polarity, yielding aparisthman2
(800 mg), 13 (60 mg), 314 (7 mg), ent
-trachyloban-18-oic acid22 (217 mg), ent-13-epimanoyl oxide19
(40 mg), ent-3-oxo-13-epimanoyl oxide19 (18 mg) ent
-3b-hydroxy-13-epimanoyl oxide19 + 3-O-acetylaleuritolic
acid23 (6 mg), sitosterol24,25 + stigmasterol25 (13 mg),
stigmastan-3-one26 (5 mg), 6b
-hydroxystigmast-4-en-3-one27 + 6b-hydroxystigmasta-4,22-dien-3-one28 (41 mg),
stigmast-4-en-3-one27 + stigmasta-4,22-dien-3-one29
(13 mg) and 3-O-acetylaleuritolic acid23 (127 mg). The
dichloromethane bark extract was concentrated under vacuum to yield a gum (5.1 g). The gum was subjected to CC and TLC and eluted with mixtures of hexane, EtOAc and MeOH in increasing order of polarity, yielding
13 (270 mg) and the new compound 8-epicordatin (2)
(20 mg). The hexane leaf extract was concentrated under vacuum to yield a gum (2.6 g). The gum was subjected to CC and TLC and eluted with hexane, EtOAc and MeOH
in increasing order of polarity, yielding a-amyrenone30 +
24-methylenecycloartenone31 + lupenone30,32 (31 mg) and
11a-hydroxyurs-12-en-3-one33 (10 mg).
Crystallography
A single crystal of 2 was mounted on glass fiber
in random orientation. Data collection was performed at room temperature using a Siemens Smart CCD
diffractometer with graphite-monochromated Mo-Ka
radiation (l = 0.71073 A) with a nominal crystal detection
distance of 4.0 cm. A hemisphere of data was collected
based on three w-scans (starting w = –28°) at values of
f = 0°, 90° and 180° with the detector at 2q = 28°. For each
of these runs, frames (606, 435 and 230, respectively) were
collected at 0.3° intervals using 30 s per frame.
The diffraction frames were integrated using the SAINT
package34 and corrected for absorption using SADABS.35
Table 2 shows a summary of data collection and reinement conditions for the crystal structure.
Computational Methods
Since it was dificult to deine chemical shifts for
hydrogens H-7a and H-7b, theoretical NMR calculations
at the B3PW91/DGDZVP level were used to conirm the assignments. Similar methods involving comparison of experimental and theoretical NMR data have been
reported for aparisthman,36 strychnine,37 corianlactone,37
daphnipaxinin,37 boletunone B,37 julocrotine,38 cordatin1
and others.
The geometry obtained from X-ray diffraction data of
2 was used as input for the full geometry optimization.
This molecular conformation was optimized using the
B3LYP hybrid functional,39 together with the 6-31G(d,p)
basis in the Gaussian 03 molecular package.40 Vibrational
analysis was carried out for the complete equilibrium geometry obtained by the procedure in the Gaussian 03
package at the DFT level with the B3LYP/6-31G(d,p) level
in the gas phase, ensuring that each gradient optimization located was indeed a true minimum energy structure (no imaginary frequencies). Normal modes were analyzed
visually using Hyperchem 7.5.41 NMR (1H and 13Cchemical
shifts and coupling constants) spectra were calculated by the B3PW91/DGDZVP method in the gas phase for
the geometry optimized using the B3LYP/6-31G(d,p)
method. The use of a method for geometry optimization
(B3LYP/6-31G(d,p) ) and another one for NMR calculation
has been successfully used by Bagno et al. (2006)37 to
predict NMR data of several natural products. Recently,
we have successfully used this methodology to study 1H
and 13C NMR spectra of cordatin.1 In this case the geometry
obtained was similar to that observed by X-Ray diffraction and could be used in calculations of NMR proprieties. All
calculations were performed using Gaussian 03.40 Linear
regression analysis of NMR data was performed and relevant parameters were selected: correlation coeficients
(R2), Fisher ratio values (F), the standard deviation (s) and
the predictive ability of the model (Q2). MINITAB® release
14 was used for statistical analysis.42
The MEP surface was generated using HF/6-31G(d,p)
with the geometry optimized in B3LYP/6-31G(d,p) and
an isopotential of –20.0 a.u. On the MEP surface, regions indicating excess negative potential correspond to excess negative charges, i.e., attraction of the positively charged probe. The MEP surface was calculated and analyzed
visually using the PC Spartan PRO molecular package.43
8-Epicordatin (2)
Crystals; Dec. 174-176 °C; [a]2
D5 +107.35° (c 0.19,
CHCl3); IR nmax/cm-1: 3540, 3100, 2947, 1733, 1704, 1503,
1429, 1367, 1246, 1132, 1089, 873; 1H NMR: see Table 1
and 13C NMR: see Table 1; HRMS m/z [M+Na]+ 397.1635
(calc. for C21H26O6+Na, 397.1627); X-ray crystallography
data: see Table 3 and Figure 3.
12-Oxohardwickiic acid methyl ester (3) Oil. [a]2
D5 –24.07° (c 0.054, CHCl3); IR nmax/cm-1: 3135,
1714, 1668, 1509, 1461, 1250, 1232, 1157, 872; 1H NMR:
see Table 1 and 13C NMR: see Table 1; EIMS m/z (rel. int.):
344 [M]+ (0.3), 313 [M–OMe]+ (2.6), 284 [M–HCO
2Me]+
(0.5), 236 (10.0), 235 (57.3), 234 [M–CH2=C-furyl]+ (19.8),
233 (5.3), 220 (21.2), 219 [234–Me]+ (100), 218 (13.7), 217
(7.0), 187 (15.7), 175 (3.1), 105 (4.0), 95 (10.5).
Conclusions
The chemical study of the bark and leaves of Croton
palanostigma Klotzsch (Euphorbiaceae) led to the isolation of a new clerodane diterpene, 8-epicordatin. X-ray diffraction, NMR experiments and theoretical calculations were used to propose the structure of this compound. The calculated geometric parameters are close to the X-ray crystal structure indicating the accuracy of theoretical method used. The NMR theoretical values show good correlation and high predictive power and could be used to conirm the chemical shifts of
hydrogens H-7a and H-7b. Therefore, DFT calculations can
attain a considerable degree of accuracy in the prediction of
the 13C and 1H NMR spectra of complex organic molecules
such as natural products. The MEP surfaces of cordatin and 8-epicordatin shows four sites susceptible of protonation (O1, O2, O5 and O6 positions) indicating that these species might, consequently, interact with the extracellular surface
of the H+, K+-ATPase.
Supplementary Information
Crystallographic data for the structure reported in this paper have been deposited with the Cambridge Crystallographic Data Centre, number CCDC 666036. Copies of the data can be obtained, free of charge, on application to the Director, CCDC, 12 Union Road, Cambridge CB2 1EZ, UK (fax: +44-1223-336033 or e-mail: [email protected]).
Acknowledgments
References
1. Brasil, D. S. B.; Alves, C. N.; Guilhon, G. M. S. P.; Müller, A. H.; Secco, R. de S.; Peris, G.; Llusar, R.; Int. J. Quantum Chem. 2008,108, 2564; Brasil, D. S. B.; Müller, A. H.; Guilhon, G. M. S. P.; Alves, C. N.; Andrade, E. H. A.; da Silva, J. K. R.; Maia, J. G. S.; J. Braz. Chem. Soc. 2009, 20, 1188.
2. Müller, A. H.; Oster, B.; Schukmann, W. K.; Bartl, H.; Phytochemistry 1986, 25, 1415.
3. Dadoun, H.; Müller, A. H.; Cesario, M.; Guilhem, J.; Pascard, C.; Phytochemistry 1987, 26, 2108.
4. Hiruma-Lima, C. A.; Gracioso, J. S.; Toma, W.; Almeida, A. B.; Paula, A. C. B.; Brasil, D. S. B.; Müller, A. H.; Souza Brito, A. R. M.; Phytomedicine 2001, 8, 94.
5. Hiruma-Lima, C. A.; Gracioso, J. S.; Toma, W.; Paula, A. C. B; Almeida, A. B. A.; Brasil, D. S. B.; Müller, A. H.; Souza Brito, A. R. M.; Biol. Pharm. Bull. 2000, 23, 1465.
6. Salatino, A.; Salatino, M. L. F.; Negri, G.;J. Braz. Chem. Soc. 2007, 18, 11; Sandoval, M.; Ayala, S.; Oré, M.; Valdivieso, L.; Loli, R.; Ricra, V; Huaman, O.; An. Fac. Med. Lima 2005, 66, 119; Sandoval, M.; Ayala, S.; Oré, R.; Arroyo, J.; An. Fac. Med. Lima 2002, 63, 251; Ayala, S.; Jurupe, H.; Díaz, D.; Lock, O.; Vega, M.; Luque, J.; Garnique, M.; An. Fac. Med. Lima 2001, 62, 317; Ayala, S.; Díaz, D.; Palomino, M.; Armas, S.; Paz, J.; An. Fac. Med. Lima 1999, 60, 22; Ayala, S.; Jurupe, H.; Díaz, D.; Oré, R.; Cárdenas, W.; Espejo, L.; Rev. Situa 2000, 8, 12; Sandoval, M.; Ayala, S.; Oré, R.; Loli, A.; Huaman, O.; Valdivieso, R.; Béjar, E.; An. Fac. Med. Lima 2006, 67, 199; Sandoval, M.; Okuhama, N. N.; Clark, M.; Angeles, F. M.; Lao, J.; Bustamante, S.; Miller, M. J. S.; J. Ethnopharmacol. 2002, 80, 121.
7. Perdue, G. P.; Blomster, R. N.; Blake, D. A.; Farnsworth, N. R.; J. Pharm. Sci. 1979, 68,124.
8. Pieters, L. A. C.; Vanden Berghe, D. A.; Vlietinck, A. J.; Phytochemistry 1990, 29, 348.
9. Pieters, L.; De Bruyne, T.; Claeys, M.; Vlietinck, A.; Calomme, M.; Vanden Berghe, D.; J. Nat. Prod. 1993, 56, 899.
10. Cai, Y.; Evans, F. J.; Roberts, M. F.; Phillipson, J. D.; Zenk, M. H.; Gleba, Y. Y.; Phytochemistry 1991, 30, 2033.
11. Lorentzon, P.; Bayati, A.; Lee, H.; Andersen, K.; Ann. NY Acad. Sci. 1997, 834, 592.
12. Sachs, G.; Shin, J. M.; Briving, C.; Wallmark, B.; Hersey, S.; Annu. Rev. Pharmacol. Toxicol. 1995, 35, 277.
13. Kubota, T.; Tetrahedron 1958, 4, 68.
14. McChesney, J. D.; Silveira, E. R.; Phytochemistry 1989, 28, 3411.
15. De Araujo-Junior, V. T.; Navarro, P. A.; Silva, M. S.; Da-Cunha, E. V. L.; De Fatima Agra, M.; Gray, A. I.; Barbosa-Filho, J. M.; Ciencia (Maracaibo, Venezuela) 2002, 10, 286.
16. Palmeira-Junior, S. F.; Conserva, L. M.; Silveira, E. R.; J. Braz. Chem. Soc. 2005, 16, 1420.
17. Mambu, L.; Ramanandraibe, V.; Martin, M. T.; Blond, A.; Grellier, P.; Frappier, F.; Planta Med. 2002, 68, 377.
18. Faulkner, D. F.; Lebby, V.; Waterman, P. G.; Planta Med. 1985, 51, 354.
19. Konishi, T.; Azuma, M.; Itoga, R.; Kiyosawa, S.; Fujiwara, Y.; Shimada, Y.; Chem. Pharm. Bull. 1996, 44, 229.
20. Alves, C. N.; Da Silva, A. B. F.; Castilho, M.; Mazo, L. H.; Tabak, M.; Chem. Phys. Lett. 2001, 349, 146; Domingo, L. R.; Andres, J.; Alves, C. N.; Eur. J. Org. Chem. 2002, 15, 2557. 21. Lamotte-Brasseur, J.; Dive, G.; Dehareng, D.; Ghuysen, J. M.;
J. Theor. Biol. 1990, 145, 183.
22. Leong, Y.-W.; Harrison, L. J.; Phytochemistry 1997, 45, 1457. 23. Addae-Mensah, I.; Achenbach, H.; Thoithi, G. N.; Waibel, R.;
Mwangi, J. W.; Phytochemistry 1992, 31, 2055.
24. Nes, W. D.; Norton, R. A.; Benson, M.; Phytochemistry 1992, 31, 805.
25. De-Eknamkul, W.; Potduang, B.; Phytochemistry 2003, 62, 389. 26. Zhao, Y-X.; Li, C-S.; Luo, X-D.; Yi, T-M.; Zhou, J.; Chin.
J. Org. Chem. 2005, 25, 1100.
27. Greca, M. D.; Monaco, P.; Previtera, L.; J. Nat. Prod. 1990,53, 1430.
28. Asha, K. N.; Chowdhury, R.; Hasan, C. M.; Rashid, M. A.; Acta Pharm. 2004, 54, 57.
29. Almeida, M. L. S.; Kocovský, P.; Bäckvall, J-E.; J. Org. Chem. 1996, 61, 6587; Shu, Y.; Jones, S. R.; Kinney, W. A.; Selinsky, B. S.; Steroids 2002, 67, 291.
30. Olea, R. S. G.; Roque, N. F.; Quim. Nova 1990, 13, 278. 31. Barla, A.; Birman, H.; Kultur, S.; Oksuz, S.; Turk. J. Chem.
2006, 30, 325; Jayasinghe, U. L. B.; Vithana, H. S. K.; Wannigama, G. P.; Fujimoto, Y.; Fitoterapia 2001, 72, 594. 32. Ahmad, V. U.; Rahman, A. U.; Pentacyclic Triterpenoids,
Handbook of Natural Products Data, Elsevier: Amsterdam, vol. 2, 1994.
33. Hou, Z-F.; Xie, Z-X.; Tu, Y-Q.; Li, Y.; Indian J. Chem., Sect. B: Org. Chem. Incl. Med. Chem. 2002, 41, 234.
34. SAINT version 6.26 A. Bruker Analytical X-ray Systems: Madison, WI.
35. Sheldrick, G. M. SADABS empirical absorption program, V 2.03, University of Gottingen, 1996.
36. Brasil, D. S. B.; Moreira, R. Y. O.; Müller, A. H.; Alves, C. N.; Int. J. Quantum Chem. 2006, 106, 2706.
37. Bagno, A.; Rastrelli, F.; Saielli, G.; Chem.-A Eur. J. 2006, 12, 5514.
38. Moreira, R. Y. O.; Brasil, D. S. B.; Alves, C. N.; Guilhon, G. M. S. P.; Santos, L. S.; Arruda, M. S. P.; Müller, A. H.; Barbosa, P. S.; Abreu, A. S.; Silva, E. O.; Rumjanek, V. M.; Souza, J. Jr.; Silva, A. B. F.; Santos, R. H. A.; Int. J. Quantum Chem. 2008, 108, 513. 39. Becke, A. D.; J. Chem. Phys. 1993, 98, 5648; Lee, C.; Yang,
W.; Parr, R. G.; Phys. Rev. B 1988, 37, 785.
T.; Kudin, K. N.; Burant, J. C.; Millam, J. M.; Iyengar, S. S.; Tomasi, J.; Barone, V.; Mennucci, B.; Cossi, M.; Scalmani, G.; Rega, N.; Petersson, G. A.; Nakatsuji, H.; Hada, M.; Ehara, M.; Toyota, K.; Fukuda, R.; Hasegawa, J.; Ishida, M.; Nakajima, T.; Honda, Y.; Kitao, O.; Nakai, H.; Klene, M.; Li, X.; Knox, J. E.; Hratchian, H. P.; Cross, J. B.; Adamo, C.; Jaramillo, J.; Gomperts, R.; Stratmann, R. E.; Yazyev, O.; Austin, A. J.; Cammi, R.; Pomelli, C.; Ochterski, J. W.; Ayala, P. Y.; Morokuma, K.; Voth, G. A.; Salvador, P.; Dannenberg, J. J.; Zakrzewski, V. G.; Dapprich, S.; Daniels, A. D.; Strain, M. C.; Farkas, O.; Malick, D. K.; Rabuck, A. D.; Raghavachari, K.; Foresman, J. B.; Ortiz, J. V.; Cui, Q.; Baboul, A. G.; Clifford, S.;
Cioslowski, J.; Stefanov, B. B.; Liu, G.; Liashenko, A.; Piskorz, P.; Komaromi, I.; Martin, R. L.; Fox, D. J.; Keith, T.; Al-Laham, M. A.; Peng, C. Y.; Nanayakkara, A.; Challacombe, M.; Gill, P. M. W.; Johnson, B.; Chen, W.; Wong, M. W.; Gonzalez, C.; Pople, J. A.; Gaussian 03, Revision B.04. Gaussian: Pittsburgh, PA, 2003.
41. HyperChem™ Release 7.5 for Windows Molecular Modeling System. Hypercube: Gainesville, USA, 2002.
42. MINITAB Release 14 for Windows. Minitab: State College, PA, 2003.
43. PC Spartan-Pro, version 1.0; Wavefunction, Inc.: Irvine, CA, USA, 1999.
Received: October 9, 2008
Supplementary Information
0103 - 5053 $6.00+0.00
*e-mail: [email protected], [email protected]
Isolation, X-ray Crystal Structure and Theoretical Calculations of the New
Compound 8-epicordatin and Identiication of Others Terpenes and Steroids from
the Bark and Leaves of
Croton palanostigma
Klotzsch
Davi S. B. Brasil,a,b Adolfo H. Müller,*,a,c Gisele M. S. P. Guilhon,a Cláudio N. Alves,a
Gabriel Peris,d Rosa Llusard and Vicent Molinerd
aInstituto de Ciências Exatas e Naturais, Universidade Federal do Pará, Av. Augusto Corrêa, 01,
66075-900 Belém-PA, Brazil
bFaculdade de Engenharia Química, Instituto de Tecnologia, Universidade Federal do Pará,
Av. Augusto Corrêa, 01, 66075-900 Belém-PA, Brazil
cCentro Universitário do Estado do Pará, Av Nazaré, 630, 66035-170 Belém-PA, Brazil
dDepartament de Química Física i Analítica, Universitat Jaume I, 12071, Castellón, Spain
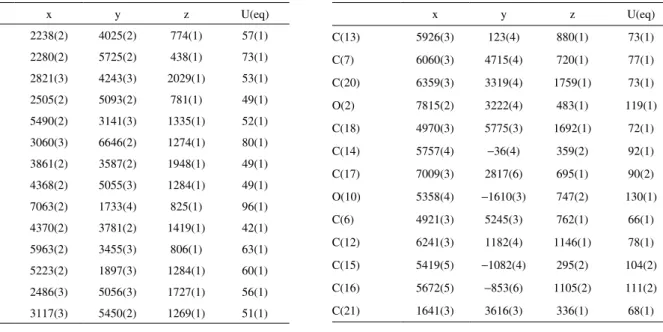
Table S1. Atomic coordinates (x 104) and equivalent isotropic displacement parameters (Å2x 10³) for 2 U(eq) is deined as one third of the trace of the orthogonalized Uij tensor
x y z U(eq)
C(13) 5926(3) 123(4) 880(1) 73(1)
C(7) 6060(3) 4715(4) 720(1) 77(1)
C(20) 6359(3) 3319(4) 1759(1) 73(1)
O(2) 7815(2) 3222(4) 483(1) 119(1)
C(18) 4970(3) 5775(3) 1692(1) 72(1)
C(14) 5757(4) −36(4) 359(2) 92(1)
C(17) 7009(3) 2817(6) 695(1) 90(2)
O(10) 5358(4) −1610(3) 747(2) 130(1)
C(6) 4921(3) 5245(3) 762(1) 66(1)
C(12) 6241(3) 1182(4) 1146(1) 78(1)
C(15) 5419(5) −1082(4) 295(2) 104(2)
C(16) 5672(5) −853(6) 1105(2) 111(2)
C(21) 1641(3) 3616(3) 336(1) 68(1)
x y z U(eq)
O(4) 2238(2) 4025(2) 774(1) 57(1)
O(5) 2280(2) 5725(2) 438(1) 73(1) C(2) 2821(3) 4243(3) 2029(1) 53(1) C(19) 2505(2) 5093(2) 781(1) 49(1)
C(9) 5490(2) 3141(3) 1335(1) 52(1) O(6) 3060(3) 6646(2) 1274(1) 80(1) C(1) 3861(2) 3587(2) 1948(1) 49(1)
C(5) 4368(2) 5055(3) 1284(1) 49(1) O(1) 7063(2) 1733(4) 825(1) 96(1)
C(10) 4370(2) 3781(2) 1419(1) 42(1) C(8) 5963(2) 3455(3) 806(1) 63(1) C(11) 5223(2) 1897(3) 1284(1) 60(1)
Table S2. Bond lengths [Å] and angles [°] for 2
O(4)-C(19) 1.317(4) C(20)-C(9)-C(10) 114.2(2)
O(4)-C(21) 1.437(3) C(8)-C(9)-C(10) 108.9(2)
O(5)-C(19) 1.205(3) C(2)-C(1)-C(10) 112.4(2)
C(2)-C(3) 1.315(4) C(6)-C(5)-C(18) 109.3(2)
C(2)-C(1) 1.486(4) C(6)-C(5)-C(10) 110.2(3)
C(19)-C(4) 1.533(4) C(18)-C(5)-C(10) 112.6(2)
C(9)-C(11) 1.528(5) C(6)-C(5)-C(4) 110.1(2)
C(9)-C(20) 1.536(4) C(18)-C(5)-C(4) 107.1(3)
C(9)-C(8) 1.541(4) C(10)-C(5)-C(4) 107.5(2)
C(9)-C(10) 1.558(4) C(17)-O(1)-C(12) 123.5(3)
O(6)-C(4) 1.432(4) C(1)-C(10)-C(9) 113.3(2)
C(1)-C(10) 1.530(3) C(1)-C(10)-C(5) 110.6(2)
C(5)-C(6) 1.535(4) C(9)-C(10)-C(5) 116.6(2)
C(5)-C(18) 1.549(4) C(17)-C(8)-C(7) 114.3(3)
C(5)-C(10) 1.565(4) C(17)-C(8)-C(9) 111.0(3)
C(5)-C(4) 1.570(4) C(7)-C(8)-C(9) 113.6(3)
O(1)-C(17) 1.344(6) C(9)-C(11)-C(12) 113.4(3)
O(1)-C(12) 1.451(5) C(2)-C(3)-C(4) 124.1(3)
C(8)-C(17) 1.493(6) O(6)-C(4)-C(3) 106.5(3)
C(8)-C(7) 1.529(6) O(6)-C(4)-C(19) 105.3(2)
C(11)-C(12) 1.531(5) C(3)-C(4)-C(19) 109.9(2)
C(3)-C(4) 1.494(4) O(6)-C(4)-C(5) 110.2(2)
C(13)-C(16) 1.342(7) C(3)-C(4)-C(5) 111.5(2)
C(13)-C(14) 1.393(6) C(19)-C(4)-C(5) 113.1(2)
C(13)-C(12) 1.494(6) C(16)-C(13)-C(14) 106.1(5)
C(7)-C(6) 1.507(6) C(16)-C(13)-C(12) 126.3(4)
O(2)-C(17) 1.214(5) C(14)-C(13)-C(12) 127.5(4)
C(14)-C(15) 1.326(7) C(6)-C(7)-C(8) 109.6(3)
O(10)-C(15) 1.342(7) C(15)-C(14)-C(13) 107.3(4)
O(10)-C(16) 1.356(7) O(2)-C(17)-O(1) 117.6(4)
C(19)-O(4)-C(21) 117.5(2) O(2)-C(17)-C(8) 123.5(6)
C(3)-C(2)-C(1) 124.1(3) O(1)-C(17)-C(8) 118.9(4)
O(5)-C(19)-O(4) 123.0(3) C(15)-O(10)-C(16) 106.3(4)
O(5)-C(19)-C(4) 123.6(3) C(7)-C(6)-C(5) 113.1(3)
O(4)-C(19)-C(4) 113.4(2) O(1)-C(12)-C(13) 106.6(3)
C(11)-C(9)-C(20) 109.8(3) O(1)-C(12)-C(11) 115.0(4)
C(11)-C(9)-C(8) 103.6(2) C(13)-C(12)-C(11) 112.5(3)
C(20)-C(9)-C(8) 111.5(2) C(14)-C(15)-O(10) 110.4(5)
C(11)-C(9)-C(10) 108.1(2) C(13)-C(16)-O(10) 109.9(4)
Table S3. Anisotropic displacement parameters (Å2x 10³) for 2. The anisotropic displacement factor exponent takes the form: −2π2[h2 a*2U11 + ... + 2 h k a* b* U12 ]
U11 U22 U33 U23 U13 U12 O(4) 69(1) 50(1) 53(1) 3(1) −18(1) −9(1)
O(5) 95(2) 63(1) 61(1) 13(1) −22(1) −3(1) C(2) 60(2) 60(2) 37(1) −7(1) 13(1) 3(1) C(19) 54(2) 51(2) 43(1) 3(1) 1(1) −1(1)
C(9) 33(1) 88(2) 35(1) −9(1) −1(1) −5(1) O(6) 123(2) 44(1) 73(1) −6(1) −14(2) −7(1)
C(1) 49(2) 57(2) 40(1) 3(1) 8(1) 0(1) C(5) 53(2) 59(2) 35(1) −1(1) −1(1) −20(1) O(1) 41(1) 150(3) 96(2) −35(2) 12(1) 15(2)
C(10) 35(1) 59(2) 32(1) −3(1) 1(1) -6(1) C(8) 39(2) 114(3) 36(1) −12(2) 3(1) −19(2)
C(11) 39(2) 87(2) 53(2) −9(2) 0(1) 13(2) C(3) 62(2) 64(2) 41(1) −8(1) 5(1) 10(2) C(4) 67(2) 42(2) 45(1) −3(1) −4(1) −6(1)
C(13) 62(2) 97(3) 58(2) 11(2) 5(2) 47(2) C(7) 59(2) 128(3) 44(2) 3(2) 8(2) −39(2) C(20) 42(2) 134(3) 44(2) −10(2) −7(1) −7(2)
O(2) 55(2) 211(4) 92(2) −36(2) 37(2) −28(2) C(18) 89(3) 78(2) 48(2) −8(2) −5(2) −39(2)
C(14) 118(4) 82(3) 77(3) 8(2) 0(2) 32(3) C(17) 47(2) 173(5) 52(2) −38(3) 11(2) −4(3) O(10) 149(3) 99(3) 142(3) 26(3) 40(3) 40(2)
C(6) 69(2) 82(2) 46(2) 7(2) 4(2) −33(2) C(12) 49(2) 129(4) 57(2) −8(2) −4(2) 34(2)
C(15) 133(4) 69(3) 111(4) −17(3) −10(3) 28(3) C(16) 118(4) 125(4) 89(3) 27(3) 33(3) 52(3) C(21) 73(2) 68(2) 62(2) −4(2) −24(2) −11(2)
Table S4. Hydrogen coordinates (x 104) and isotropic displacement parameters (Å2 x 10³) for 2
x y z U(eq)
H(2) 2379 4068 2310 63
H(6) 2917 6874 986 120
H(1A) 3696 2798 1989 59
H(1B) 4404 3792 2207 59
H(10) 3841 3439 1180 50
H(8) 5411 3191 557 75
H(11A) 4656 1800 1023 72
H(11B) 4914 1631 1604 72
H(3) 1813 5408 1804 67
H(7A) 6558 5037 973 92
H(7B) 6371 4859 384 92
H(20A) 6035 3130 2083 110
H(20B) 6590 4087 1762 110
H(20C) 6996 2850 1697 110
H(18A) 5725 5516 1732 108
H(18B) 4583 5712 2012 108
H(18C) 4976 6542 1584 108
H(14) 5861 494 103 111
H(6A) 4441 4940 497 79
H(6B) 4990 6042 702 79
H(12) 6613 977 1466 94
H(15) 5248 -1405 -19 125
H(16) 5705 -991 1454 133
H(21A) 941 4001 306 102
H(21B) 1507 2829 374 102
Table S5. Theoretical and Experimental NMR Chemical Shifts for 2
Position
8-epi-cordatin (2) calculateda
8-epi-cordatin (2) experimental
dC dH dC dH
1 28.0 1.95 22.9 2.1
2 137.6 6.14 130.0 5.95
3 139.5 5.71 128.7 5.36
4 88.8 81.2
5 46.7 40.5
6 37.0 α - 1.87
β -0.71 33.2
α - 1.86
β -0.91
7 22.5 α - 1.43
β -2.22 18.1
α - 1.60
β -2.10
8 57.7 1.90 51.4 2.07
9 40.7 36.4
10 50.1 2.28 44.7 2.33
11 51.3 α - 1.79
β - 1.54 44.4
α - 2.29
β - 1.67
12 77.0 5.26 71.9 5.48
13 131.5 125.8
14 113.2 6.57 108.5 6.41
15 149.5 7.45 143.7 7.41
16 146.4 7.26 139.3 7.44
17 177.1 171.9
18 17.5 1.15 15.2 1.12
19 187.7 175.5
20 18.7 1.04 15.4 1.17
21 59.4 3.66 53.2 3.81
a NMR chemical shifts calculated at B3PW91/DGDZVP.
Table S6. Predicted, calculated and Experimental 1H NMR coupling constant [nJ(H-H)] (Hz) for 2
Coupling experimental B3PW91/ DGDZVP
Predicteda
2 - 1α 2.9 3.2 2.9
2 - 1β 4.6 5.3 4.8
2 - 3 10 10.5 9.7
3 - 1α 1.8 4.5 4.2
3 - 1β 2.5 3.2 2.9
6α - 6β 13.3 16.5 15.3
6α - 7α 2.7 3.2 2.9
6α - 7β 2.7 3.2 2.9
6β - 7α 13.3 12.7 11.7
6β - 7α 3.0 4.1 3.8
10 - 1α 11.0 10.4 9.6
10 - 1β 5.2 5.2 4.8
11α - 11β 13.6 16.2 15.0
11α - 12 5.4 4.8 4.4
12 - 11β 11.7 12.1 11.2
14 - 15 1.9 1.4 1.3
14 - 16 0.9 0.1 0.0
15 - 16 1.9 0.9 0.8
aPredicted after linear regression using the equation: J
Figure S1. B3LYP/6-31G(d,p) optimized structure of 2.
Figure S2. 1H NMR (300 MHz, CDCl
Figure S3. 13C NMR (75.4 MHz, CDCl
3) of the new compound 2.
Figure S5. 1H, 1H- COSY spectrum of the new compound 2.
Figure S7. COLOC spectrum of the new compound 2.

![Table S2. Bond lengths [Å] and angles [°] for 2 O(4)-C(19) 1.317(4) C(20)-C(9)-C(10) 114.2(2) O(4)-C(21) 1.437(3) C(8)-C(9)-C(10) 108.9(2) O(5)-C(19) 1.205(3) C(2)-C(1)-C(10) 112.4(2) C(2)-C(3) 1.315(4) C(6)-C(5)-C(18) 109.3(2) C(2)-C(1) 1.486(4)](https://thumb-eu.123doks.com/thumbv2/123dok_br/18994583.461789/11.892.67.803.129.966/table-s-bond-lengths-å-angles-o-c.webp)

![Table S6. Predicted, calculated and Experimental 1 H NMR coupling constant [ n J(H-H)] (Hz) for 2 Coupling experimental B3PW91/ DGDZVP Predicted a 2 - 1α 2.9 3.2 2.9 2 - 1β 4.6 5.3 4.8 2 - 3 10 10.5 9.7 3 - 1α 1.8 4.5 4.2 3 - 1β 2.5 3.2 2.9 6α - 6](https://thumb-eu.123doks.com/thumbv2/123dok_br/18994583.461789/13.892.68.418.145.692/predicted-calculated-experimental-coupling-constant-coupling-experimental-predicted.webp)

