0103 - 5053 $6.00+0.00
Article
*e-mail: [email protected]
# This name is an homage to Professor Raimundo Braz-Filho. This article
was submitted to the special issue dedicated to Professor Raimundo Braz-Filho on the occasion of his 70th birthday.
NMR Structural Analysis of
#Braznitidumine: A New Indole Alkaloid with
1,2,9-Triazabicyclo[7.2.1] System, Isolated from
Aspidosperma nitidum
(Apocynaceae)
Maria M. Pereira,a,bAntônio Flávio de C. Alcântara,b,c Dorila Piló-Veloso*,b and Délio S. Raslanb
a
Departamento de Medicamentos e Alimentos, Faculdade de Farmácia, Universidade Federal do Amazonas, 69010-300 Manaus-AM, Brazil
b
Departamento de Química, ICEx, Universidade Federal de Minas Gerais, 31270-901 Belo Horizonte-MG, Brazil
c
Departamento de Química, ICE, Universidade Federal do Amazonas, 69077-000 Manaus-AM, Brazil
O estudo fitoquímico das cascas do cerne de Aspidosperma nitidum permitiu o isolamento de um novo tipo de alcalóide indólico, contendo um sistema 1,2,9-triazabiciclo[7.2.1], que foi denominado braznitidumina 1. A caracterização de sua estrutura química foi realizada pela
análises dos dados de IV, UV, ESI-EM e RMN de 1H, 13C e 15N, empregando experimentos 1D e 2D (1H 1H COSY, 1H 1H NOESY, 1H 13C HSQC e 1H 13C HMBC). Pela análise do experimento 1H 1H NOESY, verificou-se que 1 apresenta uma conformação dobrada com aproximação entre os grupos indólico e imidazolidino-di-hidropirano. Essa configuração foi investigada por cálculos teóricos envolvendo otimizações de geometria (DFT/BLYP/6-31G*) para análise conformacional desse alcalóide, pela qual a distância entre os dois grupos mostrou-se compatível com as informações obtidas pelo experimento NOESY.
The phytochemical study of the stem bark of Aspidosperma nitidum led to the isolation of a new type of indole alkaloid with a 1,2,9-triazabicyclo[7.2.1] system, which has been called braznitidumine 1. The characterization of its chemical structure was carried out by IR, UV, ESIMS, and 1H, 13C, and 15N NMR by using 1D and 2D (1H 1H COSY, 1H 1H NOESY, 1H 13C HSQC and 1H 13C HMBC) experiments. 1H 1H NOESY results showed that 1 presents a folded conformation with the approximation of the indole and the imidazolidine di-hydropyran groups. This configuration was investigated by theoretical calculations involving geometry optimization (DFT/BLYP/6-31G*) for the conformational analysis of this alkaloid. It confirmed the distance between the two groups in agreement with the NOESY experimental data.
Keywords: Apocynaceae, Aspidosperma nitidum, indole alkaloid, 1,2,9-triazabicyclo[7.2.1] system
Introduction
The Aspidosperma Mart. (Apocinaceae) genus is native
to Americas and is found from Mexico to Argentina.1 The
literature reports the presence of alkaloids in species of this genus, mainly indole ones.2 Aspidosperma nitidum,
popularly known as carapanaúba, is widely distributed
in the Amazonas State, Brazil. The stem barks of this species are largely employed in folk medicine as a contraceptive, antimalarial, antiinflammatory (uterus and ovary), anticarcinogenic, antidiabetic, antileprosy, and for stomach upsets.3 Nevertheless, just one report has been
found in literature on its chemical components.4 In that
work the only reported alkaloid from this species was 10-methoxydihydrocorynantheol.
In this paper, we report the results of the phytochemical study of the Aspidosperma nitidum species. From the
ethanolic extract was isolated the indole alkaloid (1) named
braznitidumine, which has a very interesting bridged chemical structure containing a 1,2,9-triazabicyclo[7.2.1] system. The structure was determined by means of spectroscopic techniques, mainly ESIMS, IR and 1D and 2D NMR spectra.
Results and Discussion
Purification of the stem bark ethanol extract of
1275 Pereira et al.
Vol. 17, No. 7, 2006
chromatography resulted in the isolation of the new indole alkaloid (1). Its molecular formula, C24H32N4O6, was
deduced from the precisely determined mass of the molecular ion peak [M+] at m/z 472.682 in the positive
mode ESIMS. This molecular formula has 11 degrees of unsaturations, which is in agreement with 1H (1D and 2D
COSY), 13C (1D and 2D HSQC, HMBC) NMR spectral
data. 1D 1H and 13C ({1H} and DEPT) and 2D (1H 13C
HSQC, 1H 15N HSQC, 1H 13C HMBC, 1H 15N HMBC) NMR
experiments led to the elucidation of a very interesting new indole alkaloid, name braznitidumine, as yet unreported in the literature.
A NH and a conjugated carbonyl group were identified by absorption bands at 3430 and 1697 cm-1, respectively,
observed in the IR spectrum of 1.5 The UV spectral data
of 1 in methanol, λ
max 208.80, 217.37, 272.20, and 305.50
nm,were characteristic of indole systems.6
Tables 1 and 2 show 1H, 13C, and 15N NMR data of
compound 1. The 1H NMR spectrum showed most of the
hydrogen resonance as unresolved broad signals (290 to 300 K). This spectrum revealed the presence of an indole group by singlets at δH 7.01 (H-9) and 6.90 (H-6), which
show correlations in the 1H 13C HSQC with the 13C signals
at δC 101.1 (C-9) and 95.4 (C-6), respectively. It also
displayed long range correlations in the 1H 13C HMBC of
the signal at δH 7.01 with the 13C signals at δC 95.4 (C-6),
102.1 (C-9b), 130.8 (C-5a), and 146.9 (C-7); of the signal at δH 6.90 with the 13C signals at δC 101.1 (C-9), 118.2
(C-9a), and 144.6 (C-8); of the signal at δH 3.76, relative to six hydrogens of methoxyl groups (7 and MeO-8), with the 13C signals at δ
C 95.4 (C-6), 101.1 (C-9), 144.6
(C-8), and 146.9 (C-7) (Figure 1). These last correlations indicate the phenyl moiety of an indole group, with two
orto methoxyl substituents. The 1H NMR spectrum also
shows a singlet at δH 11.13 (H-5), which is not correlated to any signal either by 1H 1H COSY or 1H 13C HSQC, but
that is correlated with the 15N signal at δ
N 127.4 (N-5) by 1H 15N HSQC. Through these last data, it was identified
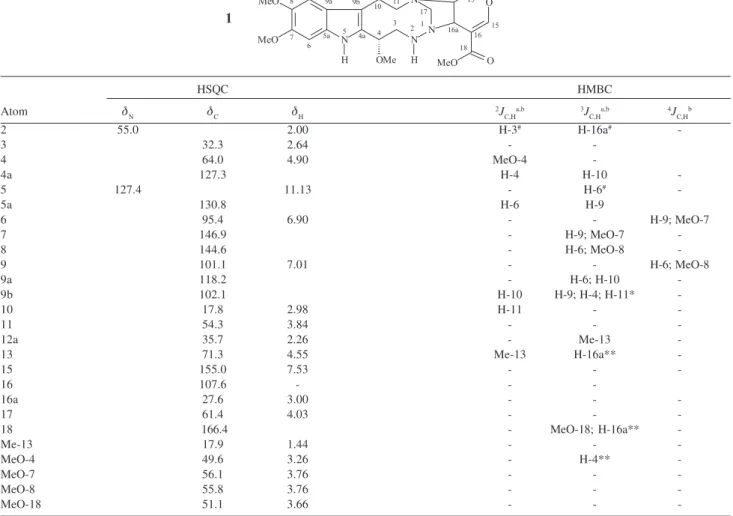
Table 1.1H (400 MHz), 13C (100 MHz), and 15N (40.55 MHz) NMR data (including 1H 15N and 1H 13C HSQC and 1H 13C HMBC correlations) of braznitidumine
(1) in DMSO-d6
HSQC HMBC
Atom δN δC δH 2J
C,Ha,b 3JC,Ha,b 4JC,Hb
2 55.0 2.00 H-3# H-16a#
-3 32.3 2.64 -
-4 64.0 4.90 MeO-4
-4a 127.3 H-4 H-10
-5 127.4 11.13 - H-6#
-5a 130.8 H-6 H-9
6 95.4 6.90 - - H-9; MeO-7
7 146.9 - H-9; MeO-7
-8 144.6 - H-6; MeO-8
-9 101.1 7.01 - - H-6; MeO-8
9a 118.2 - H-6; H-10
-9b 102.1 H-10 H-9; H-4; H-11*
-10 17.8 2.98 H-11 -
-11 54.3 3.84 - -
-12a 35.7 2.26 - Me-13
-13 71.3 4.55 Me-13 H-16a**
-15 155.0 7.53 - -
-16 107.6 - -
-16a 27.6 3.00 - -
-17 61.4 4.03 - -
-18 166.4 - MeO-18; H-16a**
-Me-13 17.9 1.44 - -
-MeO-4 49.6 3.26 - H-4**
-MeO-7 56.1 3.76 - -
-MeO-8 55.8 3.76 - -
-MeO-18 51.1 3.66 - -
an NH by the indole group. Finally, a correlation was observed of the 1H signal at δ
H 6.90 (H-6) with the 15N
signal at δN 127.4 (N-5) by 1H 15N HMBC.
The connectivity of the indole group with the rest of the molecule was deduced from the following 1H 13C
HMBC correlations: the signal at δH 2.98 (H-10) with the
13C signals at δ
C 102.1 (C-9b) via2J, 127.3 (C-4a) via3J,
and 118.2 (C-9a) via3J; the signal at δ
H 3.84 (H-11) with
the 13C signal at δ
C 102.1 (C-9b) via 3J; the signal at δH
4.90 (H-4) with the 13C signals at δ
C 102.1 (C-9b) via3J
and 127.3 (C-4a) via2J.
The homonuclear spin-spin couplings of H-10 with H-11 and of H-4 with both hydrogens having signals at
δH 2.00 (H-2) and 2.64 (H-3) were revealed by 2D 1H 1H
COSY and so was the coupling between H-2 and H-3. Other 1H 13C HSQC correlations were observed: H-3 with
the 13C signal at δ
C 32.3 (C-3); H-10 with the 13C signal
at δC 17.8 (C-10); H-11 with the 13C signal at δ
C 54.3
(C-11); H-4 with the 13C signal at δ
C 64.0 (C-4). No HSQC
correlation was observed to the H-2 signal. In addition,
1H 13C HMBC long range 2J and 3J correlations were
observed for the H-11 signal and the MeO-4 signal at δH
3.26 with the 13C signals at δ
C 17.8 10) and 64.0
(C-4), respectively. 1H 15N HSQC shows correlation of the 1H signal at δ
H 2.00 (H-2) with the 15N signal at δN 55.0
(N-2), which shows long range correlations with the signals at δH 2.64 (H-3), 3.00 (H-16a), and 3.26 (MeO-4) in 1H 15N HMBC.
Some broad and relatively very small signals characteristic of nitrogen-bonded aliphatic carbons7 were
observed in the 13C NMR spectrum at δ
C 27.6 (CH-16a),
32.3 (CH2-3), 35.7 (CH-12a), 54.3 (CH2-11), and 61.4 (CH2-17). The 1H 13C HMQC and 1H 13C HSQC
experi-ments confirmed these signals were due to hydrogenated carbons.
The substituted indole fragment shown in Figure 1 was inferred from all the data discussed above. In this fragment, the proximity of the NH indole and the oxygen of MeO-4 may lead to the formation of a hydrogen bond and thus explain the deshielding at δH 11.13 observed for H-5.
In addition, the combination of 1H and 13C NMR data
with the IR spectrum revealed a molecular fragment of dihydropyran methyl ester (Figure 2). All the three signals of both non-hydrogenated 13C at δ
C 107.6 (C-16) and 166.4
(C-18) as well as the one of 13C at δ
C 155.0 (C-15), show
correlations by 1H 13C HSQC with the 1H signal at δ
H 7.53
(H-15), and are therefore compatible with the conjugated carbonyl system deduced from the IR spectrum. The 1H
signals at δH 3.66 (MeO-18) and at δH 3.00 (H-16a) are both correlated with the carbonyl 13C signal at δ
C 166.4
Table 2.1H (400 MHz) NMR data (including 1H 1H COSY and 1H 1H NOESY correlations) of braznitidumine (1) in DMSO-d
6
Atom δH (multiplicity) 1H 1H COSY 1H 1H NOESY
Experiment 1a Experiment 2b
2 2.00 (b) H-3; H-4; H-16a H-16a
3 2.64 (bd, J 15.0 Hz) H-2; H-4 H-4; H-10 H-5; H-10
4 4.90 (dd, J 7.5 and 2.0 Hz) H-2; H-3 H-3; MeO-4 H-5; MeO-4; MeO-18
5 11.13 (b) H-3; H-4; H-6; MeO-18
6 6.90 (s) H-5; MeO-7; MeO-18
9 7.01 (s) MeO-8
10 2.98 (b) H-11 H-3 H-3
11 3.84 (m) H-10 Me-13
12a 2.26 (b) H-13; H-17; H-16a Me-13; MeO-4
13 4.55 (m) H-12a; Me-13 Me-13 Me-13; MeO-18
15 7.53 (s) MeO-18
16a 3.00 (b) H-12a; H-2 H-2
17 4.03 (b) H-12a MeO-4
Me-13 1.44 (d, J 5.8 Hz) H-13 H-13 H-12a; H-11; H-13
MeO-4 3.26 (s) H-4; H-17 H-4; H-12a
MeO-7 3.76 (s) H-6
MeO-8 3.76 (s) H-9
MeO-18 3.66 (s) H-4; H-5; H-6; H-13; H-15
1277 Pereira et al.
Vol. 17, No. 7, 2006
(C-18) in 1H 13C HMBC. On the other hand, H-16a is
correlated with the nitrogenated 13C signal at δ
C 27.6
(C-16a) in 1H 13C HSQC and with the 13C signal at δ
C 71.3
(C-13) in 1H 13C HMBC. H-16a is coupled with a hydrogen
with a signal at δH 2.26 (H-12a) in 1H 1H COSY (Table 2).
The latter shows spin-spin coupling with hydrogens presenting signals at δH 4.55 (H-13) and 4.03 (H-17) in 1H 1H COSY and it correlates with the nitrogenated 13C signal
at δC 35.7 (C-12a) in 1H 13C HSQC. The spin-spin coupling
between H-12a and H-17 is weak and is only detected by
1H 1H COSY, possibly due to a W 4J coupling.
The methyl signal at δH 1.44 (Me-13), which is correlated with the 13C signal at δ
C 17.9 (Me-13) in 1H 13C HSQC, is
correlated with the signal at δH 4.55 (H-13) in 1H 1H COSY
and with the 13C signal at δ
C 35.7 (C-12a) in 1H 13C HMBC.
Finally, in 1H 13C HSQC, the 13C signal at δ
C 61.4 (C-17) is
correlated with the signal at δH 4.03 and so must be the
remaining of the cited aliphatic nitrogenated CH2 detected in the DEPT experiment. As its attached hydrogen shows weak coupling with H-12a in the 1H 1H COSY and also
because of its chemical shift, this CH2 group is thought to be linked to two nitrogen atoms in a fused 5-6 ring system, i.e.
a substituted fused imidazolidine-pyran system fragment of
1, as shown in Figure 2. The literature reports some other
indole alkaloids isolated from Aspidosperma species as
isomitrafiliane, 3-isoajamalicine, mitrafiline, and isomitrafilinic acid with a substituted pyran fragment, but none with the fused imidazolidine-pyran system shown in Figure 2.8 Taking into account the molecular formula and
the deduced structure of both the indole (Figure 1) and the imidazolidine-pyran (Figure 2) fragments, one of the aliphatic nitrogen atoms of each of these fragments must be shared to connect them. Hence, the structure containing the bridgehead-nitrogen bridged-bicyclic system shown in Figure 3 is proposed for braznitidumine 1. In accord with this, 1H 15N
HMBC shows long range correlation of the signal at δN 55.0 (N-2) with the signal at δH 2.64 (H-3, via2J), with the signal
at δH 3.00 (H-16a, via3J), and with the signal at δ H 3.26,
showing weak coupling (MeO-4, via5J). No other correlations
were observed in the NMR experiments performed (1H 1H
COSY, 1H 13C HMBC, 1H 15N HMBC) via scalar homonuclear
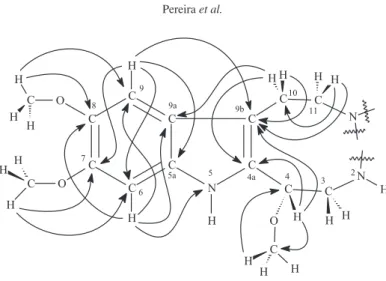
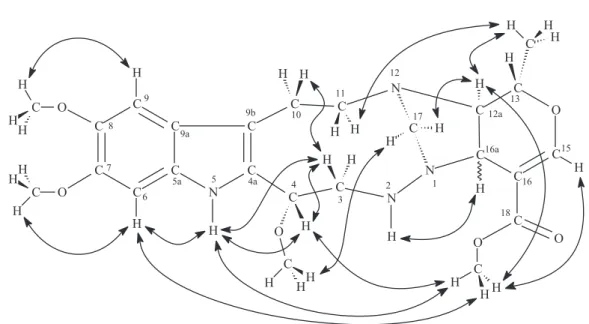
or heteronuclear spin-spin coupling of imidazolidine-pyran system atoms with indole fragment atoms. However, the proposed structure 1 was confirmed by dipolar interaction
due to spatial proximity observed as correlations in 1H 1H
NOESY experiment (Table 2). Figure 3 shows the 1H 1H
NOESY correlations detected for braznitidumine 1.
No correlation of the signal at δH 2.26 (H-12a) with the signal at δH 3.00 (H-16a) in 1H 1H NOESY was
observed. The correlations of H-12a with both Me-13 and H-17 show that they are on the same side of the molecule. The latter correlates also with OMe-4. Thus, the relative configuration of H-12a is established relatively to those
Figure 1. Important 1H 13C HMBC (via2J, 3J, and 4J) and 1H 15N HMBC (via3J) correlations for indole fragment of braznitidumine (1).
Figure 2. Substituted-fused imidazolidine-pyran system fragment of
groups in the molecule. However, nothing may be deduced for H-16a configuration, because the only correlation it presents is with the NH-2 (Figure 3). Therefore, H-16a may be cis or trans relatively to H-12a.
The correlations of MeO-18 with H-4, H-5, and H-6, as well as the correlation of Me-13 with H-11 indicates their spatial proximity, which could be explained if braznitidumine show a folded conformation. This conformation may be accounted for if the imidazolidine-pyran ring fusion is trans or cis as may be seen by the
Dreiding model as well by the DFT/BLYP/6-31G* optimized geometry (Figures 4a and 4b, respectively).
Figure 4 shows the DFT/BLYP/6-31G* optimized geometry of 1 considering the solvent (DMSO) effect by
PCM method. By single bond rotations of this geometry, the folding could be verified from spatial proximity of Me-13 with 11, as well as of MeO-18 with 4, 6, and H-5. In the folded trans configuration (Figure 4a), the hydrogen
interatomic distances are: CH3O-18 – H-5 = 2.470 Å; CH3 O-18 – H-6 = 4.326 Å; CH3O-18 – H-4 = 1.210 Å; CH3O-4 – H-17 = 3.140 Å; CH3-13 – H-17 = 4.320 Å. In the folded
cis configuration (Figure 4b), the hydrogen interatomic
distances are: CH3O-18 – H-5 = 2.241 Å; CH3O-18 – H-6 = 2.594 Å; CH3O-18 – H-4 = 1.192 Å; CH3O-4 – H-17 = 2.792 Å; CH3-13 – H-17 = 2.464 Å.
Experimental
General Procedures
Melting point was obtained on a Mettler FP82 HT and was uncorrected. FTIR spectrum was determined in KBr disk
Figure 4. DFT/BLYP/6-31G* optimized geometry of braznitidumine (1)
obtained from 1H 1H NOESY correlations: (a)trans and (b) cis
configu-rations.
1279 Pereira et al.
Vol. 17, No. 7, 2006
on an FTIR Perkin Elmer Spectrum 200 spectrometer. ESI-MS spectrum was obtained in positive mode in a Q-TOF MicroTM MICROMASS spectrometer. UV spectrum was
obtained in 1% methanol solution in a Perkin Elmer 202 spectrometer.Chromatographic purification was carried out on silica gel (70-230 mesh). In the thin layer chromatography analysis was used silica gel 60F254 and 60G mixture (1:3).
1H and 13C NMR spectra were measured on a Bruker
DRX400 – AVANCE spectrometer, with inverse probes and
field gradient, operating at 400.129 and 100.613 MHz, respectively. DMSO-d6 was used as a solvent (the sample
was dissolved in 0.75 mL of solvent and transferred to a 5 mm NMR tube), with TMS as an internal reference (δ =
0). 15N spectra were measured on a Bruker DRX400 –
AVANCE spectrometer with inverse probe and field gradient,
operating at 40.549 MHz, at Centro Nacional de Ressonância Magnética Nuclear (CNRMN), UFRJ.
DMSO-d6 was used as a solvent with urea as external reference (78
ppm in DMSO-d6). Chemical shifts are given in the δ-scale (ppm) and coupling constants J in Hz. Experiments were
carried out using pulse sequence and programs provided by the manufacturer. One dimensional (1D) 1H and 13C
NMR spectra were acquired under standard conditions by using a direct detection 5 mm 1H/13C dual probe. Standard
pulse sequences were used for two dimensional (2D) homonuclear and heteronuclear shift correlation spectra by using a multinuclear inverse detection 5 mm probe with field gradient at z axis. For 1H 13C HMBC, three delays for
evolution of long range coupling [1/(nJ
C-H)] 65, 125, and
130 ms] were used. For the 2D 1H 1H NOESY experiment
two mixing times (350 and 700 ms) were pre-optimized by a specific Bruker computer program.
Theoretical calculations
Theoretical studies were carried out using the software package GAUSSIAN03.9 Spatial arrangements determined
through NOESYexperiments were used as initial models for geometry optimization calculations by the semi-empirical PM3 method in the gaseous state.10 Geometries
obtained by PM3 method were optimized again by the Density Functional Theory (DTF)11 method with BLYP
functionals12 with a 6-31G*13 basis set
(DFT/BLYP/6-31G*). All structures obtained by theoretical calculations were characterized as true energy minima in PES through frequency calculations (when the frequencies are real, they correspond to a true minimal energy structure). Calculations of solvent effects were performed for optimized geometries in the DFT/BLYP/6-31G* level by using the Polarizable Continuum Model (PCM) at the same calculation level.14
Material and isolation of 1
Stem of A. nitidum was collected near Manaus City,
Amazon State in June 2000. A voucher specimen (181832) is deposited in the Herbarium of Instituto Nacional de Pesquisas da Amazônia (INPA). The dried and powered stem barks (1.5 kg) of A. nitidum were extracted with
EtOH and yielded 173 g of crude ethanol extract after the removal of the solvent. This extract was chromatographed on silica gel column and eluted with methylene chloride, acetyl acetate, and ethanol. The ethanol solution evaporated under vacuum yielded 40.20 g of a residue, which was rechromatographed on silica gel with ethyl acetate:methanol 9:1 as an eluent. Compound 1 (120.0
mg) was obtained as a yellow solid; mp 272.9-273.1 °C; Dragendorff positive test for alkaloids (orange-yellow color); IR (KBr) ν
max/cm-1: 3430, 2949, 1697, 1485, 1442,
1308, 1285. MS (ESI+) m/z: 472.682 (M+; 0.3), 427.214
([M–C2H6O]+; 1). For NMR data see Tables 1 and 2.
Conclusions
The structure of alkaloid braznitidumine (1) could be
elucidated through the analysis of its 1D and 2D 1H, 13C,
and 15N NMR spectra. It showed a new and interesting
framework including a 1,2,9-triazabicyclo[7.2.1] system in a folded molecule. The new compound may show either a trans or a cis fused imidazolidine-pyran system fragment
in its structure. Geometry optimization calculations (DFT/ BLYP/6-31G*) are compatible with nOe data and corroborate 1H 1H NOESY results.
Acknowledgments
The authors thank CNPq, FAPEAM, and FAPEMIG the financial support and Prof. Fábio C. L. Almeida from Centro Nacional de Ressonância Magnética Nuclear (CNRMN), UFRJ, the 15N NMR spectra. M. M. Pereira
thanks CAPES for PICDT grant.
Supplementary Information
Supplementary data are available at free of charge at http://jbcs.sbq.org.br, as PDF file.
References
1. Rocha, A. I. R.; Acta Amaz. 1982, 12, 381; Roberto, G. M. T.;
Ahond, A.; Poupat, C.; Potier, P.; Jousselin, A.; Jacquemin, H.;
2. Ferreira, P. C.; Marini-Bettolo, G. B.; Schumtz, J.; Experientia
1959, 15, 179; Ondetti, M. A.; Deulofeu, V.; Tetrahedron Lett.
1959, 1; Warnhoff, E. W.; J. Am. Chem. Soc.1959, 81, 4433; Ondetti, M. A.; Deulofeu, V.; Tetrahedron Lett. 1960, 18; Ondetti,
M. A.; Deulofeu, V.; Tetrahedron Lett. 1961, 160; Wenkert, E.; J. Am. Chem. Soc.1962, 84, 98; Ohashi, M.; Joule, J. A.; Djerassi,
C.; Tetrahedron Lett. 1964, 3899; Joule, J. A.; Djerassi, C.; J. Chem. Soc.1964, 2777; Brown, Jr., K. S.; Phytochemistry1976, 15, 1093;
Allen, J. R. F.; Holmstedt, B. R.; Phytochemistry1980, 19, 1573; Garcia, M. R. R.; Bolzani, V. S.; Serur, L. M.; Matos, F. J. A.; Gottlieb, O. R.; Biochem. Syst. Ecol.1987, 15, 187; Nunes, D. S.; Koike, L.; Taveira, J. J.; Reis, F. A. M.; Phytochemistry1992, 31,
2507; Mitaine, A. C.; Mesbah, K.; Richard, B.; Petermann, C.; Arrazola, S.; Moretti, C.; Hanrot, M. Z.; Oliver, L. L. M.; Planta Med. 1996, 62, 458; Oliveira, F. Q.; Junqueira, R. G.; Stehmann, J. R.; Brandão, M. G. L.; Rev. Bras. Plant. Med. 2003, 5, 23.
3. Brandão, M. G. L.; Grandi, T. S. M.; Rocha, E. M. M.; Sawyer, D. R.; Krettli, A. U.; J. Ethnopharmacol. 1992, 36, 175; Ribeiro, J. E.
L. S.; Hopkins, M. J. G.; Vicentini, A.; Sothers, C. A.; Costa, M. A. S.; Brito, J. M.; Souza, M. A. D.; Martins, L. H. P.; Lohmann, L. G.; Assunção, P. A. C. L.; Pereira, E. C.; Silva, C. F.; Mesquita, M. R.; Procópio, L. C.; Guia de Identificação das Plantas Vasculares de uma Floresta de Terra-Firme na Amazônia Central, Midas Printing: Manaus, 1999, p. 568; Weniger, B.; Robledo, S.; Arango, G. J.; Deharo, E.; Aragon, R.; Muñoz, V.; Callapa, J.; Lobstein, A.; Anton, R.; J. Ethnopharmacol. 2001, 78, 193; Bourdy, G.; Oporto, P.;
Gimenez, A.; Deharo, E.; J. Ethnopharmacol.2004, 93, 269. 4. Arndt, R. R.; Brown, S. H.; Ling, N. C.; Roller, P.; Djerassi, C.;
Ferreira-Filho, J. M.; Gilbert, B.; Miranda, E. C.; Flores, S. E.;
Phytochemistry1967, 6, 1653.
5. Brown Jr., K. S.; Sanchez, W. E.; Figueiredo, A. A.; Ferreira-Filho, J. M.; J. Am. Chem. Soc. 1966, 88, 4984; Berden, G.;
Meerts, W. L.; Jalviste, E.; J. Chem. Phys.1995, 103, 9596. 6. Manske, R. H. F.; Rodrigo, R.; The Alkaloids, Academic Press:
New York, 1965, vol. 8.
7. Murari, M.; Baumann, W. J.; J. Am. Chem. Soc.1981, 103, 1238.
8. Gilbert, B.; Antonaccio, L. D.; Djerassi, C.; J. Am. Chem. Soc.
1962, 84, 4702; Gilbert, B.; Brissolese, J. A.; Finch, N.; Taylor,
W. I.; Budzikiewicz, H.; Wilson, J. M.; Djerassi, C.; J. Am. Chem. Soc. 1963, 85, 1523; Litschel, E.; Tomcsik, J.; Experientia1963, 19, 585; Dastoor, N. J.; Gorman, A. A.; Schmid, H.; Helv. Chim. Acta1967, 50, 213; Roberto, G. M.
T.; Ahond, A.; Poupat, C.; Potier, P.; Jousselin, A.; Jacquemin, H.; J. Nat. Prod.1983, 46, 694.
9. Gaussian 03, Revision B.04: Frisch, M. J.; Trucks, G. W.; Schlegel, H. B.; Scuseria, G. E.; Robb, M. A.; Cheeseman, J. R.; Montgomery Jr., J. A.; Vreven, T.; Kudin, K. N.; Burant, J. C.; Millam, J. M.; Iyengar, S. S.; Tomasi, J.; Barone, V.; Mennucci, B.; Cossi, M.; Scalmani, G.; Rega, N.; Petersson, G. A.; Nakatsuji, H.; Hada, M.; Ehara, M.; Toyota, K.; Fukuda, R.; Hasegawa, J.; Ishida, M.; Nakajima, T.; Honda, Y.; Kitao, O.; Nakai, H.; Klene, M.; Li, X.; Knox, J. E.; Hratchian, H. P.; Cross, J. B.; Adamo, C.; Jaramillo, J.; Gomperts, R.; Stratmann, R. E.; Yazyev, O.; Austin, A. J.; Cammi, R.; Pomelli, C.; Ochterski, J. W.; Ayala, P. Y.; Morokuma, K.; Voth, G. A.; Salvador, P.; Dannenberg, J. J.; Zakrzewski, V. G.; Dapprich, S.; Daniels, A. D.; Strain, M. C.; Farkas, O.; Malick, D. K.; Rabuck, A. D.; Raghavachari, K.; Foresman, J. B.; Ortiz, J. V.; Cui, Q.; Baboul, A. G.; Clifford, S.; Cioslowski, J.; Stefanov, B. B.; Liu, G.; Liashenko, A.; Piskorz, P.; Komaromi, I.; Martin, R. L.; Fox, D. J.; Keith, T.; Al-Laham, M. A.; Peng, C. Y.; Nanayakkara, A.; Challacombe, M.; Gill, P. M. W.; Johnson, B.; Chen,W.; Wong, M. W.; Gonzalez, C.; Pople, J. A.; Gaussian, Inc., Pittsburgh PA, 2003.
10. Dewar, M. J. S.; Zoebish, E. G.; Healy, E. F.; Stewart, J. J. P.; J. Am. Chem. Soc.1985, 107, 902.
11. Parr, R. G.; Yang, W.; Density Functional Theory of Atoms and Molecules, Oxford: New York, 1989.
12. Becke, A. D.; Phys. Rev. A 1988, 38, 3098; Lee, C.; Yang, W.;
Parr, R. G.; Phys. Rev. B 1993, 37, 785.
13. Ditchfield, R.; Hehre, W. J.; Pople, J. A.; J. Chem. Phys.1971,
54, 724; Hehre, W. J.; Ditchfield, R.; Pople, J. A.; J. Chem. Phys.1972, 56, 2257; Hariharan, P. C.; Pople, J. A.; Theor. Chim. Acta1973, 28, 213; Hariharan, P. C.; Pople, J. A.; Mol. Phys.1974, 27, 209; Gordon, M. S.; Chem. Phys. Lett.1980,
76, 163.
14. Ditchfield, R.; Hehre, W. J.; Pople, J. A.; J. Chem. Phys.1971,
54, 724; Hehre, W. J.; Ditchfield, R.; Pople, J. A.; J. Chem. Phys.1972, 56, 2257; Cossi, M.; Barone, V.; Camimi, R.;
Tomasi, J.; Chem. Phys. Lett.1996, 255, 327; Barone, V.; Cossi, M.; Tomasi, J.; J. Chem. Phys.1997, 107, 3210.
Received: April 27, 2006
J. Braz. Chem. Soc., Vol. 17, No. 7, S1-S10, 2006.
Printed in Brazil - ©2006 Sociedade Brasileira de Química 0103 - 5053 $6.00+0.00
Supplementary Information
*e-mail: [email protected]
# This name is an homage to Professor Raimundo Braz-Filho. This article
was submitted to the special issue dedicated to Professor Raimundo Braz-Filho on the occasion of his 70th birthday.
NMR Structural Analysis of
#Braznitidumine: A New Indole Alkaloid with
1,2,9-Triazabicyclo[7.2.1] System, Isolated from
Aspidosperma nitidum
(Apocynaceae)
Maria M. Pereira,a,bAntônio Flávio de C. Alcântara,b,c Dorila Piló-Veloso*,b and Délio S. Raslanb
a
Departamento de Medicamentos e Alimentos, Faculdade de Farmácia, Universidade Federal do Amazonas, 69010-300 Manaus-AM, Brazil
b
Departamento de Química, ICEx, Universidade Federal de Minas Gerais, 31270-901 Belo Horizonte-MG, Brazil
c
Departamento de Química, ICE, Universidade Federal do Amazonas, 69077-000 Manaus-AM, Brazil
Figure S1.1H NMR spectrum of Braznitidumine (I) in DMSO-d
Figure S2. Partial 1H NMR spectrum of Braznitidumine (I) in DMSO-d
6, 400 MHz.
Figure S3.1H 1H COSY contour map of Braznitidumine (I) in DMSO- d
3 Pereira et al.
Vol. 17, No. 7, 2006
Figure S4. 1H 1H NOESY contour map of Braznitidumine (I) in DMSO- d
6, 400 MHz; mixing time = 350 ms.
Figure S5.1H 1H NOESY contour map of Braznitidumine (I) in DMSO- d
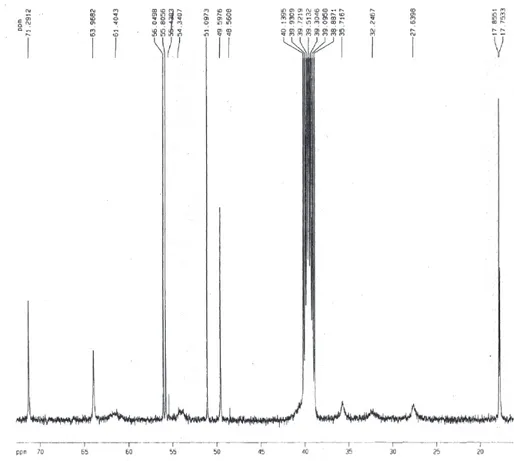
Figure S6.13C NMR spectrum of Braznitidumine (I) in DMSO-d
6, 100 MHz.
Figure S7. Partial 13C NMR spectrum of Braznitidumine (I) in DMSO-d
5 Pereira et al.
Vol. 17, No. 7, 2006
Figure S8.13C NMR DEPT-135 spectrum of Braznitidumine (I) in DMSO-d
6, 100 MHz.
Figure S9.13C NMR DEPT-135 partial spectrum of Braznitidumine (I) in DMSO-d
Figure S10. 1H 13C HSQC contour map of Braznitidumine (I) in DMSO- d
6, 400 MHz x 100 MHz.
Figure S11. 1H 13C HSQC partial contour map of Braznitidumine (I) in DMSO- d
7 Pereira et al.
Vol. 17, No. 7, 2006
Figure S12. 1H 13C HSQC partial contour map of Braznitidumine (I) in DMSO- d
6, 400 MHz x 100 MHz.
Figure S13. 1H 13C HSQC partial contour map of Braznitidumine (I) in DMSO- d
Figure S15. 1H 15N HSQC partial contour map of Braznitidumine (I) in DMSO- d
6, 400 MHz x 40.55 MHz.
Figure S14. 1H 13C HMQC contour map of Braznitidumine (I) in DMSO- d
9 Pereira et al.
Vol. 17, No. 7, 2006
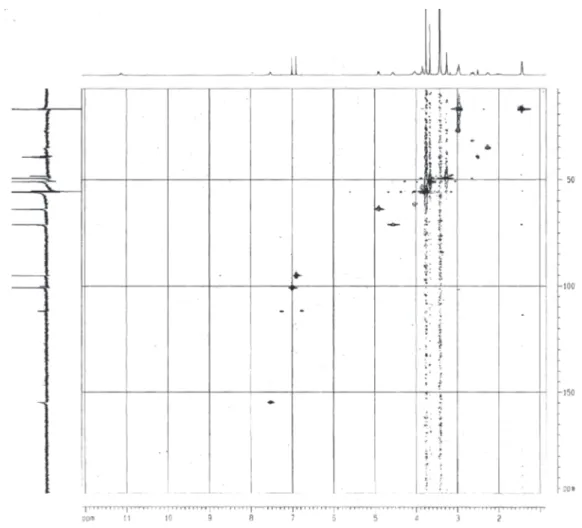
Figure S16. 1H 13C HMBC contour map of Braznitidumine (I) in DMSO- d
6, 400 MHz x 100 MHz; delay 65 ms.
Figure S17. 1H 13C HMBC contour map of Braznitidumine (I) in DMSO- d
Figure S18. 1H 15N HMBC contour map of Braznitidumine (I) in DMSO- d