Article
0103 - 5053 $6.00+0.00
*e-mail: cgarcia@ufs.br
Regional Geochemical Baselines and Controlling Factors for Trace Metals in Sediments
from the Poxim River, Northeast Brazil
Carlos A. B. Garcia,
*
,aMarlúcia S. Barreto,
bElisângela A. Passos
aand José do Patrocínio H. Alves
aaLaboratório de Química Analítica Ambiental, Departamento de Química, Universidade Federal de Sergipe,
49100-000 São Cristóvão-SE, Brazil
bUniversidade Estadual do Sudoeste da Bahia, 45206-190 Jequié-BA, Brazil
A sub-bacia hidrográfica do rio Poxim é formada por quatro rios de água doce, Poxim-Açu, Poxim-Mirim, Poxim e Pitanga e está situada na porção leste do Estado de Sergipe, Nordeste do Brasil. Nesse trabalho foi investigada a distribuição, os fatores que controlam as concentrações e o risco de toxicidade para Co, Cr, Cu, Li, Mn, Ni, Pb, Zn, Al e Fe em sedimentos superficiais dos quatro rios. A toxicidade foi avaliada usando o Consensus-based Sediment Quality Guidelines for freshwater ecosystems. A matriz de Spearman não indicou associação dos metais com a matéria orgânica, mas mostrou uma forte correlação com alumínio, moderada com o ferro e fraca com o manganês, sugerindo ser as argilas os principais carreadores dos metais para os sedimentos. Em todas as amostras as concentrações dos metais ficaram abaixo do TEC (threshold effect concentration) indicando que em relação aos metais traço, raramente deve ocorrer efeito adverso para a biota aquática. Foi definida uma base geoquímica para a região usando o lítio como elemento de referência. Somente em três sítios foram observados enriquecimentos dos metais associados a influências antrópicas. Os valores do fator de enriquecimento sugerem uma grande predominância nos sedimentos, de metais de origem natural.
The Poxim river hydrographic sub-basin comprises four freshwater rivers, Açu, Poxim-Mirim, Poxim and Pitanga, and is located in the East of Sergipe State, Northeast of Brazil. The present work investigates the distribution, the factors controlling concentrations, and toxicity risks of the metals Co, Cr, Cu, Li, Mn, Ni, Pb, Zn, Al and Fe, in surface sediments of the four rivers. Toxicity was evaluated using the Consensus-based Sediment Quality Guidelines for freshwater ecosystems. Spearman correlation analysis did not indicate any association of the metals with organic matter, however strong, moderate and weak correlations with aluminium, iron, and manganese, respectively, suggested that clay minerals were the main carrier of metals to sediments. Concentrations of metals in all samples were below the TEC (threshold effect concentration), indicating that for these trace metals adverse effects on aquatic biota should rarely occur. A geochemical baseline for the region was defined using lithium as reference element. Metal enrichments due to anthropogenic influence were only observed at three sites. At other sites, enrichment factors were indicative of a large predominance of naturally occurring metals in the sediments.
Keywords: sediments, trace metals, geochemical baselines, Poxim River
Introduction
Aquatic sediments accumulate metals derived from both natural processes as well as anthropogenic activities, and play a fundamental role in redistribution of these elements to water and aquatic biota. The ability to accumulate and redistribute chemical species makes sediments extremely interesting for the purposes of environmental investigation,
since they can provide a semi-permanent record of levels of contamination.1-3 In order to determine the contamination degree of a sediment, it is first necessary to calculate the natural component of the total metal concentration, which requires determination of the background concentration and its natural variation. Various normalization procedures have been employed to take account of natural variability, and detect and quantify anthropogenic enrichment.4-7
and the concentration of a reference element, such as aluminium, iron or lithium. The reference element must be of lithogenic origin, be structurally linked to at least one of the main carriers of metals to the sediment, and its concentration must not be significantly influenced by anthropogenic inputs.3,8 Aluminium has been most frequently used for normalization, since it is the main component of fine-grained aluminosilicates. However, in the case of sediments composed mainly of immature, physically abraded material, such as feldspars, aluminium has not shown good correlations with metals, since in such sediments it is present in similar proportions in both fine and coarse fractions. Here, lithium has been found to be a better normalizer, since it is associated with the same mineralogical components as the trace metals.3,9-10 For uncontaminated sediment samples, correlation plots between the metals and the reference element are used to generate regression lines representative of the regional geochemical baseline.
The total sediment concentration of a metal does not provide information concerning its mobility, availability or toxicity. Toxicity is dependent on the amount of metal available for bioaccumulation (accumulation by biological organisms), and it depends on those sediment properties that affect its bioavailability. Hence, it is possible for sediment to be metal-contaminated (to have a metal content higher than the natural background), but not manifest any toxic effects, depending on the geochemical processes that control the availability of the metal in the sediment.11-15
Various sediment quality guidelines (SQG) have been developed by North American agencies, for fresh water and marine ecosystems. These are used as informal tools, to evaluate the extent to which chemical species associated with sediments can induce adverse effects in aquatic biota.16-18 Selection of the most appropriate SQG to use in a given application is not always straightforward, mainly due to the existence of limited recommendations for the use of the various guidelines, and the fact that some show differences of up to several orders of magnitude in numerical values for the same substance. The consensus-based sediment quality guidelines for fresh waters were developed in an attempt to resolve such difficulties. These were derived for 28 chemicals (metals, polycyclic aromatic hydrocarbons, polychlorinated biphenyls and pesticides),19 from previously published SQGs,20-24 and for each contaminant provide two concentrations associated with adverse effects in aquatic organisms. The threshold effect concentration (TEC) is that below which no adverse effects should occur, and the probable effect concentration (PEC) is that above which adverse effects may occur frequently.
This work is the first study of trace metal geochemistry in surface sediments of the Poxim River hydrographic sub-basin in Sergipe State, Brazil Northeast. Sediment samples were analyzed in order to define a regional geochemical baseline, to identify any impacted areas, and to evaluate possible toxicity based on consensus-based SQG reference data. Potential factors controlling the distribution and mobility of metals in the sediments were also investigated.
Materials and Methods
Study area
The Poxim River hydrographic sub-basin drains an area of around 380 km2 and is located in the East of Sergipe State between latitudes 10°55’S and 10°45’S, and longitudes 37°05’W and 37°22’W. The region includes parts of the municipalities of Aracaju, Areia Branca, Laranjeiras, Itaporanga d’Ajuda, Nossa Senhora do Socorro and São Cristóvão, with a total population of 721,726 inhabitants.25,26 The River Poxim sub-basin principally comprises the Rivers Poxim-Açu, Poxim-Mirim, Poxim and Pitanga, along a west-east axis, and is currently responsible for around 30% of the water supply to the City of Aracaju, the State capital.
The Poxim River comprises the watercourse formed by the confluence of the Poxim-Açu and Poxim-Mirim Rivers, and near its source is joined by another affluent, the Pitanga River. In its final stretches it passes through urban areas of the municipalities of São Cristóvão, Nossa Senhora do Socorro and Aracaju, where it receives in natura effluents from domestic and industrial sources.27
Sample collection
Forty-five surface sediment samples were collected at fifteen sites in the Poxim River sub-basin (Figure 1), during February 2006, using a core sampler with a cellulose acetate-butyrate tube. Portions of 5 cm were removed from the top of each core, using non-metallic utensils to avoid contamination, placed into sealed plastic flasks, and stored over ice during transport to the laboratory. In the laboratory, the fine fraction (< 63 µm) percentage was determined by liquid sieving of the sample, drying at 100 oC to constant mass, and weighing.
Chemical analysis
For determination of total metal concentrations, samples (ca. 0.5 g) were treated in closed Teflon vessels, using 2 mL of HNO3, 1 mL of HCl and 4 mL of HF, (all concentrated) and heating at 140 oC for 2 h. After cooling, the vessels were opened and maintained at 210 oC until complete dryness was achieved. The residue was dissolved in 10 mL of 0.5 mol L-1 HCl, and the volume made up to 50 mL. The solutions were stored in polyethylene flasks for later determination of metals using flame or graphite furnace atomic absorption spectrometry.
Reagent blanks were prepared in the same way as samples, and three certified sediment standards (LKSD-1 CCNRP/Canada lake sediment, NCS DC 75304/China river sediment, and NCS DC 78301/China marine sediment) were analyzed for quality control purposes. Results showed no significant contamination in blanks and trace metal recoveries from the reference materials were within the range 92-106%.
Partial metal concentrations were determined using US EPA Method 200.8. Samples (ca. 1 g) were treated in closed Teflon vessels using 4 mL of 1:1 HNO3 solution and 10 mL of 1:5 HCl solution. The mixture was held at 95 oC for 30 min. Following extraction, samples were filtered using quantitative filter paper, transferred to a 50 mL volumetric flask, and made up to final volume using ultra-pure water. Solutions were stored in polyethylene flasks for later determination of metals using flame or graphite furnace atomic absorption spectrometry. Three blank solutions were prepared in the same way as samples, and analytical quality control was achieved by analysis of the certified lake sediment standard (LKSD-1 CCNRP/Canada), which is also certified for partial extraction. Results showed a trace metal recovery in the range 97-103%. Metal concentrations were determined using three replicates.
Total carbon contents of the samples were measured using an elemental analyzer (NCHS-O, Flash ES 1112), at a combustion temperature of 900 oC. Organic carbon (C
org) was calculated as the difference between carbon contents measured before and after sample calcinations at 550 oC for 1 h. The certified lake sediment standard (LKSD-1 CCNRP/ Canada) was used for quality control, with three replicates showing a mean recovery of 96.3 ± 4.2%.
Principal components analysis (PCA) and correlation coefficient calculations were undertaken using Statistica for Windows (v. 6.0).
Results and Discussion
Sediment characteristics and relationships with trace metals
Sediment metal concentrations, organic carbon contents, and fine fraction (< 63 µm) percentages are given in Table 1. All samples showed low fine fraction contents, with a range of 4.7-19.6% and mean of 11.0 ± 4.1%.
Natural sediment trace element concentrations are strongly influenced by the nature of the inorganic material resulting from physical and chemical weathering. This material is mainly formed from a limited number of silicate minerals, such as quartz, feldspar, mica and clay minerals, with a smaller contribution from metal oxides and sulfides. Clays comprise the finest fractions, and tend to absorb more metals, which is why analysis of the fine fraction has been used as a means to correct for natural variability of metal concentrations.28,29
Fine fraction organic carbon contents varied between 1.0% and 5.7%, with a mean of 3.0%. The highest value was obtained for site 6, at the confluence of the Poxim-Açu and Poxim-Mirim Rivers.
Correlation analysis was used to identify potential factors controlling the distribution and mobility of metals in the sediments. The Spearman correlation matrix obtained is provided in Table 2. The trace metals showed no correlation with Corg, indicative of no, or at best weak, association between these elements and organic matter in the sediments. This is in agreement with the finding that, in non-marine sediments, Corg is a weaker carrier than the clays and metal oxides.30 Strong correlation with aluminium, moderate to strong correlation with iron, and weak correlation with manganese was observed, demonstrating that inorganic carriers were the main factors controlling metal distributions in the sediments. The strong correlations between iron and aluminium, and between aluminium and the other metals, confirm the principal association of iron with the silt-clay fraction, and show that the clays were the main carriers of
Figure 1. Location of sampling sites in the Poxim River, Northeast of
metals to the sediments. Similar results have been obtained for Australian sediments.30
Trace metal distribution and normalization
PCA was applied to the dataset presented in Table 1, in order to identify any trends in the spatial distribution of the sediments analyzed. This multivariate statistical technique has previously been shown to be useful in interpretation of aquatic sediment data.31-33 Here each site was considered as an object (15 in total), and the measured parameters as variables (total of 11). In order to ensure that the relative influences of the different variables on the model were independent of the units used for each variable, the data matrix columns were auto scaled so that the new variable possessed a mean of zero and unit variance.
Table 1. Total metals concentrations, organic carbon (Corg), and fine fraction contents of dry surface sediments from the Poxim river (n = 3, mean ±
standard deviation)
Site Co/(µg g-1) Cr/(µg g-1) Cu/(µg g-1) Li/(µg g-1) Mn/(µg g-1) Ni/(µg g-1) Pb/(µg g-1) Zn/(µg g-1) Al/(%) Fe/(%) C org/(%)
Fine fraction % < 63 µm 1 1.1± 0.1 5.3± 0.9 4.3± 0.9 1.8± 0.2 10.0± 0.8 2.6± 0.2 4.8± 0.3 6.6± 0.5 2.5± 0.3 0.2± 0.1 4.1± 0.2 7.6± 0.8 2 2.7± 0.4 7.1± 0.8 7.5± 0.3 5.8± 0.9 57.6± 4.4 8.3± 0.5 5.5± 0.3 17.5± 0.6 3.1± 0.2 0.8± 0.2 2.9± 0.1 6.7± 0.7 3 4.2± 0.2 10.3± 0.5 6.4± 0.8 7.6± 0.7 112± 12 6.5± 0.3 7.1± 0.4 21.7± 1.5 3.1± 0.1 1.1± 0.1 2.6± 0.1 13.1± 1.1 4 6.2± 0.2 12.4± 0.5 6.6± 0.2 7.9± 0.7 117± 17 7.9± 0.3 6.9± 0.6 24.5± 0.9 2.4± 0.1 1.5± 0.2 1.3± 0.1 16.5± 1.7 5 5.2± 0.3 18.9± 1.5 9.9± 0.7 14.2± 2.7 49.0± 5.5 13.0± 0.4 9.1± 0.8 39.3± 1.0 3.8± 0.3 1.3± 0.3 4.2± 0.3 8.8± 0.9 6 7.0± 0.7 27.3± 1.7 18.1± 2.4 15.5± 2.4 42.3± 5.7 18.1± 0.5 6.9± 0.8 49.9± 6.1 6.5± 0.8 3.3± 0.1 5.7± 0.4 15.4± 0.4 7 7.6± 0.7 22.7± 2.7 19.1± 2.4 5.9± 2.3 65.6± 2.7 18.2± 0.4 7.3± 0.5 43.1± 5.8 4.9± 0.2 4.4± 0.4 1.3± 0.1 8.9± 0.9 8 8.8± 0.2 31.7± 3.7 52.5± 7.3 19.9± 3.1 130± 13 26.5± 2.3 27.1± 2.6 127± 4 7.3± 0.8 4.4± 0.4 3.8± 0.2 4.7± 0.5 9 8.6± 0.2 28.7± 2.6 16.2± 0.8 22.7± 5.5 150± 14 21.8± 2.2 16.2± 0.9 57.4± 2.2 6.6± 0.8 3.7± 0.3 2.2± 0.1 13.0± 1.3 10 3.2± 0.3 13.1± 1.4 5.9± 0.7 6.5± 0.5 36.0± 0.7 7.6± 0.4 5.3± 0.4 25.4± 1.8 2.4± 0.2 1.1± 0.2 3.8± 0.2 11.8± 0.8 11 6.4± 0.5 20.0± 2.2 7.4± 0.7 9.9± 0.3 64.1± 2.7 13.7± 2.0 8.7± 0.5 25.5± 2.4 2.6± 0.2 1.6± 0.5 2.4± 0.2 9.2± 0.6 12 6.1± 0.7 17.1± 1.6 6.2± 1.4 8.7± 0.9 64.9± 2.6 13.1± 1.2 7.9± 0.4 28.6± 2.5 2.6± 0.4 1.6± 0.5 1.9± 0.1 15.8± 1.0 13 2.4± 0.4 16.1± 1.6 5.8± 1.2 4.2± 0.5 137± 15 3.4± 0.9 5.1± 0.5 16.6± 0.7 2.4± 0.2 3.0± 0.3 1.0± 0.1 19.6± 2.0 14 3.1± 0.3 12.4± 1.7 6.1± 1.1 5.9± 0.3 56.0± 3.9 6.1± 0.6 5.4± 0.5 21.1± 1.0 2.7± 0.2 2.5± 0.1 3.2± 0.2 10.9± 1.1 15 6.3± 0.7 20.7± 2.5 22.7± 3.1 10.5± 0.7 173± 27 17.5± 0.8 7.8± 0.4 79.1± 4.6 5.2± 0.6 4.7± 0.6 4.7± 0.2 11.9± 1.1
Two principal components were extracted, together representing 80.5% of the total variance. Component t1 was responsible for 68.6% of the explained variance, and mainly comprised Co, Cr, Cu, Li, Ni, Pb, Zn, Al and Fe. Component t2 was strongly associated with Corg and explained 12.9% of the variance. Figure 2 shows the position of each site on the plane of coordinates formed by the two components.
The PCA separated the sampling sites into three major groupings. Group I included sites 7, 8, 9 and 13, Group II site 6, and Group III sites 1, 2, 3, 4, 5, 10, 11, 12, 13 and 14. The first component (t1) separated Groups I and II (the more negative part of t1) from Group III (the positive part of t1). The most important variables in this separation (factor 1 > 0.8) were Co, Cr, Li, Ni, Pb, Zn, Al and Fe, whose concentrations were higher in sediments from Groups I and II. The second component (t2) separated Group II
Table 2. Spearman’s rank correlation matrix for surface sediments (95% confidence limits, n = 15, p < 0.05)
FF Corg Co Cr Cu Li Mn Ni Pb Zn Al Fe
FF 1.00
Corg 0.14 1.00
Co −0.08 0.08 1.00
Cr −0.06 0.21 0.88 1.00
Cu −0.47 0.06 0.67 0.75 1.00
Li −0.11 0.26 0.79 0.84 0.64 1.00
Mn 0.09 −0.33 0.44 0.42 0.41 0.41 1.00
Ni −0.34 0.13 0.92 0.92 0.82 0.84 0.37 1.00
Pb −0.34 −0.11 0.68 0.73 0.87 0.79 0.44 0.78 1.00
Zn −0.44 0.09 0.73 0.80 0.97 0.74 0.52 0.87 0.86 1.00
Al −0.30 0.32 0.76 0.86 0.83 0.83 0.38 0.90 0.73 0.85 1.00
from Groups I and III. The determining variable was Corg, with sediment from site 6 presenting a Corg concentration which was much higher than those obtained for sites in Groups II and III. From the PCA diagram, it can therefore be concluded that sediments from the Poxim-Açu, Poxim-Mirim and Pitanga Rivers (Group III) possessed similar chemical characteristics, with the exception of site 15, which is in Group II. Sediments from the Poxim River (sites 6, 7, 8, 9), and the Pitanga River (site 15), were different from the remainder in that they contained higher concentrations of trace metals. Sites 7, 8, 9 and 15 are located in a region strongly influenced by urban and industrial discharges, so it is likely that the higher values were due to the presence of metals originating from anthropogenic activity. Site 6 is located in a flood plain region. Such areas are characterized by the accumulation of significant quantities of organic matter,34 which can explain the high sediment Corg concentration obtained for this site, which distinguished it from the other Poxim River sites.
In order to identify possible contamination in the sediments, trace metal concentrations were normalized relative to the concentration of a reference element. Sediments from sites 1, 2, 3, 4, 5, 6, 9, 10, 11, 12, 13 and 14 were selected as being representative of natural areas. Only sites 7, 8 and 15 were excluded, due to their location
in areas directly influenced by inputs of urban and industrial effluents. Identification of the most suitable geochemical normalizer for the study area was achieved by determination and comparison of the correlation coefficients (R2) and significance levels (p) obtained for linear regressions between the trace metals and either Al or Li. Results (Table 3) confirmed the suitability of the selected reference sites and showed that lithium was the better normalizer. Higher R2 values reflect the greater ability of lithium to explain natural variations in metal concentrations. Despite strong correlation between Li and Al (R2 = 0.83, p < 0.0001) and their co-existence in the silt-clay fraction, Al showed only moderate to weak correlations with most of the trace metals.
Various studies3,4,9have shown lithium to be a better normalizer than aluminium, for sediments composed mainly of geologically younger materials, such as variable grain size feldspars. In these sediments, aluminium is present in relatively equal proportions in both fine and coarse fractions, which results in weak correlation with the trace metals. Lithium is here the better normalizer, because it is associated with the same mineralogical components as the metals, such as primary micas, iron-magnesium minerals, and secondary mineral clays, but not with feldspars.9,35 Lithium cannot be used to normalize Mn concentrations (a non-significant correlation was obtained between these metals), probably because Mn is associated with a different geochemical substrate.
Figures 3a to 3f show plots of the concentrations of the trace metals against lithium, and linear regression lines for the reference sites, 95% confidence intervals, and the points corresponding to the areas considered to be contaminated (sites 7, 8 and 15). Concentrations inside the 95% confidence intervals are considered to be within the natural variation, while those outside are assumed to be associated with enrichment of the sediment by metal of anthropogenic origin.
Co and Cr (Figures 3a and 3b) showed similar distribution patterns, with all sites lying within the 95% confidence limits, except site 7, which showed a small enrichment of these metals. Ni (Figure3d) evidenced an anthropogenic influence at sites 7 and 15. Cu and Zn (Figures 3c and 3f) showed concentrations much higher than
Figure 2. Principal component analysis diagram for total metal
concentrations and Corg contents of the Poxim River sediments. Groupings identified by the analysis are circled.
Table 3. Correlation coefficient (R2) and probability (p) values for regressions of metals on Al and Li, for sites representative of natural sediments (n = 15)
Co Cr Cu Mn Ni Pb Zn Al Fe
Al R2
0.43 p = 0.02
0.62 p = 0.002
0.96 p < 0.0001
0.04 p = 0.5
0.69 p = 0.001
0.45 p = 0.02
0.78
p = 0.0001 -
-Li R2
0.76 p = 0.0002
0.78 p = 0.0001
0.78 p = 0.0001
0.12 p = 0.26
0.89 p < 0.0001
0.80 p < 0.0001
0.95 p < 0.0001
0.83 p < 0.0001
the 95% confidence limits at sites 7, 8 and 15, indicating strong enrichment of the metals in these sediments. For Pb (Figure 3e) all sites lie within the confidence limits, except site 8 (which shows strong enrichment). Hence metal concentrations in the sediments analyzed can be considered to be due to natural origins, except at sites 7, 8 and 15, and the regression lines obtained can be used to define the local natural geochemical baseline.
Enrichment factors (EF) were calculated to quantify the anthropogenic impact, as described in the literature,3 using the expression ([metal]/[Li])sample/([metal]/[Li])background. To the some Li concentration, the metal concentration on the linear regression line was used as background value and concentrations lying on the upper 95% confidence limit was used as comparison value. Sediments were only considered to be enriched if the EF exceeded 2, due to natural mineralogical variability and uncertainty of the analytical measurements.30 Calculated EFs (Table 4) indicate that sediments from sites 7, 8 and 15 were enriched in Co, Cu, Ni, Pb and Zn, due to inputs from urban and industrial sources. At site 7, enrichment of Co, Ni and Zn
was moderate (EF < 3), while there was strong enrichment of Cu (EF > 3). Moderate Pb enrichment was only observed for site 8. Cu and Zn were the elements that showed greatest enrichment at the three sites. High concentrations of these elements have been observed in sediments located close to sewage discharges.36,37
The geoaccumulation index (Igeo)38 was also used as a second criterion to identify contaminated sediments (Table 5). Igeo is defined by: log2 [Cn/1.5Bn], where Cn is the measured concentration, and Bn the background geochemical concentration of the metal “n”. As reported in previous studies,31,39,40 the metal concentration on the regression line was used as the background value.
Igeo is based on a qualitative pollution intensity scale, whereby sediments can be classified as unpolluted (Igeo ≤ 0), unpolluted to moderately polluted (0 ≤ Igeo ≤ 1), moderately polluted (1 < Igeo ≤ 2), moderately to highly polluted (2 < Igeo ≤ 3), highly polluted (3 < Igeo ≤ 4), highly to extremely polluted (4 < Igeo≤ 5), and extremely polluted (Igeo > 5).40 According to these criteria, sediments from sites 1-6 and 9-13 were classified as unpolluted with respect to
Figure 3. (a) Co:Li, (b) Cr:Li, (c) Cu:Li, (d) Ni:Li, (e) Pb:Li and (f) Zn:Li, scatter plot for Poxim River sediments; solid line represents the regression line;
dashed lines define the 95% confidence band; the reference stations.
Table 4. Enrichment factors (EF) and comparison values (CV) for sediments from the Poxim river (bold type indicates enriched)
Site Co Cr Cu Ni Pb Zn
EF CV EF CV EF CV EF CV EF CV EF CV
7 2.13 1.75 1.88 1.68 3.08 1.86 2.58 1.68 1.26 1.63 2.17 1.41
8 1.06 1.36 1.15 1.33 3.38 1.36 1.29 1.25 2.14 1.31 2.35 1.17
all of the metals analyzed. Sediment from site 7 was in the unpolluted to moderately polluted category, with respect to Co, Cr, Ni and Zn, and in the moderately polluted category, with respect to Cu. For site 8, Pb and Zn were within the unpolluted to moderately polluted band, and Cu was in the moderately polluted range. At site 15, Cu and Zn were in the unpolluted to moderately polluted category. Hence it is clear that the results obtained using the EF and Igeo procedures were in good agreement.
Sediment toxicity
The SQGs have been used as reference tools, to evaluate the extent to which metals associated with sediments could adversely affect aquatic organisms.16 Development and implementation of these guidelines reflects a recognition of the importance of contaminated sediments as a possible cause of adverse environmental impacts.41 Although originally developed for use in North America, the indices established in these SQGs have been adopted for assessment of contaminant concentrations in sediments from various regions of the globe.16,32,42,43
In the absence of toxicological information, the consensus-based SQGs, developed for freshwater ecosystems, were used in the present study to evaluate any possible adverse effects, on aquatic organisms, of the metal concentrations measured in the fine fraction of surface sediments.
The < 63 µm fractions proved to be the most chemically active sediment phase, consisting primarily of clay and
silt particulates and due to the large specific surface area, typically contains higher concentrations of metals.40
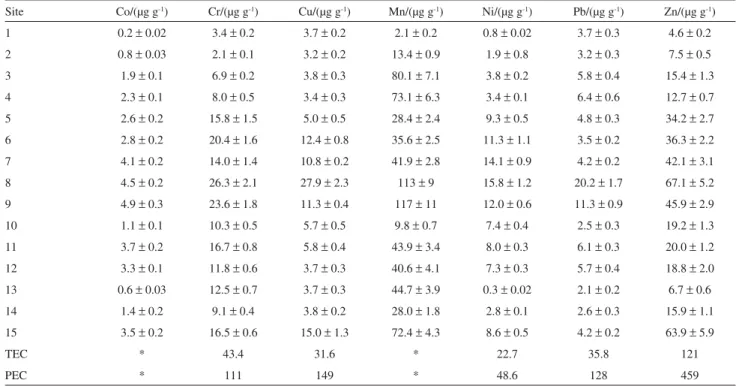
In order to allow such assessment of toxicity, based on SQG values, the trace metal concentrations were determined following extraction using nitric and hydrochloric acids (i.e. the partial concentrations), which is a procedure compatible with that used in the development of the SQG. Table 6 shows the concentrations obtained for each metal, together with the respective TEC and PEC values. The highest concentrations were generally obtained for sites 6-9 and 15, however all values were below the TEC, indicating that adverse effects on aquatic biota should be unlikely to occur. The value nearest to the TEC was obtained for Cu at site 8 (27.9 µg g-1). The predictive ability of the TEC achieved 72% for Cr and Ni, and 82% for Cu, Pb and Zn. This signifies that the probability of the incidence of adverse biological effects at concentrations below the TEC is 28% for Cr and Ni, and 18% for Cu, Pb and Zn. The predictive ability of the PEC was 94% for Cd, 92% for Cr and Cu, 91% for Ni, and 90% for Pb and Zn. Hence the values of the consensus-based PECs for these metals provide a precise basis for prediction of toxicity in freshwater sediments.19 It must be emphasized, however, that SQGs should be used with caution, as there cannot be any guarantee of a complete absence of toxicity at concentrations lower than the TECs, or that samples which exceed the PECs must necessarily be toxic, particularly considering that the SQGs were not specifically developed for the biogeochemistry of the region under study. For greater assurance, it is important that the results obtained here should be validated using toxicity tests.
Conclusions
The distributions, the factors controlling concentrations and the toxicity risks of Co, Cr, Cu, Li, Mn, Ni, Pb, Zn, Al and Fe were investigated for surface sediments of the four rivers forming the Poxim river hydrographic sub-basin. Correlation analysis showed that inorganic carriers, such as clay minerals, were the main factors controlling the distribution of trace metals in the sediments. Lithium was shown to be a better normalizer than aluminium for determination of enrichment factors, and was used to define a regional geochemical baseline (RGB) for a majority of the metals analyzed. Use of the RGB, together with enrichment factors, showed that naturally occurring metals predominated in the surface sediment samples studied. Nevertheless, sediments from sites located in the most urbanized region were found to be enriched in Co, Cr, Cu, Ni, Pb and Zn, due to anthropogenic inputs. Sediments from the studied sites were classified as unpolluted to moderately polluted, according to the geoaccumulation index. Igeo.
Table 5. Geoaccumulation index of trace metals in Poxim River surface
sediments (n = 15)
Site Co Cr Cu Ni Pb Zn
1 −1.6 −1.1 −0.3 −0.8 −0.3 −1.1
2 −1.0 −1.4 −0.3 −0.3 −0.6 −0.7
3 −0.7 −1.0 −0.8 −1.0 −0.5 −0.7
4 −0.04 −0.8 −0.8 −0.8 −0.6 −0.6
5 −0.9 −0.8 −0.8 −0.8 −0.7 −0.6
6 −0.5 −0.3 −0.1 −0.4 −1.2 −0.4
7 0.5 0.3 1.0 0.8 −0.3 0.5
8 −0.5 −0.4 1.2 −0.2 0.5 0.7
9 −0.7 −0.7 −0.7 −0.7 −0.4 −0.7
10 −0.8 −0.5 −0.7 −0.6 −0.8 −0.3
11 −0.2 −0.3 −0.8 −0.2 −0.4 −0.8
12 −0.1 −0.4 −0.9 −0.2 −0.4 −0.5
13 −0.9 0.09 −0.4 −1.2 −0.5 −0.5
14 −0.8 −0.6 −0.6 −0.8 −0.7 −0.5
Metal concentrations in all samples were below the threshold effect concentration, established by the consensus-based sediment quality guidelines for freshwater ecosystems, indicating that adverse effects on aquatic biota, due to the presence of these trace metals, should rarely occur.
Acknowledgments
The authors gratefully acknowledge Dr. Andrew Allen (UNESP-Araraquara) for his assistance with the English in this manuscript and CNPq (Process 620065/2004-4) and CAPES for financial support of this study.
References
1. Manahan, S. E.; Environmental Chemistry, 6th ed., Lewis
Publishers: Chelsea, Boca Raton, USA, 1994, p. 811. 2. Hatje, V.; Santos, D. S. S; Korn., M. G. A.; J. Braz. Chem. Soc.
2006,17, 357.
3. Alves, J. P. H.; Passos, E. A.; Garcia, C. A. B.; J. Braz. Chem. Soc.2007,18, 748.
4. Aloupi, M.; Angelidis, M. O.; Mar. Environ. Res.2001,52, 1. 5. Green-Ruiz, C.; Páez-Osuna, F.; Environ. Int.2001,26, 265. 6. Acevedo-Figueroa, D.; Jiménez, B. D.; Rodríguez-Sierra, C.
J.;Environ. Pollut. 2006,141, 336.
7. Matthai, C.; Birch, G.; Mar. Pollut. Bull.2001,42, 1055.
Table 6. Metals (partial concentration in dry sediment) in Poxim river surface sediments (n = 3, mean ± standard deviation), and consensus-based sediment
quality guidelines for freshwater sediments19
Site Co/(µg g-1) Cr/(µg g-1) Cu/(µg g-1) Mn/(µg g-1) Ni/(µg g-1) Pb/(µg g-1) Zn/(µg g-1)
1 0.2± 0.02 3.4± 0.2 3.7± 0.2 2.1± 0.2 0.8± 0.02 3.7± 0.3 4.6± 0.2 2 0.8± 0.03 2.1± 0.1 3.2± 0.2 13.4± 0.9 1.9± 0.8 3.2± 0.3 7.5± 0.5 3 1.9± 0.1 6.9± 0.2 3.8± 0.3 80.1± 7.1 3.8± 0.2 5.8± 0.4 15.4± 1.3 4 2.3± 0.1 8.0± 0.5 3.4± 0.3 73.1± 6.3 3.4± 0.1 6.4± 0.6 12.7± 0.7 5 2.6± 0.2 15.8± 1.5 5.0± 0.5 28.4± 2.4 9.3± 0.5 4.8± 0.3 34.2± 2.7 6 2.8± 0.2 20.4± 1.6 12.4± 0.8 35.6± 2.5 11.3± 1.1 3.5± 0.2 36.3± 2.2 7 4.1± 0.2 14.0± 1.4 10.8± 0.2 41.9± 2.8 14.1± 0.9 4.2± 0.2 42.1± 3.1 8 4.5± 0.2 26.3± 2.1 27.9± 2.3 113± 9 15.8± 1.2 20.2± 1.7 67.1± 5.2 9 4.9± 0.3 23.6± 1.8 11.3± 0.4 117± 11 12.0± 0.6 11.3± 0.9 45.9± 2.9 10 1.1± 0.1 10.3± 0.5 5.7± 0.5 9.8± 0.7 7.4± 0.4 2.5± 0.3 19.2± 1.3 11 3.7± 0.2 16.7± 0.8 5.8± 0.4 43.9± 3.4 8.0± 0.3 6.1± 0.3 20.0± 1.2 12 3.3± 0.1 11.8± 0.6 3.7± 0.3 40.6± 4.1 7.3± 0.3 5.7± 0.4 18.8± 2.0 13 0.6± 0.03 12.5± 0.7 3.7± 0.3 44.7± 3.9 0.3± 0.02 2.1± 0.2 6.7± 0.6 14 1.4± 0.2 9.1± 0.4 3.8± 0.2 28.0± 1.8 2.8± 0.1 2.6± 0.3 15.9± 1.1 15 3.5± 0.2 16.5± 0.6 15.0± 1.3 72.4± 4.3 8.6± 0.5 4.2± 0.2 63.9± 5.9
TEC * 43.4 31.6 * 22.7 35.8 121
PEC * 111 149 * 48.6 128 459
* not evaluated by the SQG; TEC = threshold effect concentration, PEC = probable effect concentration.
8. Loring, D. H.; Mar. Sci. 1990,29, 155.
9. Loring, D. H.; Rantala, R. T. T.; Earth-Sci. Rev. 1992, 32, 235.
10. Loring, D. H.; ICES J. Mar. Sci. 1991,48, 101.
11. Hansen, D. J.; Berry, W. J.; Mahony, J. D.; Boothman, W. S.; Di Toro, D. M.; Robson, D. L.; Ankley, G. T.; Ma, D.; Yan, Q.; Pesh, C. E.; Environ. Toxicol. Chem.1996,15, 2080. 12. US EPA (United States Environmental Protection Agency), The
incidence and severity of sediment contamination in surface waters of the United States. Volume 1: National sediment quality survey. EPA 823-r-97-006, Office of Science and Technology, Washinton, DC,1997.
13. Rauret, M. S.; Talanta1998,46, 449. 14. Tuzen, M.; Microchem. J. 2003,74, 105.
15. Scuouller, R. C.; Snape, I.; Strark, J. S.; Gore, D. B.;
Chemosphere 2006,65, 294.
16. Caeiro, S.; Costa, M. H.; Ramos, T. B.; Fernandes, F.; Silveira, N.; Coimbra, A.; Medeiros, G.; Painho, M.; Ecol. Indic. 2005, 5, 151.
17. Long, E. R.; MacDonald, D. D.; Smith, S. L.; Calder, F. D.;
Environ. Manage. 1995,19, 81.
18. Long, E. R.; MacDonald, D. D.; Hum. Ecol. Risk Assess. 1998,
4, 1019.
19. MacDonald, D. D.; Ingersoll, C. G.; Berger, T. A.; Arch. Environ.
Contam. Toxicol. 2000,39, 20.
21. Persaud, D.; Jaagumagi, R.; Hayton, A.; Guidelines for the Protection and Management of Aquatic Sediment Quality in
Ontário, Water Resources Branch, Ontario Ministry of the
Environment: Toronto, 1993.
22. EC, MENVIQ (Environment Canada and Ministere de l’Environnement du Quebec); Interim Criteria for Quality
Assessment of St. Lawrence River Sediment, Environment
Canada: Ottawa, 1992.
23. Long, E. R.; Morgan, L. G.; The Potential for Biological Effects of Sediment-Sorbed Contaminants Tested in the National Status
and Trends Program, NOAA Technical Memorandum NOS
OMA 52, National Oceanic and Atmospheric Administration: Seattle, WA, 1991.
24. US EPA (United States Environmental Protection Agency); Calculation and Evaluation of Sediment Effect Concentrations for the Amphipod Hyalella azteca and the Midge Chironomus
riparius, EPA 905-R96-008, Great Lakes National Program
Office, Region V: Chicago, IL, 1996.
25. Silva, A. S.; Buschinelli, C. C. A.; Rodrigues, I. A.; Machado, R. E.; Índice de Sustentabilidade Ambiental do uso da Agua
(ISA_Água): municípios da região do entorno do rio Poxim, SE;
Jaguariúna, SP, Brasil: Embrapa Meio Ambiente (Boletim de Pesquisa e Desenvolvolvimento), http://www.cnpma.embrapa. br/download/boletim_22.pdf, acessed in May 2007.
26. IBGE (Instituto Brasileiro de Geografia e Estatística); Base de
Informações Municipais, Estado de Sergipe, http://www.ibge.
gov.br/estadosat/perfil.php?sigla=se, acessed in May 2007. 27. Aguiar Netto, A. O.; Ferreira, R. A.; Garcia, C. A. B.; Alves, J. P.
H.; Diagnóstico e Avaliação da Sub-Bacia Hidrográfica do Rio
Poxim, Unpublished work, São Cristóvão, SE, Brasil, 2006, 245p.
28. Forstner, U.; Salomons, W.; Environ. Tech. Lett. 1980,494. 29. Windom, H. L.; Schopp, S. J.; Calder, F. D.; Ryan, J. D.;
Smith Jr., R. G.; Burney, L. C.; Lewis, F. G.; Rawlinson, C.
H.;Environ. Sci. Technol.1989,23, 314.
30. Liaghati, T.; Preda, M.; Cox, M.; Environ. Int. 2003,29, 935. 31. Rubio, B.; Nombela, M. A.; Vilas, F.; Mar. Poll. Bull.2006,
370, 278.
32. Chatterjee, M.; Silva Filho, E. V.; Sarkar, S. K.; Sella, S. M.; Bhattacharya, A.; Satpathy, K. K.; Prasad, M. V. R.; Chakraborty, S.; Bhattacharya, B. D.; Environ. Int. 2007, 33, 346.
33. Shrestha, S.; Kazama, F.; Environ. Mod. Soft. 2007,22, 464. 34. Moreira-Turcq, P.; Jouanneau, J. M.; Turcq, B.; Seyler,
P.; Weber, O.; Guyot, J. L.; Palaeogeogr. Palaeoclimatol.
Palaeoecol. 2004,214, 27.
35. Hussain, M.; El Hassan, W.; Abdulraheem, M. A.; Mar. Petrol.
Geol.2006,23, 703.
36. Cobelo-García, A.; Prego, R.; Mar. Poll. Bull. 2003, 46, 1253.
37. Baptista Neto, J. A.; Smith, B. J.; Mcallister, J. J.; Environ. Poll.
2000,109, 1.
38. Muller, G.; Geol. J. 1969,2, 109.
39. Readdy, M. S.; Basha, S.; Kumar, V. G. S.; Joshi, H. V.; Ramachandraiah, G.; Mar. Poll. Bull. 2004,48, 1055. 40. Farkas, A.; Erratico, C.; Viganò, L.; Chemosphere 2007, 68, 761. 41. Mil-Homens, M.; Stevens, R. L.; Abrantes, F.; Cato, I.; Cont.
Shelf Res. 2006,26, 1184.
42. Zheng, N.; Wang, Q.; Liang, Z.; Zheng, D.; Environ. Poll.2008, 154, 135.
43. Hortellani, M. A.; Sarkis, J. E. S.; Abessa, D. M. S.; Souza, E. C. P. M.; Quim. Nova 2008,31, 10.