Artigo
*e-mail: lcmarchi@esalq.usp.br
PHYSICOCHEMICAL COMPOSITION OF Apis mellifera HONEY SAMPLES FROM SÃO PAULO STATE, BRAZIL
Luís Carlos Marchini*
Departamento de Entomologia, Fitopatologia e Zoologia Agrícola, Escola Superior de Agricultura “Luiz Queiroz”, Universidade de São Paulo, Av. Pádua Dias, 11, 13418-900 Piracicaba – SP, Brasil
Augusta Carolina de Camargo Carmello Moreti and Ivani Pozar Otsuk
Instituto de Zootecnia/Agência Paulista de Tecnologia dos Agronegócios/ Secretaria de Agricultura e Abastecimento, Rua Heitor Penteado, 56, 13460-000 Nova Odessa – SP, Brasil
Geni da Silva Sodré
Escola de Agronomia, Centro de Ciências Agrárias Biológicas e Ambientais, Universidade Federal do Recôncavo da Bahia, 44380-000 Cruz das Almas – BA, Brasil
Recebido em 28/9/06; aceito em 23/3/07; publicado na web em 6/8/07
This research, developed with Apis mellifera honey samples from producers of São Paulo State, Brazil, has the objective of verifying how eucalyptus, wild flower, and orange honey samples would be clustered, based on physicochemical characteristics. All the orange honey samples and some wild flower ones formed distinct groups, thus confirming that the floral source interferes with honey characteristics. Eucalyptus and some of the wild flower honey samples were clustered together because of the great floral source variation in the latter ones. The characteristics that influence sample clustering are acidity and electric conductivity on the X axis, and total sugars and pH on the Y axis.
Keywords: cluster analysis; Apis mellifera; honey composition.
INTRODUCTION
Honey in Brazil can be produced all year round owing to a diverse flora, as a consequence of the country’s vast territory and climatic variability. Since honey is the result of dehydration and transformation of nectar collected by bees, the amount of honey produced from a given plant varies with factors that influence nectar yield and concentration, in addition to the concentration and proportion of its carbohydrates, number of flowers in the area, and number of days during which the flowers secrete nectar1.
Honey composition basically depends on the nectar composition of each producing plant species, conferring specific characteristics to it, while climatic conditions and management on the part of the beekeeper have less influence2. Knowledge about the floral source of honey is very important to characterize the product; therefore, the pollen analysis of honey is an important tool in recognizing bee forage plants as nectar and pollen supplies3.
The botanic origin of honey samples decisively affects their physicochemical characteristics. This allowed the formation of distinct groups or sub-groups when sample composition was studied by cluster analysis in samples from the State of Tocantins4, in Brazil. Several papers conducted using eucalyptus and citrus honey samples from different Brazilian regions make reference to the physicochemical composition of the samples, by analyzing moisture, electric conductivity, protein, ash content, pH, acidity, formaldehyde index, diastatic activity, HMF, total sugars, reducing sugars, apparent sucrose, and viscosity5-9.
This research, developed with Apis mellifera honey samples from various municipalities in the State of São Paulo, Brazil, aimed to verify how eucalyptus, wild, and orange honey samples would be clustered, based on their physicochemical characteristics.
EXPERIMENTAL
The honey samples (a 205 total) were obtained by means of direct contact with beekeepers from different localities in the State of São Paulo, Brazil, being collected during different seasons of the year depending on floral source (eucalyptus, wild, or orange), packaged in glass jars properly labeled with information about the production site, and then taken to the laboratory.
The physicochemical and pollen analyses of honeys produced by Apis mellifera were performed at the Beekeeping Laboratory of Departamento de Entomologia, Fitopatologia e Zoologia Agrícola of Escola Superior de Agricultura “Luiz de Queiroz”, Piracicaba campus, Universidade de São Paulo.
All samples were submitted to the acetolysis method and then submitted to a qualitative and a quantitative analysis10. The physicochemical analyses were carried out only after the honey samples were subjected to the pollen analysis.
Physicochemical analyses
The moisture of the various honey samples was determined by means of a manual Atago refractometer (natural light, room temperature), specific for use with honey11. This device was adapted from the Abbé refractometer and has a high contrast field of view12. Ash determination by calcination in a muffle at 550 ºC until constant weight, diastase index and Hydroxymethylfurfural was performed according to the methodology cited in the Brazilian legislation12.
Honey proteins were determined following the micro-Kjeldahl method cited in the analytical regulations of Instituto Adolfo Lutz15; a factor of 6.25 was used in the protein value calculations.
Viscosity was determined by means of a model 100S Brookfield digital viscometer (25 ± 1 oC); the technique consists in measuring the torque generated by the resistance offered by the fluid to rotary movement16.
Cluster analysis
The data were analyzed by multivariate analysis, using the princi-pal components analysis to evaluate the importance of each physicochemical trait studied over the total variation available17. This technique is based on the standardization and rotation of the orthogonal axes (physicochemical character), generating a new set of coordinates (principal components) not correlated among themselves18.
In the cluster analysis, the mean Euclidean distances for the properly standardized data were adopted as dissimilarity means, according to Bussab et al.19. Clusters were formed by the UPGA (unweighted pair-group average) method.
RESULTS AND DISCUSSION Physicochemical analyses
Although the Brazilian legislation establishes that honey moisture should not exceed 20%12, in the present work 17.82% of the 50 orange honey samples, 18.81% of the 128 wild honey samples, and 19.30% of the 27 eucalyptus ones (Table 1), totaling 48 samples (23.4% of the total) showed a moisture content higher than the allowed value. Therefore, a considerable percentage of these honey samples does not comply with the quality regulations for Brazilian honey12, a fact also observed by Cano et al.6 inhoney samples consumed in São Paulo, SP, Brazil, and by Cano et al.8 in Brazilian honey samples from eucalyptus and orange flowers, with average moisture contents near those obtained by Cortopassi-Laurino5, Costa et al.7, and those in the present work. The explanation for the high water content found in this experiment, especially in eucalyptus honey samples, could be that the honey was harvested from uncapped frames, in addition to the storage period; thus, the honey may have absorbed moisture from the environment.
Great variation in electric conductivity values was observed among the samples analyzed (Table 1). The mean (1021.48 µS cm1) obtained for eucalyptus honey samples from different localities in the State of São Paulo can be considered high when compared with the mean value of 448.60 µS cm-1, found for commercial eucalyptus honey samples from Spain20, with an average of 628.83 mS cm-1 observed for wild honey and 346.93 µS cm-1 verified for orange honey, while in the northern coast of the State of Bahia, Brazil, electric conductivity in honey samples ranged from 271.67 to 1634.00 µS cm-1, with an average of 780.70 µS cm-1 21.
The mean protein percentages found were 0.31% for eucalyptus honey, 0.20% for wild honey, and 0.16% for orange honey (Table 1). These values were not very different from those obtained for different Italian honey samples22,23.
The ash percentage found in honey expresses its richness in mineral material, and constitutes a frequently used parameter in determinations intended to verify honey quality. Brazilian law has established that the maximum ash content present in honey should be 0.60%12. Therefore, based on the law, it can be seen that the eucalyptus, wild, and orange honey samples in our experiment showed mean ash percentages below the allowed maximum, and thus conform to the regulations for good quality honey (Table 1). The mean ash percentage in the eucalyptus honey samples analyzed
was 0.16%; this value is a little lower than the 0.20% found in commercial eucalyptus honey samples from Spain20; for wild honey, the mean obtained was 0.26%, while for orange honey the mean was 0.24%, a little higher than the 0.20% value observed in the Spain samples20.
The pH values of 3.62; 3.39; and 3.19 found in eucalyptus, wild, and orange honey, respectively (Table 1), are near those obtained for Brazilian21,24,25, Argentine26, and Portuguese honey27.
The mean acidity values obtained were 33.85 mEq kg-1 for eucalyptus honey, 27.79 mEq kg-1 for wild honey, and 21.72 mEq kg-1 for orange honey; these values are near those observed in various Brazilian honey samples21,24 and higher than the mean obtained by Costa et al.7. Twenty-one from 173 honey samples sold in the city of São Paulo, Brazil (36.2%) showed acidity values above the allowed limit6, while in the present work these values were 14.81% for eucalyptus honey, 2.34% for wild honey, and 2% for orange honey; these percentages are much lower than the 36.2% submitted by those authors.
The formaldehyde index values found for eucalyptus honey ranged from 5.00 to 12.50 mL kg-1, with an average of 6.91 mL kg-1; from 4.00 to 20.50 mL kg-1 with an average of 9.91 mL kg-1 for wild honey; and from 4.70 to 9.50 mL kg-1 with an average of 6.91 mL kg -1 for orange honey. These values are near those obtained by Temiz28 and Sodré et al.21.
The diastatic activity for the 205 honey samples analyzed in the present work ranged from 1.10 to 38.50 (Gothe scale), with an average value of 15.77 for eucalyptus honey; 17.32 for wild honey; and 8.14 for orange honey (Table 1), while in honey samples of the State of São Paulo from different floral sources7 values ranged from 7.80 to 19.00 (Gothe scale); in honey from Portugal, values ranged from 13.00 to 51.10 (Gothe scale)27, and in honey from the northern coastal region of the State of Bahia values ranged from 16.66 to 62.81 (Gothe scale), with a mean value of 34.1121. Because the limit established by Brazilian law12 for diastatic activity is at least 8, we have that 1 eucalyptus honey sample (3.70%), 4 wild honey samples (2.25%), and 16 orange honey samples (32.00%) did not meet the specifications.
The average amounts of hydroxymethylfurfural (HMF) found in the honey samples analyzed were 17.46 mg kg-1 for eucalyptus honey, 15.14 mg kg-1 for wild honey, and 54.06 mg kg-1 for orange honey (Table 1) and the limit established by Brazilian law12 is 60 mg kg-1; thus, one eucalyptus honey sample (3.70%), one wild honey sample (0.78%), and 14 orange honey samples (28%) did not meet these specifications. In honey samples from the northern coastal region of Bahia21 the values ranged from 1.50 to 136.00 mg kg-1, with an average of 24.33 mg kg-1. Costa et al.7 and Dayrell and Vital29 verified that the majority of Brazilian samples showed adequate HMF contents, indicating the use of good pratices by beekeepers, with values ranging from 1.10 to 248.20 mg kg-1, while for Portuguese honey samples, values from 1.70 to 94.90 mg kg-1 were observed30. White Jr.31 mentioned that honey samples from subtropical countries may have naturally high HMF values regardless of the fact that the honey was not overheated or adulterated, due to high temperatures; however, it is essential to quantify this component in order to check on product quality, as it is an indicator of heating, storage, and adulteration with inverted sugar.
showed a reducing sugars value of 53.20%, therefore below the minimum required by law, which is 65%. With regard to sucrose, one eucalyptus honey sample (3.27%), 14 wild honey samples (10.94%), and one orange sample (2.00%) had higher values than the 6% allowed by law; this fact was also observed by Cano et al.6, that is, 10.3% of honey samples sold in the city of São Paulo, São Paulo, Brazil, contained apparent sucrose values above those allowed by current Brazilian law12.
It can be seen that there was considerably great variation in the observed values for viscosity in orange honey samples, with an average of 1,461.16 (mPa.s) (25 oC); such average is much smaller than the averages observed in honey samples of different botanical sources from Libya and Egypt (ranging from 49.51 to 472 Pa.s at 20 °C)33, in Calluna vulgaris honey produced in Spain (viscosity variation from 5,198 to 17,325 cP (20.5 °C))34, andhoney samples from the states of Minas Gerais and Santa Catarina, in Brazil32. The variation interval from 0.098 to 5.09Pa.s observed in the present paper (25 °C) (Table 1) is near those obtained in Chinese honey of different floral sources at the same temperature35 and those verified in samples from the states of Ceará, Piauí, and Pernambuco, in Brazil (mean viscosity of 1,607 mPa.s.)21 .
Cluster analysis
The principal components and cluster analysis of the 205 honey samples was conducted for all 13 physicochemical characters shown in Table 1, and the variance estimate results (eigenvalues) obtained are presented in Table 2.
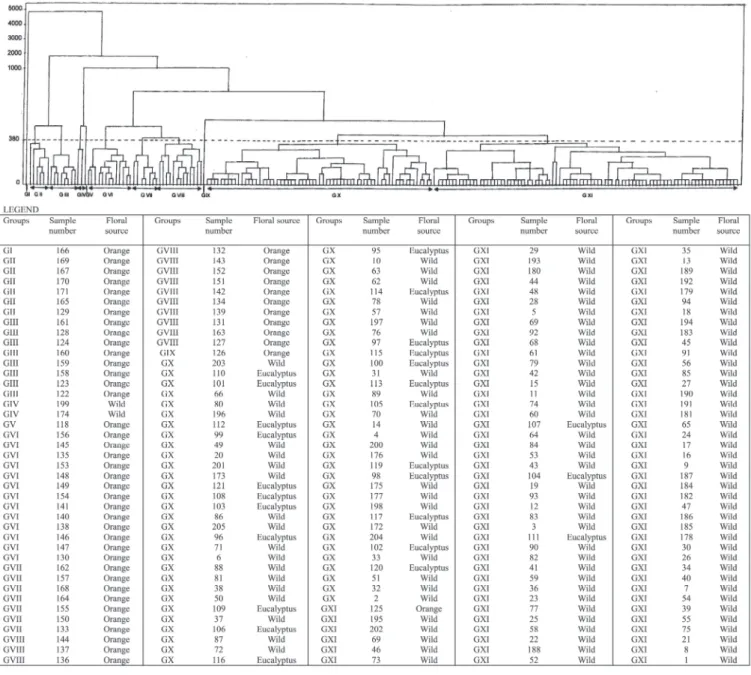
From Table 2 it can be observed that the first five components concentrated 75.39%. Mardia et al.17 stated that, when in a prin-cipal components analysis the first two or three components accumulate a relatively high percentage of total variation, in ge-neral above 70%, these would explain the variability manifested among evaluated varieties. In the present case, it can be seen that five principal components were required to explain 70% of total variance; thus, considerable variance dispersion can be verified in the material under study; this is why we chose to use Cluster analysis (Figure 1).
From Figure 1 it can be seen that five groups were formed, which can be identified as follows: 154 samples were clustered in group I; three samples in group III; 14 samples in group IV; and one sample in group V.
In the present work, the optimal cutoff point selected was 380, represented by the dashed line in Figure 1; this point was based on the identification of a plateau in the vertical direction, which means that many groups were formed at the same link distance; this distance is the optimal cutoff point for the phenogram, establishing the number of groups formed.
It can be observed that orange honey samples were all clustered in the first subgroup of group I, except for sample number 125, which, although also belonging in group I, did not fall within the first subgroup (Figure 1). The other subgroups that comprise group I are formed by eucalyptus and wild honey samples, which can be explained by the fact that samples declared as wild come from different floral sources, many of them polyfloral, without dominance of one or another plant species.
In Figure 1, it can also be seen that the other groups formed (II, III, IV, and V) are all composed of wild honey samples (totaling 51 samples, i.e., 40% of all wild honey samples).
From the principal components analysis, it can be verified that the characters that influenced honey sample clustering the most were acidity and electric conductivity on the X axis, and total sugars (AT) and pH on the Y axis.
Table 2. Variance estimates (eigenvalues) and cumulative percent-age of total variance (%), obtained by principal components analysis considering 205 honey samples and 13 physicochemical characters
Honey samples
Principal components Eigenvalues Cumulative percentage
Y1 3.466 26.67
Y2 2.285 44.23
Y3 1.577 56.36
Y4 1.347 66.73
Y5 1.126 75.39
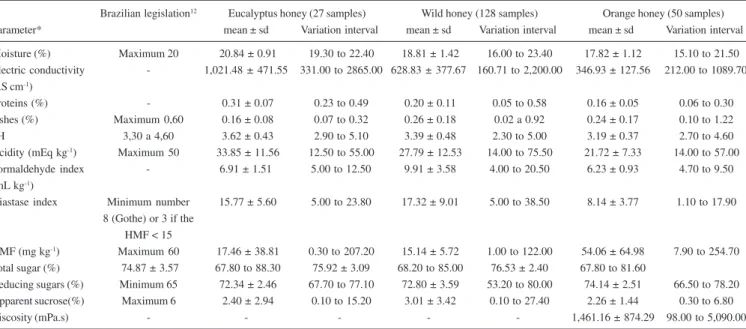
Table 1. Means, standard deviations, and variation intervals for moisture, electric conductivity, protein, ash, pH, acidity, formaldehyde index, diastase index, HMF, sugars, and viscosity in honey samples from different municipalities in the State of São Paulo
Brazilian legislation12 Eucalyptus honey (27 samples) Wild honey (128 samples) Orange honey (50 samples)
Parameter* mean ± sd Variation interval mean ± sd Variation interval mean ± sd Variation interval
Moisture (%) Maximum 20 20.84 ± 0.91 19.30 to 22.40 18.81 ± 1.42 16.00 to 23.40 17.82 ± 1.12 15.10 to 21.50
Electric conductivity - 1,021.48 ± 471.55 331.00 to 2865.00 628.83 ± 377.67 160.71 to 2,200.00 346.93 ± 127.56 212.00 to 1089.70 (µS cm-1)
Proteins (%) - 0.31 ± 0.07 0.23 to 0.49 0.20 ± 0.11 0.05 to 0.58 0.16 ± 0.05 0.06 to 0.30 Ashes (%) Maximum 0,60 0.16 ± 0.08 0.07 to 0.32 0.26 ± 0.18 0.02 a 0.92 0.24 ± 0.17 0.10 to 1.22
pH 3,30 a 4,60 3.62 ± 0.43 2.90 to 5.10 3.39 ± 0.48 2.30 to 5.00 3.19 ± 0.37 2.70 to 4.60 Acidity (mEq kg-1) Maximum 50 33.85 ± 11.56 12.50 to 55.00 27.79 ± 12.53 14.00 to 75.50 21.72 ± 7.33 14.00 to 57.00
Formaldehyde index - 6.91 ± 1.51 5.00 to 12.50 9.91 ± 3.58 4.00 to 20.50 6.23 ± 0.93 4.70 to 9.50 (mL kg-1)
Diastase index Minimum number 15.77 ± 5.60 5.00 to 23.80 17.32 ± 9.01 5.00 to 38.50 8.14 ± 3.77 1.10 to 17.90 8 (Gothe) or 3 if the
HMF < 15
HMF (mg kg-1) Maximum 60 17.46 ± 38.81 0.30 to 207.20 15.14 ± 5.72 1.00 to 122.00 54.06 ± 64.98 7.90 to 254.70
Total sugar (%) 74.87 ± 3.57 67.80 to 88.30 75.92 ± 3.09 68.20 to 85.00 76.53 ± 2.40 67.80 to 81.60
Reducing sugars (%) Minimum 65 72.34 ± 2.46 67.70 to 77.10 72.80 ± 3.59 53.20 to 80.00 74.14 ± 2.51 66.50 to 78.20
Apparent sucrose(%) Maximum 6 2.40 ± 2.94 0.10 to 15.20 3.01 ± 3.42 0.10 to 27.40 2.26 ± 1.44 0.30 to 6.80
Viscosity (mPa.s) - - - 1,461.16 ± 874.29 98.00 to 5,090.00
According to Bogdanov36, electric conductivity is considered a good criterion to indicate honey floral source, because it is influenced by acids and by ash content. Honey samples from different floral sources have different electric conductivity values.
CONCLUSIONS
Because the wild honey samples came from different floral sources, they did not all have the same behavior with regard to physicochemical characters; some were clustered together, while others were near eucalyptus honey.
Floral source crucially interferes with honey characteristics. The mean values for the parameters analyzed, mentioned in current laws, are within the established limits, except for moisture in eucalyptus honey samples, which showed a mean a little above the maximum prescribed in the regulations.
Among the 205 honey samples from the State of São Paulo that were analyzed, orange honey samples form a distinct subgroup with regard to physicochemical characters.
Figure 1. UPGMA phenogram and mean Euclidean distances for 205 Apis mellifera honey samples from the State of São Paulo
REFERENCES
1. Crane, E.; Honey: a comprehensive survey, Heinemann: London, 1975. 2. White Júnior, J. W.; Adv. Food Res. 1978, 22, 287.
3. Barth, O. M.; O pólen no mel brasileiro, Luxor: Rio de Janeiro, 1989. 4. Marchini, L. C.; Sodré, G. da S.; Moreti, A. C. de C. C.; Otsuk, I. P.; B.
Indústr. Anim. 2004, 61,101.
5. Cortopassi-Laurino, M. ; Gelli, D. S. ; Apidologie 1991,22, 61. 6. Cano, C. B.; Zamboni, C. Q.; Alves, H. I.; Spiteri, N.; Atui, M. B.; Santos,
M. C.; dos Jorge, L. I. F.; Pereira, U.; Rodrigues, R. M. M.; Revista do Instituto Adolfo Lutz 1992, 52, 1.
7. Costa, L. S. M.; Albuquerque, M. L. S.; Trugo, L. C.; Quinteiro, L.; Barth, O. M.; Ribeiro, M.; De Maria, C. A. B.; Food Chem. 1999, 65, 347. 8. Cano, C. B.; Felsner, M. L.; Mattos, J. R.; Bruns, R. E.; Watanabe, H. M.;
Muradian, L. B.; J. Food Composition Analysis 2001, 14, 101. 9. Moreira, R. F. A.; De Maria, C. A. B.; Quim. Nova 2001, 24, 516. 10. Erdtman, G.; Pollen morphology and plant taxonomy – Angiosperms.,
Almqvist & Wiksell: Stockholm, 1952. 11. Atago Co.; Abelhas 1988, 31, 9.
12. Brasil, Ministério da Agricultura; Diário Oficial, Brasília, 20/10/2000 Seção 1, 16.
14. Boletin Oficial Español, Madrid, 18/6/1986, p. 145.
15. Pregnolato, W.; Pregnolato, N. P.; Normas analíticas do Instituto Adolfo Lutz, 3ª ed., Instituto Adolfo Lutz: São Paulo, 1985, vol. 1.
16. American Society for Testing and Materials (A.S.T.M.); Standard Test Methods for Rheological Properties of Non-Newtonian Materials by Rotation (Brookfield type) Viscometer, ASTM Standards: Barr Harbor, without publication date.
17. Mardia, L. V.; Keni, J. T.; Bibby, J. M.; Multivariate analysis, Academic Press: London, 1979.
18. Morrison, D. F.; Multivariate statistical methods, 2nd ed., Mc Graw-Hill: Tokyo, 1981.
19. Bussab, W. O.; Andrade, D. F.; Myazaky, E. S.; Anais do 9º Simpósio Nacional de Probabilidade e Estatística, São Paulo, Brasil, 1990. 20. Gomez, M. E. M.; Hernandez, E. G.; Gomez, J. Y. M.; Marin, J. L. M.; J.
Apicultural Res. 1993, 32, 121.
21. Sodré, G. S.; Marchini, L. C.; Carvalho, C. A. L. de; Revista de Agricultura 2002, 77, 243.
22. Cirilli, G.; Papagheorgheu, A.; Savigni, G.; Industrie Alimentari 1973, 12, 74. 23. Campus, R.; Madau, G.; Salinas, B.; Tecnologie Alimentari 1983, 6, 10.
24. Pamplona, B. C.; Dissertação de Mestrado, Universidade de São Paulo, Brasil, 1989.
25. Azeredo, M. A. A.; Azeredo, L. da C.; Ciência e Tecnologia de Alimentos 1999, 19, 3.
26. Baldi-Coronel, B.; Dall’Ogllio, A. M.; Lezcano, S.; Alimentación Latinoamericana 1993, 39, 39.
27. Andrade, P. B.; Amaral, M. T.; Isabel, P.; Camargo, J. C. M. F.; Seabra, R. M.; Cunha, A. P.; Food Chem. 1999, 66, 503.
28. Temiz, A. I.; Ege Bolge Zirai Arastirma Enstitusu Yayinlari 1983, 31, 113. 29. Dayrell, I. O.; Vital, N. C.; Ciência e Tecnologia de Alimentos 1991, 1, 137. 30. Mendes, E.; Proença, E. B.; Ferreira, I. M. P. L. V. O.; Ferreira, M. A.;
Carbohydr. Polym. 1998, 37, 219. 31. White Jr., J. W.; Am. Bee J. 1992, 132, 792.
32. Campos, G.; Tese de Doutorado, Universidade Federal de Minas Gerais, Brasul, 1998.