Food Science and Technology ISSN 0101-2061
DI:
D http://dx.doi.org/10.1590/1678-457X.0023
1 Introduction
The industrialization of cassava (Maninhotesculenta) involves the separation of soluble sugars and fibers resulting in a purified starch and its residues, peel and bagasse. Cassava peel is the residue from the root pre-cleaning that reaches industry, comprising peel (composed of cracked bark), inner peel (between cortex layer and central cylinder) and cassava tips (Michelan et al., 2006). These residues are used for animal feed, but causes serious environmental problems. Cassava residue is rich in fiber and residual starch (Leaes et al., 2013).
Besides being used as an energy source, starch is widely used by the food industry as an ingredient in food systems (Serrano & Franco, 2005). But not always starch, in its native form, has the appropriate physical and chemical properties for certain types of processing. The modification of starch involves changing the physical and chemical properties of native starch and aims to improve its functional and technological characteristics and can be used to adapt the starch in various applications as a fat substitute in bakery and dairy products. It is also used as a stabilizer in sauces, pie fillings and puddings (Cereda et al., 2003; Singh et al., 2007).
Modified starches have been used as ingredients in various products, observing the changes in their apparent viscosity, reducing power, expansion properties for application in the food industry and their acceptance by the consumer (Silva et al.,
2006; Shirai et al., 2007; Matsuguma et al., 2009). In this way, enzymatic hydrolysis has been used as a technique that allows the transformation of unfermentescivel starch into fermentable sugars, which in turn can be converted into various products of interest, such as ethyl alcohol (Serrano & Franco, 2005; Rattanachomsri et al., 2009; Leaes et al., 2013; Sugumaran et al., 2014). There are few reports on the reuse of cassava peel, which is mainly destined for direct animal feeding, therefore, the aim of this study was to characterize the residue from cassava pre-cleaning and evaluate its enzymatic hydrolysis, enabling its use in fermentation processes for the production of various products such as alcohol and biofuels.
2 Materials and methods
The residue of cassava industrialization, the peel, of the IAC-12 cultivar (2008/2009 crop) was provided by Fecularia Bela Vista (Febela), located in Bela Vista de Goiás, Goiás State, Brazil. The enzymes used in starch hydrolysis, α-amylase (SPRING ALFA 125000) and amyloglucosidase (SPRING AG BR) were provided by Granotec do Brasil S.A.
The residue was collected directly from the production line of Febela, during the process of pre-washing the cassava, and stored in polyethylene plastic bags at chilling temperature (2 ± 1 °C) until use.
Utilization of residue from cassava starch processing for
production of fermentable sugar by enzymatic hydrolysis
Luciana Reis Fontinelle SDUTD1, Márcio CALIARI1*, Manoel Soares SDARES JÚNIDR1,
Fernanda Assumpção FIDRDA1, Marina Costa GARCIA1
Received 21 Jan., 2016 Accepted 18 Apr., 2016
1 Department of Food Engineering, School of Agronomy, Universidade Federal de Goiás – UFG, Goiânia, GO, Brazil
*Corresponding author: [email protected] Abstract
The aim of this study was to characterize and perform enzymatic hydrolysis of cassava peeling residue (peel and inner peel), mainly composed of peels and small pieces. Residue was sanitized, dried at 55 °C for 24 hours and ground. The obtained flour showed pH of 4.85; 72.53 g 100 g–1 moisture; 5.18 mL 1M NaDH 100 g–1 acidity; 60.68 g 100 g–1 starch; 1.08 g 100 g–1 reducing sugar; 1.63 g 100g–1 ash; 0.86 g 100 g–1 lipid and 3.97 g 100 g–1 protein. Enzymatic hydrolysis was carried out by means of rotational central composite design, analyzing the effects of concentrations of α-amylase enzyme (10 to 50 U g starch–1), and the amyloglucosidase enzyme (80 to 400 U g starch–1) on variable responses: percent conversion of starch into reducing sugars (RSC) and soluble solid content (SS). Highest values of RSC (110%) and SS (12 °Brix) were observed when using the maximum concentration of amyloglucosidase and throughout the concentration range of α-amylase. Enzymatic hydrolysis of cassava peel is feasible and allows the use of hydrolysate in fermentation processes for the production of various products, such as alcoholic drinks, vinegar, among others.
Keywords:Manihotesculenta Cranz; starch hydrolysate; α-amylase; amyloglucosidase; reducing sugars.
The cassava peel was sanitized with sodium hypochlorite at 200 ppm for 15 minutes. Then, it was dried in an oven with forced air circulation (Tecnal, TE-394/3) at 55 °C for 24 hours. Next, the material was ground in a mill with vertical rotor and fixed hammer (Marconi MA 090/CF) using sieves of 20 mesh, thus obtaining the flour of the peel from cassava pre-washing. The flour was vacuum-packed and kept cool until the analysis.
2.1 Physicochemical properties of residue flour
Samples of the residue were characterized for moisture, ash, protein, lipid, pH and titratable acidity according to ADAC (Association of Dfficial Analytical Chemists, 1997). The analysis of reducing sugars was performed following the method proposed by Miller (1959), with adaptations, using the 3-5 dinitrosalicylic acid (ADNS) and the starch was analyzed by microwave acid digestion (Cereda et al., 2003). Determination of moisture content in the sample was performed before and after the drying process. All other analyses were performed only on the residue flour.
2.2 Enzymatic hydrolysis of residue flour
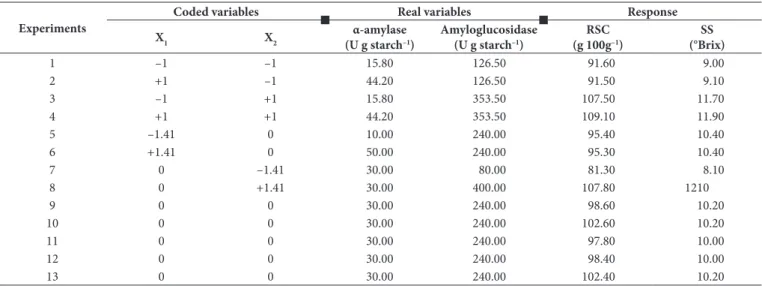
Enzymatic hydrolysis was conducted in accordance with Central Composite Rotational Design (CCRD) with two independent variables and five repetitions at the central point, totaling 13 experiments. The independent variables were the concentration of α-amylase and amyloglucosidase. The experiments were performed according to the values of variable levels and the planning matrix of CCRD presented in Tables 1 and 2, respectively.
For enzymatic hydrolysis, the starch was gelatinized by incubating a sufficient amount of flour to obtain a final concentration of 10% (m v–1) starch, in the initial presence of 40 mL distilled water, but considering the final volume of 50 mL with the further addition of buffer. The starch concentration used in this study was based on literature data, considering the maximum concentration of 10%, as higher concentrations for flour make the process unfeasible due to the high viscosity acquired mainly during gelatinization (Leonel et al., 1999; Ferreira et al., 2005; Bringhenti et al., 2007).
The gelatinization was then carried out in 250 mL Erlenmeyer flasks in Dubnoff water bath (Tecnal TE-053) at 70 °C for 30 minutes. After, the pH was adjusted to 4.5 by adding 10 mL sodium acetate buffer solution to a final concentration of 50 mM.α-amylase was added at the preset concentration for each experiment, and incubated in shaker flasks (Tecnal TE-421) at 40 °C, 100 rpm, for 2 hours (Bringhenti et al., 2007). Amyloglucosidase was added at the preset concentration for each experiment, and incubated at 60 °C, 100 rpm, for 24 hours.
Hydrolysates were characterized in triplicate as for conversion to reducing sugars (RSC) and soluble solids content (SS) according to the ADNS method and refractometry, respectively (Daiuto & Vilpoux, 2004).
The results obtained for the concentration of α-amylase and amyloglucosidase, with the enzymatic hydrolysis as response, were analyzed by statistical methods, using the software Statistica
7.0 and SAS (Statistical Analysis System, 6.11). The main and interaction effects of the independent variables were considered significant at a 95% confidence limit.
3 Results and discussion
3.1 Physicochemical properties of residue flour
The parameters analyzed in the residue flour were compared mainly to those existing for cassava flour, since there is no previous specific legislation and the lack of information in the literature. The residue flour had a pH of 4.85 (Table 1), considered slightly acidic (Prado et al., 2000). The cassava flours of the Acre State analyzed by Souza et al. (2008) also showed slightly acidic character.
The residue flour moisture was of 11.75 g 100 g–1 (Table 1), 9.62% lower than the maximum prescribed by law for cassava flour (13.00 g 100 g–1) (Agência Nacional de Vigilância Sanitária, 1995).
The moisture in the fresh residue analyzed by Prado et al. (2000) was 85.00 g 100 g–1, 17.19% higher than that found in the present study (72.53 g 100 g–1). The difference is common for this component and can be attributed to several factors, such as different varieties of cassava, planting and harvesting seasons (Dliveira & Moraes, 2009) besides industrial differences.
The acidity of the residue flour averaged 5.18 mL 1M NaDH 100 g–1, 42% above the maximum allowed by Brazilian law (3.00 mL 1M NaDH 100 g–1) (Agência Nacional de Vigilância Sanitária, 1995). The high acid content can indicate poor hygiene in the process and/or great exposure of the material to high temperatures, with increased fermentation (Dias & Leonel, 2006). The first hypothesis is unlikely, because this study was conducted under good sanitary conditions. The high acidity can be associated with the time between the acquisitions of samples until the flour processing steps.
The starch content of cassava peel was 60.68 g 100 g–1 (Table 1), a value 4%, 21% and 42% higher than those reported by Prado et al. (2000), Marques et al. (2000) and Menezes et al.
Table 1. Mean values for the parameters pH, moisture, total acidity, starch, reducing sugars conversion (RSC), ash, lipids and proteins of cassava peel flour.
Parameters Value
pH 4.85 ± 0.05
Moisture of flour (g 100 g–1)
11.75 ± 0.14
Moisture of cassava peel flour (g 100 g–1) 72.53 ± 0.09
Dry weight
Total Acidity
(mL NaDH 1M 100 g–1)
5.18 ± 0.13
Starch (g 100 g–1) 60.68 ± 1.86
Reducing sugar conversion (g 100 g–1)
1.08 ± 0.03
Ash (g 100 g–1) 1.63 ± 0.04
Lipids(g 100 g–1) 0.86 ± 0.02
(2004), respectively. The amount of starch in the cassava peel is related to the extraction process. In the peeling process, cassava passes through an apparatus called washer-peeler, whose rods, through rotary movements, promote the friction between the roots, thereby removing the peel of cassava. Depending on the setting of the equipment, the friction may cause a greater removal of cassava chips, consequently leading to a higher content of starch in the cassava peel and a higher amount of residue.
The value of reducing sugar found in cassava peel flour was 1.08 g 100 g–1. Among the cassava flours analyzed by Dias & Leonel (2006), the dry flour, thin and yellow, showed a similar amount of sugar (1.07 g 100 g–1) to this work. The amount of sugars in cassava is influenced by the natural fermentation occurring in the industry.
Ash values for cassava peel registered by Prado et al. (2000) (4.00 g 100g–1) and Marques et al. (2000) (2.20 g 100 g–1) were 145% and 35% higher than that found in this study, respectively. The high ash content can indicate the presence of inorganic dirts, like soil and sand (Dias & Leonel, 2006). The fact that, in this study, the cassava peel was washed and sanitized after collection may have contributed to a lower ash content compared to other studies, which did not mention such a procedure.
The lipid content determined in cassava peel was 0.86 g 100 g–1 (Table 1), 8% higher than that measured by Menezes et al. (2004) (0.80 g 100 g–1). Low lipid contents are due the composition of the cassava root, which has, on average, 0.30 g 100 g–1 of fatty matter (%dry weight) (Cereda et al., 2003; Dias & Leonel, 2006).
The cassava peel showed protein content of 3.97 g 100g–1 (Table 1), 7% and 15% higher than the values reported by Marques et al. (2000), (3.0g (100g)–1) and Prado et al. (2000) (3.37 g 100g–1), respectively. The protein content found by Menezes et al. (2004) in cassava peel (4.55 g 100g–1) was 15% higher than the value observed herein.
3.2 Enzymatic hydrolysis of residue flour
The linear effect of the concentration of amyloglucosidase (p = 0.000095) was significant, thus positively influencing the RSC, i.e., the increased concentration of amyloglucosidase promoted an increase in RSC (Table 2).
The equation of the fitted model was obtained according to regression coefficients and fitted to experimental data, showing which of the variables affect the response (RSC). Although the quadratic effects of the concentrations of α-amylase and amyloglucosidase were not significant, they were maintained to improve the fit. Dn the other hand, the linear effect of the concentration of α-amylase and the interaction effect of the concentration of α-amylase and amyloglucosidase were removed (Equation 1).
2 2
1 2 2
Y=100.15 2.32 X− +17.83X −3.11 X (1)
where: Y: response; X1: concentration of α-amylase (U g starch–1); X2: concentration of amyloglucosidase(U g starch–1); RSC: conversion into reducing sugars (g 100 g–1). Italic: although the effect is not significant at the 5% level of probability it contributed to the response.
The analysis of variance for RSC, run in SAS System 6.11, evidenced that the complete mathematical model was significant (p = 0.0017) and showed nob-significant lack of fitness (FA = 0.1143), coefficient of variation of 3.17 and coefficient of determination of 90%. Therefore, the results obtained show that the model can be used for predictive purposes.
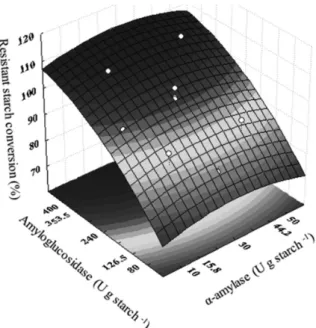
From the fitted model, we plotted response surface and contour plots, which represent the variation in RSC according to the concentrations of α-amylase and amyloglucosidase, as can be seen in Figure 1.
The conversion of starch into reducing sugars by enzymatic hydrolysis of cassava peel presented a range from 81% to 109%.
Table 2. Matrix for the Central Composite Rotational Design (CCRD) planning and average conversion value in reducing sugars and soluble solids content of the enzymatic hydrolysis of cassava peel.
Experiments
Coded variables Real variables Response
X1 X2 α-amylase
(U g starch–1)
Amyloglucosidase (U g starch–1)
RSC (g 100g–1)
SS (°Brix)
1 –1 –1 15.80 126.50 91.60 9.00
2 +1 –1 44.20 126.50 91.50 9.10
3 –1 +1 15.80 353.50 107.50 11.70
4 +1 +1 44.20 353.50 109.10 11.90
5 –1.41 0 10.00 240.00 95.40 10.40
6 +1.41 0 50.00 240.00 95.30 10.40
7 0 –1.41 30.00 80.00 81.30 8.10
8 0 +1.41 30.00 400.00 107.80 1210
9 0 0 30.00 240.00 98.60 10.20
10 0 0 30.00 240.00 102.60 10.20
11 0 0 30.00 240.00 97.80 10.00
12 0 0 30.00 240.00 98.40 10.00
13 0 0 30.00 240.00 102.40 10.20
Yields above 100% are normal, as the fractionation of starch into smaller chains is accompanied by the addition of a molecule of water (hydrolysis) for each bond broken, which leads to increase in the weight of fractionated starch and consequently an increase in yield. For example, in the theoretical total hydrolysis of starch into glucose molecules, 1 g starch would yield 1.1 g of glucose, a 110% yield. This yield increase is dependent on DE (Dextrose Equivalent), which also corresponds to the percentage of water molecules entering the starch chains (Surmely et al., 2003).
The response surface illustrated in Figure 1 demonstrates that the highest values (above 100 g 100 g–1) were observed when the sample was hydrolyzed with higher concentrations of amyloglucosidase(higher than 240 U g starch–1) and throughout the concentration range of α-amylase (10 to 50 U g starch–1), indicating that the minimum of α-amylase, 10 (U g starch–1), is sufficient for the maximum hydrolysis under the standardized conditions of this study. This was also verified by Saito & Cabello (2007), who studied different concentrations of α-amylase in hydrolysis of cassava pulp for ethanol production (1 KNU 4g starch–1, 1KNU8g starch–1 and 1 KNU 12g starch–1, in which KNU is enzyme unit). The tests indicated that the best concentration of α-amylase was 1 KNU 12g starch–1, i.e., the lowest concentration of enzyme was enough to produce the highest content of reducing sugar, because from this amount of enzyme, the reaction became saturated.
The linear effect of amyloglucosidase concentration of (p = 0) and the quadratic effect of α-amylase concentration (p = 0.0084) were significant; the amyloglucosidase concentration (L) produced greater effects on the responses of the SS content, followed by the concentration of α-amylase (Q). The influences were positive, i.e., increasing concentration of enzymes promoted an increase in SS content. As for the RSC response, the effect of amyloglucosidase concentration was linear, that is, with increasing content of SS according to the increase in the variable throughout the range
analyzed. The effect of α-amylase concentration was quadratic, indicating an increase in SS content to a certain point and a posterior reduction.
This was observed by Pradeep et al. (2010) in a study on the alcoholic fermentation of Ragi, a cereal widely consumed in South India. Liquefaction was performed with α-amylase at different concentrations (0.1-0.5% v/m) and the highest content of soluble solids was found when using 0.3% (v/w) enzyme. There was no increase in the SS content from this concentration, indicating that the enzymes became saturated with substrate.
In fitting the model, the linear effect of α-amylase concentration, although not significant, was maintained to improve the fit and the quadratic effect of amyloglucosidase concentration and the interaction effect of α-amylase and amyloglucosidase concentration were removed (Equation 2).
2
1 1
Y=10.14+0.255X +0.003X (2)
where: Y: response; X1: concentration of α-amylase (U g starch–1); X2: concentration of amyloglucosidase(U g starch–1); SS: content of soluble solids (°BRIX). Italic: although the effect is not significant at the 5% level of probability it contributed to the response.
The analysis of variance for the SS content, run in SAS System 6.11, showed that complete mathematical model was significant (p = 0), showing no significant lack of fitness (FA = 0.2696), coefficient of variation of 1% and 99% of the responses explained. Therefore, the results obtained indicate that the model can be used for predictive purposes.
From the fitted model, we plotted response surface and contour plots, which represent the variation in SS content according to the concentrations of α-amylase and amyloglucosidase, as seen in Figure 2.
Figure 1. Response surface graph of reducing sugars conversion (RSC), as a function of the concentration of α-amylase and amyloglucosidase for the enzymatic hydrolysis of cassava peel.
The soluble solids content in the enzymatic hydrolysis of cassava peel showed a variation from 8.1 to 12.1°Brix. The greatest SS values (above 12°Brix) were observed when the sample was hydrolyzed with higher concentrations of amyloglucosidase(above 296.75 U g starch–1) and throughout the concentration range of α-amylase (10 to 50 U g starch–1), the SS content is at its maximum with 30 U g starch–1 (Figure 2).
4 Conclusion
The main component of cassava peel is starch (60.68 g 100 g–1). The results obtained in the enzymatic hydrolysis of cassava peel show that the concentrations of α-amylase and amyloglucosidase influence the reducing sugars conversion and the total soluble solids content of the hydrolysate. The greatest RSC values (110%) and SS (12°Brix) were observed when using the maximum concentration of amyloglucosidase and throughout the concentration range of α-amylase.
Greater RSC values (above 100 g 100 g)–1) were found when hydrolyzing the sample with higher concentrations of amyloglucosidase (above 240 U g starch–1) and throughout the concentration range of α- amylase (10 to 50 U g starch–1). The higher SS values (above 12°Brix) were achieved when hydrolyzing the sample with higher concentrations of amyloglucosidase(above 296.75 U g starch–1) and throughout the concentration range of α-amylase (10 to 50 U g starch–1). Therefore, for the enzymatic hydrolysis of cassava peel, it is recommended to use 296.75 U g starch-1 of amyloglucosidase and 10 U g starch–1 of α-amylase.
The use of α-amylase and amyloglucosidase in hydrolysis of starch present in cassava peel proved to be feasible, enabling the use of the hydrolysate in fermentation processes for the production of various products such as alcoholic drinks, vinegar and bioethanol, among others, adding value to this residue derived mainly from starch manufacturers.
Acknowledgements
To CAPES for fellowship support.
References
Agência Nacional de Vigilância Sanitária – ANVISA. (1995). Norma de identidade, qualidade, apresentação, embalagem, armazenamento e transporte da farinha de mandioca (Portaria nº 554, de 30 de agosto de 1995). Diário Oficial da República Federativa do Brasil. Association of Dfficial Analytical Chemists – ADAC. (1997). Official
methods of analysis of AOAC International: agricultural chemicals, contaminants, drugs (Vol. 1, 16th ed.). Gaithersburg: ADAC International.
Bringhenti, L., Cabello, C., & Urbano, L. H. (2007). Alcoholic fermentation of starchy hidrolisated substrate with sugar cane residue. Ciência e Agrotecnologia, 31(2), 429-432. http://dx.doi.org/10.1590/S1413-70542007000200024.
Cereda, M. P., Vilpoux, D. F., & Takahashi, M. (2003). Balança hidrostática como forma de avaliação do teor de massa seca e amido. In M. P. Cereda (Ed.), Tecnologias, usos e potencialidades de tuberosas amiláceas latino americanas (pp. 30-46). São Paulo: Fundação Cargill.
Daiuto, M. P., & Vilpoux, D. E. R. (2004). Starch determination method for acid digestion by microwave. Revista ABAM, 2, 1-29.
Dias, L. T., & Leonel, M. (2006). Physico-chemical characteristics of cassava flours from different regions of Brazil. Ciência e Agrotecnologia, 30(4), 692-700. http://dx.doi.org/10.1590/S1413-70542006000400015. Ferreira, J. M., Swarnakar, R., & Silva, F. L. H. (2005). Effect of nutrient sources on bench scale vinegar production using response surface methodology. Revista Brasileira de Engenharia Agrícola e Ambiental, 9(1), 73-77. http://dx.doi.org/10.1590/S1415-43662005000100011. Leaes, E. X., Zimmermann, E., Souza, M., Ramon, A. P., Mezadri, E. T.,
Dal Prá, V. D., Terra, L. M., & Mazutti, M. A. (2013). Ultrasound-assisted enzymatic hydrolysis of cassava waste to obtain fermentable sugars. Biosystems Engineering, 115(1), 1-6. http://dx.doi.org/10.1016/j. biosystemseng.2013.02.001.
Leonel, M., Cereda, M. P., & Roaux, X. (1999). Utilization of the residue of the ethanol production from cassava fibrous waste, as source for fibre. Food Science and Technology, 19(2), 241-245. http://dx.doi. org/10.1590/S0101-20611999000200016.
Marques, J. A., Prado, I. N., Zeoula, L. M., Alcalde, C. R., & Nascimento, W. G. (2000). Evaluation of cassava and its industrial residues in
replacement of corn on performance of feedlot heifers. Revista
Brasileira de Zootecnia, 29(5), 1528-1536. http://dx.doi.org/10.1590/ S1516-35982000000500035.
Matsuguma, L. S., Lacerda, L. G., Schnitzler, E., Carvalho, M. S. Fo, Franco, C. M. L. F., & Demiate, I. M. (2009). Characterization of native and oxidized starches of two varieties of peruvian carrot (Arracaciaxanthorrhiza, B.) from two production areas of Paraná stat. Brazil. Brazilian Archives of Biology and Technology, 52(3), 701-713. http://dx.doi.org/10.1590/S1516-89132009000300022. Menezes, M. P. C., Ribeiro, M. N., Costa, R. G., & Medeiros, A. N.
(2004). Substitution of corn by cassava (ManihotesculentaCrantz) peel in complete rations for goats: intake, digestibility and weight gain. Revista Brasileira de Zootecnia, 33(3), 729-737. http://dx.doi. org/10.1590/S1516-35982004000300022.
Michelan, A. C., Scapinello, C., Furlan, A. C., Martins, E. N., Faria, H. G., & Andreazzi, M. P. (2006). Utilização da casca de mandioca
desidratada na alimentação de coelhos. Acta Scientiarum Animal
Sciences, 28(1), 31-37.
Miller, G. L. (1959). Use of dinitrossaliglic acid reagent for the
determination of reducing sugars. Analytical Chemistry, 31(3),
426-428. http://dx.doi.org/10.1021/ac60147a030.
Dliveira, M. A., & Moraes, P. S. B. (2009). Technological and postharvest characteristics and productivity of cassava. Ciência e Agrotecnologia, 33(3), 837-843.
Pradeep, P., Goud, G. K., & Reddy, D. V. S. (2010). Dptimization of very high gravity (VHG) finger millet (ragi) medium for ethanolic fermentation by yeast. Chiang Mai Journal of Science, 37, 116-123. Prado, I. N., Martins, A. S., Alcalde, C. R., Zeoula, L. M., & Marques,
J. A. (2000). Performance of heifers fed diets containing corn or cassava hull as energy source and cottonseed meal or yeast as protein source. Revista Brasileira de Zootecnia, 29(1), 278-287. http://dx.doi. org/10.1590/S1516-35982000000100036.
Rattanachomsri, U., Tanapongpipat, S., Eurwilaichitr, L., & Champreda, V. (2009). Simultaneous non-thermal saccharification of cassava pulp by multi-enzyme activity and ethanol fermentation by Candida tropicalis.Journal of Bioscience and Bioengineering, 107(5), 488-493. http://dx.doi.org/10.1016/j.jbiosc.2008.12.024. PMid:19393545. Saito, I. M., & Cabello, C. (2007). Influência da matéria seca da mandioca
review. Food Hydrocolloids, 21(1), 1-22. http://dx.doi.org/10.1016/j. foodhyd.2006.02.006.
Souza, J. M. L., Negreiros, J. R. S., Álvares, V. S., Leite, F. M. N., Souza, M. L., Reis, F. S., & Felisberto, F. A. V. (2008). Physicochemical variability of cassava flour. Food Science and Technology, 28(4), 907-912. http://dx.doi.org/10.1590/S0101-20612008000400022. Sugumaran, K. R., Jothi, P., & Ponnusami, V. (2014). Bioconversion
of industrial solid waste-Cassava bagasse for pullulan production in solid state fermentation. Carbohydrate Polymers, 99(2), 22-30. http://dx.doi.org/10.1016/j.carbpol.2013.08.039. PMid:24274475. Surmely, R., Alvarez, H., Cereda, M. P., & Vilpoux, D. F. (2003). Hidrólise
do amido. In M. P. Cereda (Ed.), Tecnologia, usos e potencialidades de tuberosas amiláceas latino americanas (pp. 377-448). São Paulo: Fundação Cargill.
Serrano, P. D., & Franco, C. M. L. (2005). Annealing and enzymatic hydrolysis of cassava starch. Brazilian Journal of Food Technology, 8(3), 220-232.
Shirai, M. A., Haas, A., Ferreira, G. F., Matsugama, L. S., Franco, C. M. L., & Demiate, I. M. (2007). Dbtention, physicochemical characterization and applications in foods of starches modified by oxidative treatment. Food Science and Techology, 27(2), 239-247. Silva, G. D., Tarizawa, R. A., Pedroso, R. A., & Franco, C. M. L.
(2006). Physicochemical characteristics of modified food starches commercialized in Brazil. Food Science and Techology, 26(1), 188-197. Singh, J., Kaur, L., & McCarthy, D. J. (2007). Factors influencing the