*e-mail: [email protected]
1. Introduction
The main characteristics of self-compacting concrete (SCC) in the fresh state are that, with no need for vibration, SCC can completely ill the formwork and surround the reinforcement adequately (even in densely reinforced areas), leaving no voids and with no segregation either during casting or afterwards. For that, besides high luidity, the SCC has to show good ability to low and pass between the reinforcement bars, as well as an excellent capacity to low like a “viscous luid”1.
Those characteristics are achieved by optimizing the mix’s proportions and incorporating mineral and chemical admixtures that, apart from inluencing the luidity and viscosity, act to avoid segregation and/or bleeding. This means that the luidity and viscosity must be adjusted to allow the coarse aggregate to be held in suspension with no segregation, so that the SCC can maintain its properties during casting and until the beginning of the hardening process2,3.
An eficient method is needed to calculate the mix’s proportions to fulil the fresh state requirements mentioned; it
should allow the rapid optimization of the different components to obtain a technically and economically viable SCC.
Ever since SCC was irst used, one of the factors that has most inluence its wide implementation is the lack of design methods that allow a technical and economic optimization of mixes to make the use of this material more competitive than conventional concrete (CC)4. The majority of the methodologies used in the study of the SCC composition are based in prescriptive methods for which limits are deined for the various components or composition parameters. Many of those methods do not allow a wide range of the various components. They are in general very conservative and need to produce numerous experimental mixes for tuning the mix quantities as a function of the requirements both in the fresh and hardened state. The need to adapt a calculation method to the panorama of the demands normally imposed by the construction industry is therefore recognised. That is to say there is a need for a calculation methodology for the SCC mix quantities with the objective of obtaining a given/speciic average compressive strength associated with a
Fresh-state Properties of Self-compacting Mortar and Concrete with Combined
Use of Limestone Filler and Fly Ash
Pedro Raposeiro da Silvaa*, Jorge de Britob
aCivil Engineering Research and Innovation for Sustainability - CEris, Institute of Structural
Engineering, Territory and Construction - ICIST, Instituto Superior de Engenharia de Lisboa - ISEL-ADEC, Instituto Politécnico de Lisboa, Av. Conselheiro Emídio Navarro, 1, 1959-001, Lisboa, Portugal
bCivil Engineering Research and Innovation for Sustainability - CEris, Institute of Structural
Engineering, Territory and Construction - ICIST, Instituto Superior Técnico - IST-DECivil, Universidade de Lisboa, Av. Rovisco Pais, 1049-001, Lisboa, Portugal
Received: August 8, 2015; Revised: August 24, 2015
This paper presents the results of a study on the behaviour of self-compacting concrete (SCC) in the fresh and hardened states, produced with binary and ternary mixes of ly ash (FA) and limestone iller (LF), using the method proposed by Nepomuceno. His method determines the SCC composition parameters in the mortar phase (self-compacting mortar - SCM) easily and eficiently, whilst guaranteeing the SCC properties in both the fresh and hardened states. For this, 11 SCMs were studied: one with cement (C) only; three with FA at 30%, 60% and 70% C substitution; three with LF at 30%, 60% and 70% C substitution; four with FA + LF in combinations of 10-20%, 20-10%, 20-40% and 40-20% C substitution. Once the composition of these mortars was deined, 18 SCC mixes were produced: 14 binary SCC mixes were produced with the seven binary mortar mixes, and four ternary SCC mixes were produced with the four ternary mortar mixes. In addition to the methodology proposed by Nepomuceno, the combined use of FA and LF in ternary mixtures was tested. The results conirmed that the method could yield SCC with adequate properties in both the fresh and hardened states. It was also possible to determine the SCC composition parameters in the mortar phase (self-compacting mortar - SCM) that will guarantee the SCC properties in both the fresh and hardened states, as conirmed through the optimized behaviour of the SCC in the fresh state and the promising results in the hardened state (compressive strength). The potential demonstrated by the joint use of LF and FA through the synergetic interaction of both additions is emphasized.
self-compacting mix using a minimal number of experimental iterations. Of the different suggestions for designing the SCC mix proportions, the one proposed by Nepomuceno in his PhD work5 and presented in several publications4-7 is highlighted here. This method is based on the Japanese methods proposed by Okamura et al.8 and by JSCE9, but introduces new parameters and new correlations (relative to the reference methods), which are appropriate not only to establish the parameters mentioned in the mortar phase to obtain the self-compactability required in the concrete phase, but also to control the mechanical strength of the SCC.
Additionally to the practical application of the original method of Nepomuceno, ternary SCC mixes with cement, LF and FA were produced. In ternary SCC mixes, a synergy effect is expected to occur between these additions. FA is rich in aluminium oxides that will increase the aluminate content in the mix when they react. This effect favours the action/impact of LF on the formation of hydration products, because the beginning of the LF action is triggered by the reaction between CaCO3, C3A and H2O (calcium carbonate + tricalcium aluminate + water)10. If these additions are used in ternary mixes it is possible to have higher mechanical strength with maintaining the satisfactory fresh properties values.
2. Research Objectives
According to § Preliminary remarks and considering that one of the key questions about the study of SCC mix composition is the need to establish a simple and quick way to directly correlate the properties in the fresh state and the mix’s parameters, our study sets out to determine the fresh and hardened properties of SCC produced from binary and ternary blends of limestone iller (LF) and ly ash (FA) using the method proposed by Nepomuceno5, through the study of self-compacting mortars (SCM).
It was thus possible to evaluate the effect of these mineral admixtures on the performance of the SCM, as well as the eficiency of studying them to obtain SCC with the required behaviour in both the fresh and hardened state. For that purpose, SCM binary and ternary mixes were produced and characterized in the fresh state by their mini slump-low diameter and mini V-funnel low time.
After optimizing the SCM mixes, SCC binary and ternary mixes were produced according to NP EN 206-911, using the parameters determined in the mortar phase. The eficiency of the method was assessed by evaluating the results in the fresh state of slump-low, V-funnel, L-box, J-ring tests and sieve segregation. In the hardened state, the compressive strength was evaluated at 7, 28, 91 and 182 days.
3. Experimental Programme
3.1. Materials
The following materials were used: cement (C) complying with NP EN 197-112 (cement type I-42.5 R with speciic gravity of 3.14), whose chemical composition and grading are provided in Tables 1 and 2, respectively; two mineral admixtures, FA complying with NP EN 450-113 and NP EN 450-214 with speciic gravity of 2.30 and LF complying with LNEC speciication E 46615 with speciic gravity of 2.72, whose chemical composition is summarized in Table 1 and 2,
respectively; two limestone coarse aggregates complying with NP EN 1262016, gravel 1 (C
ag1) with speciic gravity of 2.59, Dmax of 11 mm and water absorption of 1.46% and gravel 2 (Cag2) with speciic gravity of 2.64, Dmax of 20 mm and water absorption of 0.78% (particle size distribution in Figure 1); two siliceous sands complying with NP EN 1262016, one coarse 0/4 (F
ag0/4) with speciic gravity of 2.55, ineness modulus of 3.70 and water absorption of 1.10% and one ine 0/1 (Fag0/1) with speciic gravity of 2.58, ineness modulus of 2.03 and water absorption of 0.70% (particle size distribution in Figure 1); a third-generation high-performance water-reducing admixture (Sp) complying with NP EN 934-1
17
and NP EN 934-218 (a modiied polycarboxylic high-range water-reducing admixture in liquid form with a density of 1.07); tap water complying with NP EN 100819.
3.2. Test methods and sample preparation
3.2.1. Mini-cone slump-low and Mini V-funnel tests for SCM
The determination of the slump-low average diameter (Dm) through the mini slump-low test7 using a conical mould inds the Gm parameter (Gm=(Dm/D0)
2-1).
The determination of the low time (t) using the mini V-funnel7 test allows calculating the Rm parameter (R
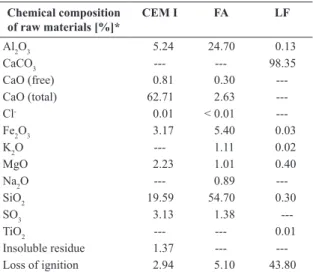
m=10/t). Table 1. Chemical composition of raw materials.
Chemical composition of raw materials [%]*
CEM I FA LF
Al2O3 5.24 24.70 0.13
CaCO3 --- --- 98.35
CaO (free) 0.81 0.30
---CaO (total) 62.71 2.63
---Cl- 0.01 < 0.01
---Fe2O3 3.17 5.40 0.03
K2O --- 1.11 0.02
MgO 2.23 1.01 0.40
Na2O --- 0.89
---SiO2 19.59 54.70 0.30
SO3 3.13 1.38
---TiO2 --- --- 0.01
Insoluble residue 1.37 ---
---Loss of ignition 2.94 5.10 43.80
*The data on this table corresponds to indicative values provided by the manufacturers.
Table 2. Grading of the raw materials.
Particle size, in microns* Passing %
CEM I FA LF
1000 100 100 100
100 98 96 60
10 38 45 20
1 5 2 0
0.1 0 0 0
Speciic surface area (Blaine) cm2/g 3470 3210 4950
Since there are still no standard references for the tests in question, the test procedures used by Nepomuceno5,7, based in turn on Okamura et al.8 were followed.
3.2.2. Fresh state tests in SCC
In the case of SCC in the fresh state and according to NP EN 206-911, the tests were performed following these standards: for the slump-low test NP EN 12350-820 and for the V-funnel test NP EN 12350-921, concerning illing ability; for the L-box test NP EN 12350-1022 and for the J-ring test NP EN 12350-1223, concerning passing ability; for the sieve segregation test NP EN 12350-1124, concerning segregation resistance.
3.2.3. SCC Compressive strength test
The test procedure used to determine the compressive strength was that described in NP EN 12390-325. This test was performed at 7, 28, 91 and 182 days on 150 mm cube specimens and 150 mm diameter × 300 mm high cylindrical moulds, which were kept in a wet chamber (20 ± 2 °C and RH ≥ 95%) after demoulding at 24 hours. The specimens were tested immediately after removal from the wet chamber. The test was performed on three specimens for each mix and test age with a 3000 kN hydraulic press and a loading rate of 0.6 ± 0.2 MPa/s (N/mm2/s).
3.3. Experimental procedure
The mixes’ proportions complied with the method presented by Nepomuceno5, which had already been used in several works, on SCC4,26-30.
The SCM was studied irst to deine the various mix parameters required to calculate the SCC mix proportions. In the ensuing SCC study, the coarse aggregate volume and the voids volume were deined, the proportions were determined and the experimental mixes produced.
The determination of the composition parameters in the mixes studied, to evaluate the variation of the unit percentile substitution of cement by admixtures, in volume, depended on the following conditions:
• The ratio, in absolute volume, between the total quantity of ine materials (cement and mineral admixtures) and of ine aggregates in the mix (Vp/Vs) was kept constant (0.80) for all mixes;
• the ratio, in absolute volume, between the total quantity of water and ine materials (Vw/Vp), and the percentage, in mass, of superplasticizer and ine materials in the mix (Sp/p%) are varied as a function of the water and Sp needed in each mix to reach the required self-compactability parameters, based on experimental mixes in SCM according to the proposal of Nepomuceno5;
• all binary mixes were produced so that the Vp/Vs, Vw/Vp e Sp/p% parameters respected the conditions previously mentioned, but with two distinct values of the ratio, in absolute volume, between the total quantity of mortar and coarse aggregate in the mix (Vm/Vg = 2.125 and Vm/Vg = 2.625); a constant value of the void volume (Vv = 0.03 m
3/m3) was considered in the calculations.
For each SCC family produced, the Vp/Vs parameters and the two values of Vm/Vg were considered constant, which implies that: the total absolute volume of the coarse aggregates in the mix (Vg) is constant for each SCC family, thus: mixes with Vm/Vg = 2.125, Vg= 0.31, and mixes with Vm/Vg = 2.625, Vg = 0.27; the absolute volume of mortar in the mix (Vm) is constant for each SCC family, thus: mixes with Vm/Vg = 2.125, Vm=0.66, and mixes with Vm/Vg = 2.625, Vm = 0.70.
3.4. SCM study
Under the Nepomuceno5 method the various parameters needed to calculate the SCM mixes’ proportions must be determined at this stage.
The value of Vp/Vs adopted was 0.80, thus meeting the requirement in Nepomuceno method that Vp/Vs should range from 0.60 to 0.80.
The next step is the determination of Vw/Vp and Sp/p%. The values giving the target workability properties of the SCC are estimated through an iterative process of experimental SCM mixes (iterative process as shown in Figures 2 and 3) where these characteristics are quantiied by means of a mini-cone and a mini V-funnel, thus the workability parameters are adjusted through the relative slump-low area (Gm) and the relative low velocity (Rm). Successive approximations to the target workability values can thus be obtained, namely, Slump-low, using the slump-low mini cone for mortars: Dm between 251 and 263 mm or Gm between 5.30 and 5.90, and Fluidity, using the mini V-funnel for mortars: t between 7.69 and 8.77 s or Rm between 1.14 and 1.30 s-1.
Table 3 shows the mix parameters obtained according to the method used, as well as the workability test results, showing the mix that reached the target values of Rm and Gm.
3.5. SCC study
Once the SCM study was concluded and the Vp/Vs, fad (percentage replacement of cement by additions), Vw/Vp and Sp/p% parameters established, the ratio, in absolute volume, between the mortar and the mix’s coarse aggregates quantities (Vm/Vg) had to be estimated to allow the calculation of the SCC mixes’ proportions.
Figure 2. Changes in the workability parameters with the increase of Vw/Vp, keeping Sp/p% constant
5.
Figure 3. Changes in the workability parameters with the increase of Sp/p%, keeping Vw/Vp constant5.
Table 3. Summary of the results obtained in the mortar study.
Mix Vp/Vs Vw/Vp Sp/P% fad Vsp/Vp Vp Vw Vsp Vs W/C W/CM W/FM Gm Rm
FA LF [m3/m3] [m3/m3] [m3/m3] [m3/m3] [m3/m3]
SCM1.100C 0.80 0.84 1.05 0.0 0.0 0.031 0.320 0.269 0.010 0.401 0.268 0.268 0.268 5.55 1.21
SCM2.30LF 0.80 0.75 0.66 0.0 0.3 0.019 0.331 0.248 0.006 0.414 0.341 0.341 0.249 5.76 1.21
SCM2.60LF 0.80 0.71 0.43 0.0 0.6 0.012 0.337 0.239 0.004 0.421 0.565 0.565 0.246 5.76 1.17
SCM2.70LF 0.80 0.72 0.41 0.0 0.7 0.011 0.335 0.242 0.004 0.419 0.764 0.764 0.253 5.76 1.29
SCM3.30FA 0.80 0.80 0.70 0.3 0.0 0.019 0.326 0.261 0.006 0.407 0.364 0.277 0.277 5.58 1.14
SCM3.60FA 0.80 0.78 0.58 0.6 0.0 0.014 0.328 0.256 0.005 0.411 0.621 0.296 0.296 5.50 1.18
SCM3.70FA 0.80 0.77 0.57 0.7 0.0 0.014 0.330 0.254 0.004 0.412 0.817 0.302 0.302 5.40 1.25
SCM4.10FA20LF 0.80 0.78 0.67 0.1 0.2 0.019 0.328 0.256 0.006 0.410 0.355 0.321 0.262 5.48 1.17
SCM4.20FA10LF 0.80 0.78 0.68 0.2 0.1 0.019 0.328 0.256 0.006 0.410 0.355 0.293 0.266 5.89 1.15
SCM5.20FA40LF 0.80 0.71 0.48 0.2 0.4 0.013 0.336 0.239 0.004 0.421 0.565 0.414 0.253 5.68 1.17
SCM5.40FA20LF 0.80 0.75 0.48 0.4 0.2 0.012 0.332 0.249 0.004 0.415 0.597 0.345 0.276 5.55 1.15
fad = percentage of replacement of cement with additions; Vsp = total content of superplasticizer in absolute volume; Vp =, total content of ine materials in
absolute volume (cement and mineral admixtures); Vw = total content of water in absolute volume; Vs = total content of ine aggregates in absolute volume. The Vm/Vg ratio depends directly on the target degree of self-compactability, which is evaluated by the L-box test, for which the H2/H1 (≥ 0.80) parameter has to be obtained. According to Nepomuceno5, for each combination of V
p/Vs and Vm/Vg there is a ‘mix number’ (MN) which represents the granular skeleton of the mix (MN = (Vp/Vs) x (Vm/Vg)). Mixes with MN of 1.7 and 2.1 were produced. Considering a constant value of the Vp/Vs ratio (0.8), the mix parameter for the mixes with MN=1.7 is Vm/Vg = 1.7/0.8 = 2.125, and for the mixes with MN=2.1 it is Vm/Vg = 2.1/0.8 = 2.625. In practice, the mixes with MN=1.7 have a higher volume of coarse aggregate than the mixes with MN=2.1, i.e. less coarse aggregate and more mortar (as seen in § Experimental procedure).
With these proportions the mix was made so that the workability parameters could be tested and, if necessary, the superplasticizer proportions and water content readjusted.
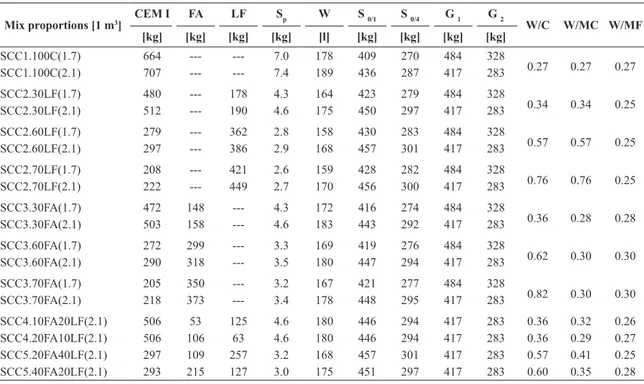
Table 4 presents the SCC mixes’ inal proportions. The mix proportions in Table 4 were established by determining the ratios between the aggregates. The ratios between the coarse aggregates (Cag1 and Cag2) and the ine aggregates (Fag0/1 and Fag0/4) were established with the goal of maximizing the compacity through the analysis of the reference mixes as well as the corresponding ineness modulus. The purpose was to minimize the voids between particles and optimize the ratios between the various aggregate types (the aggregates mixtures are represented in Figure 1).
Due to the extent of the experimental campaign, all parameters related to durability performance and mechanical properties are presented in detail in Silva & Brito31,32.
4. Test Results and Discussion
4.1. SCM results
for mortars (Gm and Rm parameters), which guarantee the self-compactability of the corresponding SCC.
In general, it is found that the Vw/Vp parameter, crucial to setting the water volume for the mix, varies between 0.71 and 0.84. The highest value (0.84) was found for the mix with cement only (SCM1). The use of LF in the binary mixes led to a greater reduction of the water needed compared with the use of FA. In the SCM2 mixes (with LF), the Vw/Vp ratio varies between 0.71 and 0.75, while in the SCM3 mixes (with FA), it varies between 0.77 and 0.80.
Regarding the ternary mixes, the Vw/Vp ratio variation behaves in line with that of the binary mixes with equivalent fad. For example, for the SCM4 mixes (with global fad of 30%), this parameter has a value of 0.78, between the 0.75 of SCM2 (with LF) and the 0.80 of SCM3 (with FA).
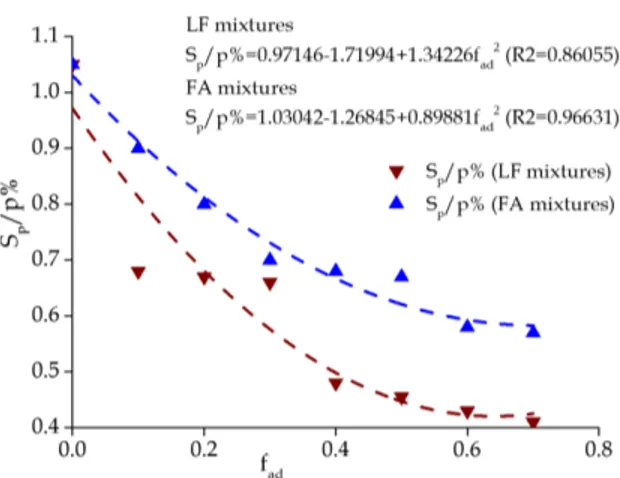
The Sp/p% parameter varies in the same way as the Vw/Vp ratio, but with quite distinct orders of magnitude (Figure 5), with the percentage of Sp decreasing signiicantly for higher fad. Consequently, a lower Sp was needed relative to the mass of the ine particles in the mix to achieve the target workability requirements, according to Nepomuceno5.
In general, the Sp/p% parameter, which determines the quantity of Sp in the mix, varies between 0.41% and 1.05% of the ine materials’ mass. Naturally the highest value (1.05%) is for the SCM1 mix (with cement only). As seen for the Vw/Vp ratio, the lower Sp/p% values are obtained in the binary mixes with LF (SCM2). Therefore, the SCM2 mixes (with LF) only need an Sp between 0.41% and 0.66% of the ine materials’ mass, while the binary mixes with FA (SCM3) require slightly higher values, between 0.57% and 0.70%, but still less than those required by the SCM1 mix (with cement only).
The Sp/p% parameter values for the ternary mixes are perfectly in line with those for the binary mixes with equivalent fad. The values for the SCM4 mixes (with global fad of 30%) are between 0.67% and 0.68% in comparison with 0.66% for the SCM2 (with fad 30% of LF) and 0.70% of the SCM3 (with fad 30% of FA). Similarly, the SCM5 mix (with global fad of 60%) has a value of 0.48% in comparison with 0.43% of SCM2 (with fad 60% of LF) and 0.58% of SCM3 (with fad 60% of FA).
The Vw/Vp values determined in this work are of a very similar order of magnitude to those reported by Nepomuceno5-7. Note the value of 0.86 for the Vw/Vp ratio given by the author for a mix equivalent to SCM1 (with cement only) compared with our value of 0.84. For the mix with fad of 30% of FA, these authors obtain a Vw/Vp ratio of 0.75 compared with our value of 0.80. Lastly, attention is drawn to a Vw/Vp of Table 4. Mix proportions of SCCs.
Mix proportions [1 m3] CEM I FA LF Sp W S 0/1 S 0/4 G 1 G 2 W/C W/MC W/MF [kg] [kg] [kg] [kg] [l] [kg] [kg] [kg] [kg]
SCC1.100C(1.7) 664 --- --- 7.0 178 409 270 484 328
0.27 0.27 0.27
SCC1.100C(2.1) 707 --- --- 7.4 189 436 287 417 283
SCC2.30LF(1.7) 480 --- 178 4.3 164 423 279 484 328
0.34 0.34 0.25
SCC2.30LF(2.1) 512 --- 190 4.6 175 450 297 417 283
SCC2.60LF(1.7) 279 --- 362 2.8 158 430 283 484 328
0.57 0.57 0.25
SCC2.60LF(2.1) 297 --- 386 2.9 168 457 301 417 283
SCC2.70LF(1.7) 208 --- 421 2.6 159 428 282 484 328
0.76 0.76 0.25
SCC2.70LF(2.1) 222 --- 449 2.7 170 456 300 417 283
SCC3.30FA(1.7) 472 148 --- 4.3 172 416 274 484 328
0.36 0.28 0.28
SCC3.30FA(2.1) 503 158 --- 4.6 183 443 292 417 283
SCC3.60FA(1.7) 272 299 --- 3.3 169 419 276 484 328
0.62 0.30 0.30
SCC3.60FA(2.1) 290 318 --- 3.5 180 447 294 417 283
SCC3.70FA(1.7) 205 350 --- 3.2 167 421 277 484 328
0.82 0.30 0.30
SCC3.70FA(2.1) 218 373 --- 3.4 178 448 295 417 283
SCC4.10FA20LF(2.1) 506 53 125 4.6 180 446 294 417 283 0.36 0.32 0.26
SCC4.20FA10LF(2.1) 506 106 63 4.6 180 446 294 417 283 0.36 0.29 0.27
SCC5.20FA40LF(2.1) 297 109 257 3.2 168 457 301 417 283 0.57 0.41 0.25
SCC5.40FA20LF(2.1) 293 215 127 3.0 175 451 297 417 283 0.60 0.35 0.28
0.70 in Nepomuceno work5-7 for the mix equivalent to SCM2 (with 60% LF), compared with 0.71 in our work.
Similarly, Silva et al.4, using Nepomuceno method, obtained a Vw/Vp ratio of 0.77 for the binary mix of fad 30% of LF and of 0.70 (with CEM II/B-L 32.5N), compared with 0.75, and a Vp/Vs ratio of 0.80, in our work. Franco et al.27 also used Nepomuceno method and obtained values of 0.70 for Vw/Vp (the same as in Nepomuceno5-7) for the mixes with f
ad 60% of LF, compared with 0.71 in our work. António et al.28 used the same method to produce SCC but incorporating a waste luid catalytic cracking catalyst. In their control concrete with 100% of cement, equivalent to our SCM1, they got a Vw/Vp value of 0.82, compared with the 0.86 reported by Nepomuceno5 and 0.84 in our work.
Regarding the Sp/p% parameter, there are great discrepancies between the various works consulted for the mixes mentioned above. Clearly this value is directly associated with the quality of the superplasticizer itself, enabling the various Sp values used by the authors of these works to be checked from the original work of Nepomuceno5 until today. In his original work Nepomuceno had an Sp/p% value of 3.25% for the mixes with 100% cement, compared, for example, with 1.80% reported by António et al.28 or 1.05% in our work for equivalent mixes, all with different Sp values. There are also Sp/p% values of 2.50% for the mixes with fad 30% of FA, obtained by Nepomuceno5, compared with the 0.70% we found. The same author also reported Sp/p% values of 0.80% for mixes with fad 60% of LF, compared with our igure of 0.41% and the even lower value of 0.30% given by Franco et al.27. Lastly, Silva et al.4 report a S
p/p% of 1.30% for mixes with fad 30% of LF and Vp/Vs of 0.70 (with a CEM II/B-L 32,5N), compared with our indings of 0.66% and Vp/Vs of 0.8, with various Sp values.
Regarding the variability of the results published on SCM in the fresh state, one should highlight that the variation coeficient of all the individual readings of the various tests performed vary between 3.87% and 13.05% with an average value of approximately 8.28%, indicating that, in general, the results scatter is small and that the values obtained are perfectly within the variation intervals found in the literature.
4.2. SCC fresh state results
Table 4 shows the mix proportions of the SCCs produced based on the parameters presented in Table 3. Figure 6 show the average values obtained in the various tests in the fresh state with the corresponding minimum and/or maximum limits marked according to NP EN 206-911.
In terms of both slump-low time (t500) and diameter, the results of all mixes can be considered satisfactory. In general, distribution of the coarse aggregate was good and no bleeding or segregation occurred. The presence of coarse aggregate can also be observed for the slump-low limit.
The majority of the mixes belong to slump low class SF2 and the rest are very close to the class limits. As for slump-low time, all mixes fall in the VS2 class with all results below 4 seconds. There is a slight increase of the slump-low time with the use of LF and FA and for higher fad values, but this increase is not matched by an increase of the slump-low diameter.
The average values for the V-funnel (Figure 6) allow evaluation of the SCCs’ ability to pass through small openings. It is concluded that the average values for all mixes are within the reference values provided in NP EN 206-911, ranging generally between 7 s and 13 s, with most classiied as class VF2 (tv between 9 s and 25 s) and the rest as VF1 (tv < 9 s).
Observation of the test showed that the coarse aggregate did not become blocked in the narrow passage and was present at the top of the mould (before opening the sliding gate) and that no bleeding occurred. The concrete continued to look like a uniformly distributed bulk after the test.
The joint analysis of the slump-low and V-funnel tests indicates that all mixes showed cohesion and had a viscous appearance but did not lose their capacity to deform. The results of the L-box and J-ring tests corroborate this.
The average values for the low time in the L-box test conirm the illing capacity, the resistance to blocking and the resistance to segregation. The stability of the sample could be checked visually at the end of the test. The average values obtained for all mixes are very well balanced, with only a small decrease in the H2/H1 in the mixes with FA, mainly for values of fad of 60% and 70%, and still without any bleeding and segregation. For this test (L-box), the lowest reference limit of H2/H1 in NP EN 206-9
11 is 80%. The results in our study comply with the standard11, ranging from 79% in the mixes with FA to 90%.
The results of the segregation test are also presented in Figure 6 and are in line with the reference values in NP EN 206-911, i.e. always below 20%. In general, the binary mixes with FA (SCC3 with fad of 70%) and the ternary mixes belong to class SR2, i.e. they are less prone to segregation. The remaining mixes fall in the SR1 class, i.e. higher probability of segregation. Nevertheless, the propensity to segregation and/or bleeding was slight in all SCCs produced.
The results obtained in the J-ring test concerning the passing ability reveal that all the mixes fall within class PJ2, with all values below 10 mm, indicating a good passing ability. In general, the lower results (< 5 mm) were obtained for the SCC1 mixes (with cement only) and the ternary mixes.
For all mixes the relationship between the values in the slump-low and the V-funnel tests are shown in Figure 7a. Self-compactability was reached with SF values between Figure 5. Correlation between Sp/p% (percentage, in mass, of
650 mm and 750 mm (except for the SCC1 and SCC4 mixes, where values were between 740 mm and 780 mm, which are still acceptable) and tv values between 7 s and 13 s. From the Figure 7a we can conclude that the ‘target’ properties for the behaviour of fresh SCM deined by Nepomuceno5-7 are adequate to obtain the self-compactability properties intended for a SCC.
(mixes MN=1.7 vs. MN=2.1). In general there is no correlation between H2/H1 and the V-funnel low results, although within mixes produced from the same SCM but with distinct MN there is an - expected - slight decrease of the V-tunnel low time for the mixes with a lower volume of coarse aggregate and consequent larger volume of paste.
Regarding the results variability related to the study of SCC in the fresh state, one should highlight that the variation coeficient of all the individual readings of the different tests performed vary between 6.20% and 17.06% with an average value of approximately 9.06%, indicating that, in general, the results scatter is small and that the values obtained are perfectly within the variation intervals found in the literature.
4.3. SCC compressive strength
The results regarding the average compressive strength of the mixes studied show generally acceptable standard deviations and variability coeficients. One should, therefore, highlight the existence of scatters which are slightly higher than normal in the results at 7 days of the mixes SCC1 (21.73%) and, at 28 and 91 days, of SCC2.60LF.1.7 and 2.1 (14.07% and 13.92% respectively). On the other hand, at 182 days, the larger variation coeficient (8.86%) occurs in mix SCC2.30LF.2.1, which still represents an acceptable
results scatter. The average variation coeficients obtained for each of the SCC are of 7.08%, 4.63%, 3.27%, 5.15% and 2.63% for the mixes SCC1, SCC2, SCC3, SCC4 and SCC5, respectively, indicating that, in general, the results scatter is signiicantly small.
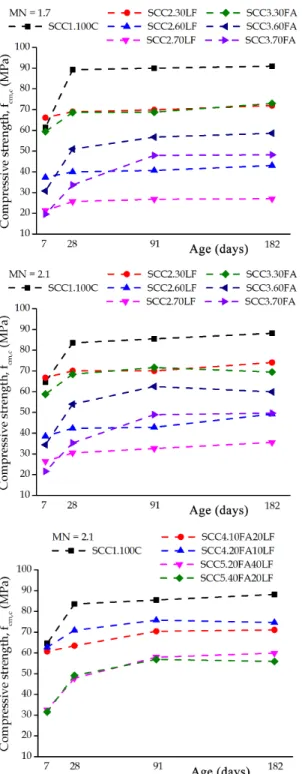
Figure 8 shows the evolution of compressive strength (fcm,c) over time for all SCC produced and it shows a more pronounced growth of compressive strength in the early ages
Figure 7. Slump-flow/V-funnel (a) and L-box/slump-flow correlations (b).
(7 days) in binary mixes with LF. Binary mixes with FA show a more gradual evolution of the compressive strength as it continues to grow beyond the early ages. The variations mentioned also happen in ternary mixes where those with fad of 60% have a more gradual and continuous growth than the more pronounced initial growth of those with fad of 30%. As expected, the mixes with 100% cement behave differently from the others, growing sharply until 28 days and then stabilizing until the last test age (182 days).
Both binary and ternary mixes show a decrease in compressive strength for higher replacement ratios of the additions (fad), which is mainly due to the dilution effect as the Portland cement content is reduced. In the particular case of FA, the evolution of the compressive strength for higher fad levels is even slower, mainly at the younger ages, but it stabilizes at 91 days. The compressive strength values of the SCC3.FA mixes compared with those of the SCC1.100C mixes agree with expectations. Considering the lower initial evolution of the SCC3.FA mixes (and because the delaying effect of the FA pozzolanic behaviour limits the FA’s contribution to compressive strength to the iller effect at those initial ages), it is expected that at older ages and for fad levels lower than approximately 30%, the compressive strength should evolve more signiicantly, and in certain cases even reach values the same as or even higher than the corresponding values in SCC with 100% cement. This behaviour is mentioned by a number of authors for conventional concrete who note that the optimal content of FA substitution for C is lower than 20-30%34,35.
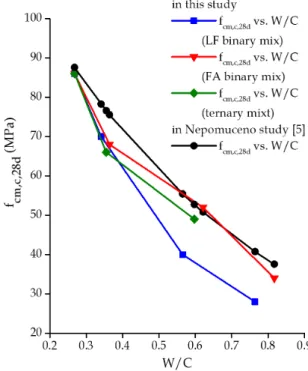
The values presented in Figure 9 demonstrate that the correlations obtained in our work follow the same trend as those obtained by Nepomuceno5-7 and that the differences found are perfectly acceptable. The binary mixes with
FA exhibit values of fcm,c,28d closer to those predicted by Nepomuceno5 with any differences being below 10%. Within the binary mixes with FA the ones with fad of 60% stand out, with values of fcm,c,28d only 2% different from the one predicted by Nepomuceno5. The results of the binary mixes with LF are the ones furthest from those predicted, exhibiting differences of approximately 30% in the mixes with fad of 60% and 70%, and 11% for the mixes with fad of 30%. Lastly, the differences between the correlations obtained with the ternary mixtures and those of Nepomuceno5 vary by between 7% and 14%. The ternary mixes with a global fad of 30% show very similar behaviour to that of the binary mixes with the same fad, while the ternary mixes with global fad of 60% are closer to the values of Nepomuceno5, and to those of the binary mixes with FA.
Figure 10 presents the evolution of the compressive strength of the SCC produced, using the hardening coeficient (Chard), i.e. the correlation fcm,c,id/fcm,c,28d (average compressive strength at age i/average compressive strength at 28 days). Both the Chard values of the SCC and the Chard values for the compressive strength, determined according to Equation 2 suggested in Eurocode 236 for CC are presented.
Figure 9. Correlation between fcm,c,28d and the W/C ratio of the SCC
cm,id cc,i cm,28d
f = β f (1)
With:
cc,i
28 = exp S
1-i β
(2)
Where: βcc,i= coeficient that depends on concrete age;
S = coeficient that depends on cement type (0.20 for cement of strength classes CEM 42.5 R, CEM 52.5 N and CEM 52.5 R; 0.25 for cement of strength classes CEM 32.5 R and CEM 42.5 N; 0.38 for cement of strength class CEM 32.5 N).
Comparison of the hardening coeficients of the SCC produced with those obtained through the compressive strength evolution models suggested in Eurocode 234 for CC shows the SCC2.LF mixes have the most similar behaviour and the SCC3.FA the most distinct behaviour. For FA, Chard values at 7 days are lower than those determined by the Eurocode 2 proposal (except for the mixes with 30% fad). After 28 days, the Chard values vary depending on the fad value. For FA mixes with 30% fad, the Chard value was below the one proposed by Eurocode 2. For mixes with 60% fad, the values are of the same magnitude and, for mixes with 70% fad, the values are signiicantly higher, with an increase of approximately 40% at 91 days relative to the 28-day compressive strength.
The Chard values of the ternary mixes are higher at 7 days for SCC4 mixes and of the same magnitude after 28 days, compared with the compressive strength evolution models in Eurocode 2. For SCC5 mixes they are lower at 7 days and the same or even slightly higher than those of the model after 28 days.
The changes in the hardening coeficients presented here are conirmed by Holschemacher & Klug37, where there is a scatter of the Chard values for both the SCC2 and the SCC3 mixes at 7, 28 and 91 days, very similar to our results.
A relationship was found between the compressive strength results for 150 mm diameter × 300 mm tall cylinders and 150 mm cubes (Figure 11), as expected. The conversion factor is approximately 0.80 (leaving out factor “a” of the linear relationship obtained y = a + b ⋅ x) and agrees with the values presented in NP EN 206-138 for CC that vary between 0.80 (class C16/20) and 0.82 (class C70/85).
5. Conclusions
With the study of SCC using SCM, without the coarse aggregate, it is possible to signiicantly reduce the iterations that would be necessary if the composition were studied using SCC alone. The greater ease and simplicity of the SCM study should be stressed, too. In this approach, the behaviour of fresh SCM, which is correlated with the deined rheological parameters, is used to simulate and reach target ranges of fresh SCC behaviour.
In general, our results indicate that, in the absence of segregation, bleeding and blocking of the SCM mixes, the values established by Nepomuceno for the variation ranges of the mini slump-low diameter and the mini V-funnel low time parameters can be considered adequate to obtain self-compacting mixes.
The results conirm that using mineral admixtures such as LF and FA in binary and ternary mixes improves the workability of SCC. In general, it was found that the use of LF led to a slight greater reduction of the need for both water and superplasticizers to comply with the SCM workability requirements that ensure self-compactability of the related SCC, compared with FA. The ternary mixes show water and superplasticizer consumption values that are perfectly in line with those obtained in the binary mixes with equivalent fad. The use of ternary mixes turned out to be more advantageous to the behaviour of hardened SCC.
Regarding the SCCs produced, it was found that all mixes reached the workability parameters required to be classiied as self-compacting according to European standards. The SCCs had adequate illing and passing ability as well as good resistance to segregation. The observations on SCM are equally valid for SCC. In this phase (SCC) only the Vm/Vg parameter was considered, with the goal of accounting for the volume of coarse aggregate. The quantiication of the volume of coarse aggregate using the Vm/Vg parameter, through the deinition of the MN, turned out to be adequate; according to expectations, slight differences were observed in the fresh state behaviour of the SCCs with a higher volume of coarse aggregate (mixes with MN = 1.7) and the SCCs with a lower volume of coarse aggregate (MN = 2.1).
The results of compressive strength allowed concluding that, even for higher level of fad, it is possible to obtain reasonable strength values within those expected. The results also demonstrate that partially replacing cement with LF accelerates the hydration process and causes an increase in compressive strength at young ages. FA retards the development of the compressive strength of SCC, despite the fact that at more advanced ages these mixes reach higher strengths than those of the mixes with LF. This effect is essentially due to the pozzolanic reactions of FA being slower than the cement hydration. The ternary mixes show an extremely favourable behaviour, with very satisfactory strength values right at the earliest ages, compared with the binary mixes. This behaviour is usually attributed to a synergetic effect between the mineral admixtures. This more pronounced synergy between LF and FA can be attributed to the formation of more aluminates and less ettringite owing to the presence of FA (relative to concrete without FA). The presence of LF (in the mix FA + C) will cause a less marked impact of the FA effect and more ettringite will be available. As a consequence, a higher total Figure 11. Overall relationship between average compressive
hydrates volume, a decrease in porosity and an increase in mechanical strength are obtained.
Acknowledgements
The authors acknowledge the support of Instituto Superior de Engenharia de Lisboa (Polytechnic Institute of Lisbon) through the Programa de apoio à formação
avançada de docentes do Ensino Superior Politécnico (PROTEC) for facilitating this work in the context of the PhD scholarship with the reference SFRH/PROTEC/67426/2010. The support of the Foundation for Science and Technology (FCT), Instituto Superior Técnico (Technical University of Lisbon) and of the ICIST research centre is also acknowledged.
References
1. Schutter G and Audenaert K, editors. Report 038: durability of self-compacting concrete - state-of-the-art Report of RILEM Technical Committee 205-DSC. RILEM Publications; 2007.
208 p.
2. Gesoğlu M, Güneyisi E and Özbay E. Properties of self-compacting concretes made with binary, ternary, and quaternary cementitious blends of fly ash, blast furnace slag, and silica fume. Construction & Building Materials. 2009; 23(5):1847-1854. http://dx.doi.org/10.1016/j.conbuildmat.2008.09.015. 3. Gesoğlu M, Güneyisi E, Kocabağ M, Bayram V and Mermerdaş
K. Fresh and hardened characteristics of self-compacting concretes made with combined use of marble powder, limestone filler and fly ash. Construction & Building Materials. 2012; 37:160-170. http://dx.doi.org/10.1016/j.conbuildmat.2012.07.092. 4. Silva P, Brito J and Costa J. Viability of two new mix design
methodologies for SCC. ACI Materials Journal. 2011; 108(6):579-588.
5. Nepomuceno M. Methodology for self-compacting concrete design [Thesis]. Covilhã: Beira Interior University; 2005. 6. Nepomuceno M and Oliveira L. Parameters for self-compacting
concrete mortar phase. ACI Materials Journal. 2008; 253:323-340.
7. Nepomuceno M, Oliveira L and Lopes SMR. Methodology for mix design of the mortar phase of self-compacting concrete using different mineral additions in binary blends of powders.
Construction & Building Materials. 2012; 26(1):317-326. http://dx.doi.org/10.1016/j.conbuildmat.2011.06.027. 8. Okamura H, Ozawa K and Ouchi M. Self-compacting concrete.
Structural Concrete. 2000; 1(1):3-17. http://dx.doi.org/10.1680/ stco.2000.1.1.3.
9. Japan Society of Civil Engineers - JSCE. Recommendation for construction of self-compacting concrete. In: International Workshop on Self-compacting Concrete (pp. 417-437); 1998; Kochi, Japan.
10. De Weerdt K, Kjellsen KO, Sellevold EJ and Justnes H. - Synergy between fly ash and limestone powder in ternary cements.
Cement and Concrete Composites. 2011; 33(1):30-38. http:// dx.doi.org/10.1016/j.cemconcomp.2010.09.006.
11. Instituto Português da Qualidade - IPQ. NP EN 206-9: concrete. Part 9: Additional rules for self-compacting concrete (SCC). Lisbon; 2010. 35 p.
12. Instituto Português da Qualidade - IPQ. NP EN 197-1, A3:
cement. Part 1: composition, speciications and conformity
criteria for common cements. Lisbon; 2008. 8 p.
13. Instituto Português da Qualidade - IPQ. NP EN 450-1, A1: ly ash for concrete. Part 1: deinition, speciications and conformity
criteria. Lisbon; 2008. 35 p.
14. Instituto Português da Qualidade - IPQ. NP EN 450-2, 2006, Fly ash for concrete, Part 2: Conformity evaluation. Lisbon;
2006. 29 p.
15. National Laboratory for Civil Engineering. LNEC E 466:
limestone illers for hydraulic binders. Lisbon; 2005. 2 p.
16. Instituto Português da Qualidade - IPQ. NP EN 12620, A1: aggregates for concrete. Lisbon; 2010. 61 p.
17. Instituto Português da Qualidade - IPQ. NP EN 934-1: admixtures for concrete, mortar and grout. Part 1: common requirements. Lisbon; 2008. 13 p.
18. Instituto Português da Qualidade - IPQ. NP EN 934-2: admixtures for concrete, mortar and grout. Part 2: concrete admixtures,
deinitions, requirements, conformity, marking and labelling. Lisbon; 2009. 28 p.
19. Instituto Português da Qualidade - IPQ. NP EN 1008: mixing
water for concrete, speciication for sampling, testing and
assessing the suitability of water, including water recovered from processes in the concrete industry, as mixing water for concrete. Lisbon; 2003. 22 p.
20. Instituto Português da Qualidade - IPQ. NP EN 12350-8: testing
fresh concrete. Part 8: self-compacting concrete, slump-low. Lisbon; 2010. 12 p.
21. Instituto Português da Qualidade - IPQ. NP EN 12350-9: testing fresh concrete. Part 9: self-compacting concrete, V-funnel test. Lisbon; 2010. 11 p.
22. Instituto Português da Qualidade - IPQ. NP EN 12350-10: testing fresh concrete. Part 10: self-compacting concrete, L-box test. Lisbon; 2010. 2 p.
23. Instituto Português da Qualidade - IPQ. NP EN 12350-12: testing fresh concrete. Part 12: self-compacting concrete, J-ring test. Lisbon; 2012. 14 p.
24. Instituto Português da Qualidade - IPQ. NP EN 12350-11: testing fresh concrete. Part 11: self-compacting concrete, Sieve segregation test. Lisbon; 2011. 12 p.
25. Instituto Português da Qualidade - IPQ. NP EN 12390-3: testing hardened concrete. Part 3: compressive strength of test specimens. Lisbon; 2011. 21 p.
26. Bogas J, Gomes A and Pereira M. Self-compacting lightweight concrete produced with expanded clay aggregate. Construction & Building Materials. 2012; 35:1013-1022. http://dx.doi. org/10.1016/j.conbuildmat.2012.04.111.
27. Franco R, Nepomuceno M and Oliveira L. Self-compacting concrete optimization for different flow restrictions. In: 3rd Ibero American Congress on self-compacting concrete (pp. 45-54); 2012; Madrid.
28. António J, Silva P and Costa C. Fresh properties and compressive strength of self-compacting concrete containing waste fluid catalytic cracking catalyst. In: 7th RILEM Conference on Self-Compacting Concrete (67th RILEM Week); 2013; Paris, France.
Materials (pp. 293-300); 2013; Paris, France. France: RILEM
Publications; 2013.
30. Silva P and Brito J. Electrical resistivity and permeability of self compacting concrete with incorporation of fly ash and limestone filler. Advances in Concrete Construction. 2013; 1(1):65-84. http://dx.doi.org/10.12989/acc.2013.1.1.065. 31. Silva PR and Brito J. Durability performance of self-compacting
concrete (SCC) with binary and ternary mixes of fly ash and limestone filler. Materials and Structures. 2015. 10.1617/ s11527-015-0683-6.
32. Silva PR and Brito J. Experimental study of the porosity and microstructure of self-compacting concrete (SCC) with binary and ternary mixes of fly ash and limestone filler. Construction & Building Materials. 2015; 86:101-112. http://dx.doi.org/10.1016/j. conbuildmat.2015.03.110.
33. Walraven JC. Structural applications of self-compacting concrete. In: Wallevik O and Nielsson I, editors. 3rd RILEM International
Symposium on Self-Compacting Concrete (pp. 15-22); 2003; Reykjavik, Iceland. France: RILEM Publications; 2003. 34. Neville AM. Properties of concrete (4th ed.). England: Pearson;
1995. 844 p.
35. Mehta PK and Monteiro PJM. Concrete microstructure, properties and materials. USA: McGraw-Hill; 2005. 684 p.
36. Instituto Português da Qualidade - IPQ. NP EN 992-1-1: design of concrete structures. Part 1-1: general rules and rules for buildings. Lisbon; 2010. 259 p.
37. Holschemacher K and Klug Y. A database for the evaluation of hardened properties of SCC. Leipzig Annual Civil Engineering Report: LACER. 2002; (7):124-134.
38. Instituto Português da Qualidade - IPQ. NP EN 206-1: concrete.