The present study evaluates the bond behavior between steel bars and concrete by means of a numerical analysis based on Finite Element Method. Results of a previously conducted experimental program on reinforced concrete beams subjected to monotonic loading are also pre-sented. Two concrete types, self-compacting concrete and ordinary concrete, were considered in the study. Non-linear constitutive relations were used to represent concrete and steel in the proposed numerical model, aiming to reproduce the bond behavior observed in the tests. Experimental analysis showed similar results for the bond resistances of self-compacting and ordinary concrete, with self-compacting concrete presenting a bet-ter performance in some cases. The results given by the numerical modeling showed a good agreement with the tests for both types of concrete, especially in the pre-peak branch of the load vs. slip and load vs. displacement curves. As a consequence, the proposed numerical model could be used to estimate a reliable development length, allowing a possible reduction of the structure costs.
Keywords: bond strength, self-compacting concrete, beam, numerical approach, steel-concrete interface.
O presente estudo avalia o comportamento da aderência entre barras de aço e concreto por meio de uma simulação numérica utilizando o método dos elementos initos. Os resultados de um estudo experimental anteriomente realizado de vigas em concreto armado submeticas a um carregamento monotônico são também apresentados. Foram utilizados nesta pesquisa dois tipos de concreto, sendo eles: o concreto auto--adensável e o concreto convencional (vibrado). Foram utilizadas relações constitutivas não-lineares para o concreto e o aço para representar o comportamento do modelo numérico proposto com o objetivo de simular o comportamento da aderência dos ensaios. A análise experimental mostrou resultados similares para a resistência de aderência no concreto auto-adensável e no concreto convencional com os modelos em concreto auto-adensável com um melhor comportamento em alguns casos. Os resultados fornecidos pela simulação numérica mostraram boa concordância com os ensaios realizados para os dois tipos de concreto, especialmente na fase de pré-pico do diagram força vs. deslizamento e força vs. deslocamento.Finalmente, o modelo numérico proposto pode ser utilizado para estimar o comprimento de ancoragem mais adequado, permitindo uma possível um redução nos custos da estrutura.
Palavras-chave: resistência de aderência, concreto auto-adensável, viga, aproximação numérica, interface aço-concreto.
Numerical approach of the bond stress behavior of
steel bars embedded in self-compacting concrete and in
ordinary concrete using beam models
Simulação numérica do comportamento da tensão
de aderência entre barras de aço e concreto
auto-adensável e convencional utilizando modelos de vigas
F.M. ALMEIDA FILHO a [email protected]
M. K. EL DEBS b [email protected]
A.L.H.C. EL DEBS c [email protected]
a Department of Civil Engineering, São Carlos Federal University, Rod. Washington Luís, km 235, CEP 13565-905, São Carlos, SP – Brazil b Department of Structural Engineering, São Carlos Engineering School, São Paulo university Av. Trabalhador Sãocarlense, 400, CEP 13566-590,
São Carlos, SP – Brazil
Abstract
Nowadays, the use of high-performance concrete is more and more frequent, due to its economy and versatility. The need of high reinforcement ratios to guarantee the material an appropriate duc-tility causes many dificulties in the cast operations, requiring extra care to assure the good quality of the structure.
Self-compacting concrete (SCC) is an innovative construction ma-terial developed for civil constructions in the 1990’s that can be the response for this problem. SCC is deined as a mixture that can be cast in any place of the formwork, just through the accommodation due to its own weight [1-2]. This new material is capable of lowing inside the formwork through the reinforcement, illing it out without any compacting equipment. As a result, increase of productivity, reduction of labor costs and improvement of overall quality of the structure can be obtained. [3].
The application of SCC is also expected to improve the lexural behavior of the elements due to its superior illing capability, since an increase of the bond resistance between reinforcement and concrete could indirectly beneit the coninement effects. For low strength concretes, SCC and OC (ordinary concrete) presented similar bond strength, with some peculiarities [4-7]. Particularly in places with high reinforcement rate the fresh properties of SCC surpass the OC [8], producing higher quality elements. For high strength concretes, similar results are expected, since the modu-lus of elasticity will increase proportionally for both types of con-crete, and those are the main properties of concrete affecting the bond strength.
from the middle of the XX century, since the interaction between steel and concrete is considered the main mechanism character-izing the reinforced concrete behavior. As stated before, the ob-tained bond strength depends on the steel bar and concrete prop-erties, but steel the behavior is know well known. Therefore, the study of bond goes through the complete knowledge of the materi-als involved in the concrete production.
If from the physical point-of-view steel-concrete bond is still not completely understood, the real behavior of the interface is very dificult to be represented by numerical models, being affected by a large number of variables. According to [9], the bond resis-tance can be divided in three portions. The irst one is the adhe-sion, which consists of the shear resistance between concrete and steel; the second is the friction between surfaces, which is a decisive factor at the ultimate limit state; and the last one is the bearing action, caused by the deformation of the bars in contact with concrete.
There are several types of failure associated to the loss of bond between concrete and the steel bar, and the main ones are pull-out failure and splitting failure. These failures are strongly in-luenced by several factors, such as the type of reinforcement (bar, tendons and strings), surface characteristics (lat or rough), bar diameter, presence of coninement reinforcement, distance among the bars, concrete cover, steel bar stresses, concrete quality and others.
In the pull-out test of a steel bar from a concrete prism the failure of the concrete occurs nearly the steel bar surface and the mecha-nism with pure slip would not be possible [10]. If a steel bar is
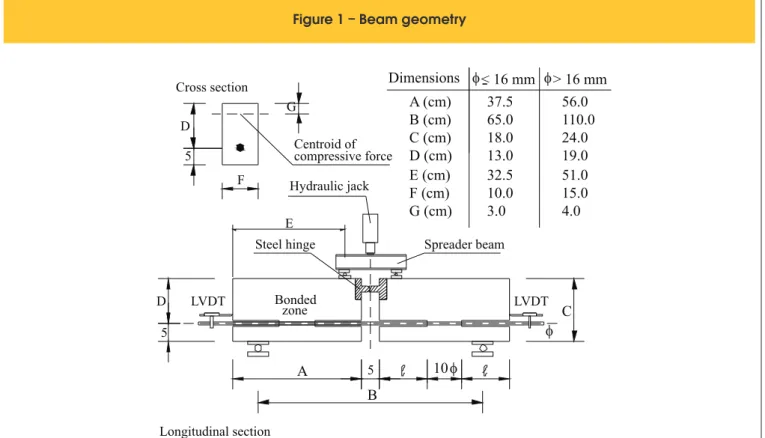
Figure 1 – Beam geometry
Bonded
A
zone LVDT
10
B
C
Hydraulic jack
Dimensions
A (cm)
B (cm)
C (cm)
37.5
65.0
18.0
56.0
110.0
24.0
< 16 mm
> 16 mm
5 D
5
E
LVDT Steel hinge
D (cm)
E (cm)
13.0
32.5
19.0
51.0
Spreader beam
Longitudinal section Cross section
F
F (cm)
10.0
15.0
G
Centroid of compressive force
G (cm)
3.0
4.0
of reinforced concrete structures. The evaluation of the bond strength of reinforcing bars in structural concrete elements is important to evaluate the feasibility of placement self-compact-ing concrete. There is some experimental data about the bond behavior comparing self-compacting concrete and ordinary concrete using beam tests, but there is few data related to numerical simulations about the bond phenomena. The impor-tance of this research lies on these two aspects, where it aims to contribute.
2. Summary of the experimental program
The experimental program was part of a wider research on the bond behavior on self-compacting concrete. The beam geometry was based in the model established by [12]. Figure 1 shows the geometry of the adopted beam.
The position and the inclination of the bars during the casting had a signiicant inluence on the bond resistance and the specimens cast in the vertical direction presented larger bond resistance than the models cast horizontally. The monotonic displacement ap-plied varied with the bar diameter; so, for 10 mm steel bar, the displacement rate was 0.01 mm/s and for the 16 mm steel bar, the displacement rate was 0.016 mm/s, until failure. The deforma-tion rates were calculated dividing the steel bar diameter by 1000 achieving similar results as Rilem recommendations [7].
Figure 2 shows the test set-up for the beam specimens. The data from these LVDT were used to determine the slip of the steel bar. Electrical resistance strain gauges were placed in ive points of the placed close to the concrete prism surface, the concrete splitting
failure occurs. On the other hand, if no reinforcement is added to the concrete prism, the bond strength depends, almost totally, of the concrete compressive strength.
According to the current technical literature, the beam test is more reliable to investigate bond behavior, since it relects the behavior under pure lexure and considers the effects of tension cracks. Few researches were performed using beam models with self-compacting concrete, being this absence of data a motivation for this research. According to the literature, SCC appears to improve the bond strength, due to its illing ability to involve the reinforcement. This improvement was not signiicant, but the ex-perimental data proved the use of self-compacting concrete pos-sess, at least, the same behavior of similar models made with ordinary concrete [7, 11].
1.1 Justiication
In this paper, the behavior of beams specimens was studied through experimental tests and numerical analysis using the inite elements method. The main objective was evaluating the load
vs. displacement and load vs. slip behavior and the bond stress, regarding the inluence of the numerical parameters involved in the used software. The secondary objective was to compare, by numerical models, the bond behavior of self-compacting concrete (SCC) with ordinary concrete (OC), and show the bond stress dis-tribution on the contact surface.
This research has special significance in construction practice
Figure 2 – Beam test set-up
LVDT LVDT
Steel hinge
Spreader beam
Instron's plate support Load cell
Instron's hinge Instron's piston
Support beam Piston support
Reaction slab Load
direction
for each series, according to the concrete compressive strength. So, for SCC1 and OC1 series (fc = 30 MPa), the failure was characterized by high slip of the steel bar with low displacement of the beam and, and for SCC2 and OC2 series (fc = 60 MPa), the failure was characterized by the yield of the steel bar with low slip and the beam presenting high vertical displacement.
3. Numerical approach
The failure in steel-concrete interface could be attained by combining Coulomb’s frictional hypothesis with a bound for the maximum tensile stress, resulting in two different failure modes that could be called sliding failure and separation failure [10]. The sliding failure is assumed to occur in a section when the shear stress exceeds the sliding resistance and should be de-termined by two parameters: the cohesion (c) and the friction coefficient (m).
In previous studies [15-18] the variation of the frictional coef-icient and the cohesion seemed not to affect the general re-sponse of the bond in the contact surface. However, the number of elements in the contact surface, and parameters like FKN (normal contact stiffness factor), FKT (tangent contact stiffness factor) and IT (iteration number), presented in Ansys® software, affect directly the load vs. slip behavior, according to the adopt-ed bond model [15-16]. But, it is worth to mention that the differ-ences between the two materials (SCC and OC) are restricted to the material’s properties.
3.1 Materials
Compressive strength and elasticity modulus of concrete were ob-steel bar, near the bonded region and in the middle of the bar,
as shown in Figure 3. According to the technical literature, the application of strain gages on the steel-concrete interface must be avoided due to its high inluence on the bond stresses; how-ever, some researches good estimation of the bond stress dis-tribution with this procedure [13-14]. So, the strain gages where placed at the beginning and at the end of the embedment length to measure the strain variation, and an additional strain gage was placed in the middle of the bar (Figure 3).
The used cement was Ciminas CP-V Ari Plus (initial high strength cement). The used siliceous sand had density of 2.63 kg/dm3 and absorption of 4.0% and the used crushed gravel had density of 2.83 kg/dm3 and absorption of 1.71%. The used superplasticizer was based on carboxylate, with density of 1.1 kg/dm3 and 20% of solid content. Table 1 shows the materials contents and the results for fresh SCC. Table 2 shows the hard-ened properties of SCC series and OC series.
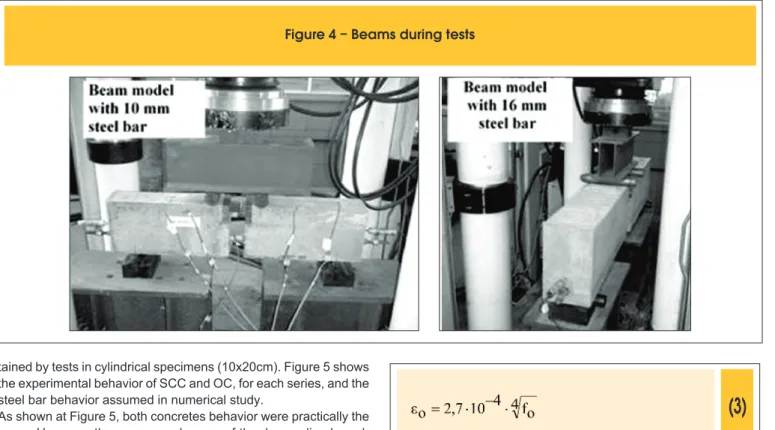
Figure 4 shows some of the specimens, a beam cast with OC with 10 mm steel bar and a beam cast with SCC with 16 mm steel bar the beams, during tests at the universal test ma-chine, Instron.
According to the experimental results, the failure was different
Figure 3 – Steel bar instrumentation
10 mm steel bar
16 mm steel bar
Unbonded zone Bonded zone
SG SG
SG SG
Unbonded zone Bonded zone
SG SG
SG SG
25,0
22,0 16 25,0 16 22,0
13,75 10 16,25
13,75 10 16,25
SG - Strain Gage
Table 1 – Materials content and fresh results for SCC series
Material
OC1
OC2
SCC1
SCC2
Tests
SCC1
SCC2
Cement (kg)
Sand (kg)
Gravel (kg)
Water (kg)
Superplasticizer (%)
Filler (kg)
Silica fume (kg)
Slump test
Slump flow (cm)
T (s)
50L-Box test
T (s)
60RB
V-Funnel
T (s)
v365.3
883.9
942.3
260.8
–
–
–
488.3
766.6
942.4
227.0
–
–
–
338.8
854.8
919.1
273.6
0.4%
101.6
–
–
67.5
1.0
–
1.0
0.95
–
1.5
365.1
815.3
876.7
146.1
0.75%
146.1
36.5
–
61.0
1.0
–
1.0
0.9
–
2.0
Table 2 – Hardened results for SCC
and OC series
Hardened
properties
OC1
OC2
SCC1
SCC2
f (MPa)
cE (MPa)
cf (MPa)
cttained by tests in cylindrical specimens (10x20cm). Figure 5 shows the experimental behavior of SCC and OC, for each series, and the steel bar behavior assumed in numerical study.
As shown at Figure 5, both concretes behavior were practically the same. However, there was an absence of the descending branch of the post-peak of its behavior, which could be achieved by using Popovics’ formulation [19], shown below (Eq. 1 to 3).
(1)
(2)
(3)
This formulation takes into account the variation of the concrete compressive strength in the post-peak branch. According to Popo-vics’ theory, the relation between the initial modulus of elasticity (Ec) and the secant modulus of elasticity (Ecs) can vary until 4.0 for normal strength concretes and in 1.3 for high strength concretes.
3.2 Mesh, load and inite elements
Figure 6 shows the used mesh for the numerical models; due to the symmetry, only a quarter of the beam model was studied. Experimental investigation of the bond stress response was
Figure 4 – Beams during tests
Figure 5 – Stress vs. strain behavior of steel and concrete
-1 0 1 2 3 4 5
-5 0 5 10 15 20 25 30 35
St
re
ss
(M
P
a)
Strain (‰)
OC1 SCC1 Popovics (1973)
-0,5 0,0 0,5 1,0 1,5 2,0 2,5 -10
0 10 20 30 40 50 60 70
Ec (CAA) = 32,73 GPa Ec (CC) = 32,61 GPa
S
tr
es
s
(M
P
a)
Strain (‰)
OC2 SCC2
0 2 4 6 8 10
0 100 200 300 400 500 600 700
Es (10 mm) = 207.05 GPa Es (16 mm) = 209.18 GPa
S
tr
es
s
(M
P
a)
Strain (‰)
performed using the specimen geometry shown in Figure 1. The specimens consisted of a steel bar with 10 and 16 mm of nominal diameter, anchored in 100 and 160 mm embedded length in the concrete beam, respectively.
The roughness (including the steel bar ribs) of the steel bar was not considered and a plain contact surface was adopted in the
numerical study. This assumption was made based on previous researches that shown the inluence of the steel bar ribs were not signiicant, due the use of the FKN (normal contact stiffness factor) and FKT (tangent contact stiffness factor) parameters, according to the adopted bond model [15-16]. The inite elements used on the mesh were: for concrete elements, Solid65; for steel elements, Solid45; for contact surface, Conta174 and Targe170 [20]. Figure 7 shows the constraints for the numerical model.
The load was applied according to the maximum displacement measured on the test at a constant rate. The mesh was made to allow the same point of application of the load as was applied on the test. Table 4 shows the tests results and the values used for the numerical approach (FKN, FKT and D).
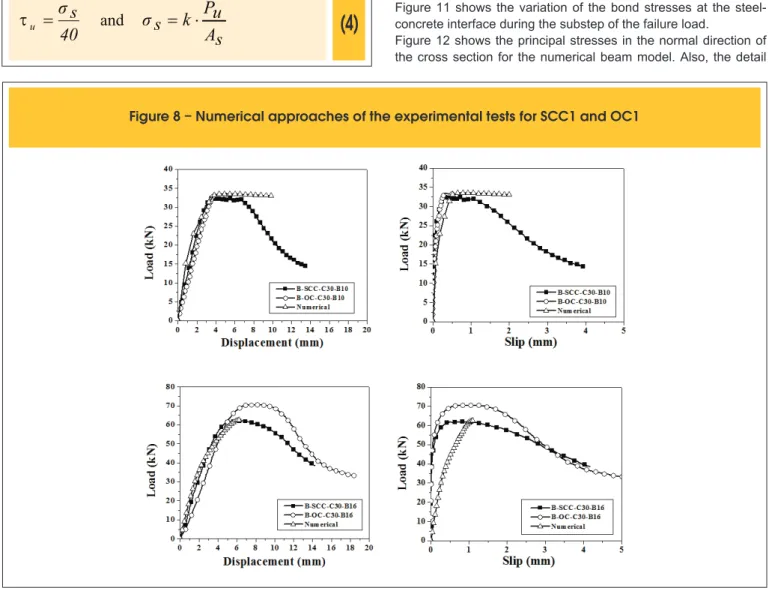
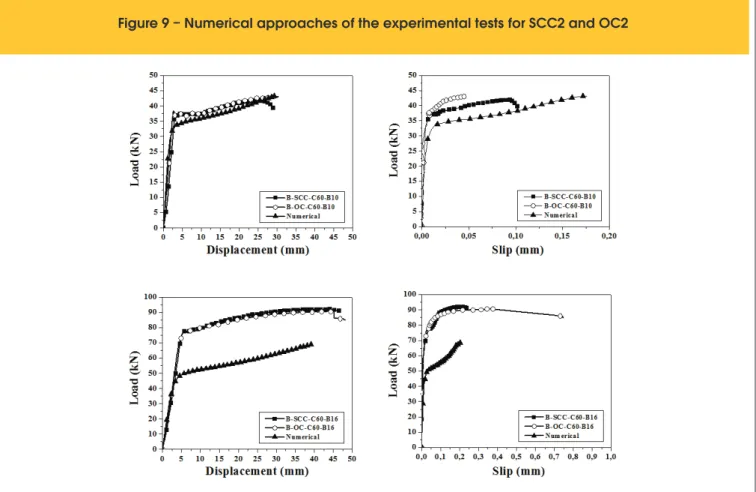
Figure 8 and Figure 9 shows the numerical behavior compared with the test results.
Table 5 shows the comparison between the numerical and experi-mental results.
According to Table 5, there was good approach of the numerical and experimental results. The slip of the numerical model was less accurate than the displacement prevision for both steel bar mod-els. The beam model with 10 mm steel bar was better represented by the numerical model than the model with 16 mm steel bar. This could be caused by the adopted mesh, which could reduce the ac-curacy of the numerical approach.
Figure 6 – Numerical mesh adopted
Beam model with 10 mm steel bar. Concrete elements and full model Beam model with 16 mm steel bar. Concrete elements and full model
A
B
Figure 7 – Considerations for the
numerical model
Beam
Steel
Hinge
bar
Table 3 – Specimens division for tests
Model
Concrete type
Bar diameter
30 MPa
60 MPa
Concrete compressive strength
B-SCC-C30-B10
B-SCC-C30-B16
B-OC-C30-B10
B-OC-C30-B16
B-SCC-C60-B10
B-SCC-C60-B16
B-OC-C60-B10
B-OC-C60-B16
SCC
SCC
OC
OC
SCC
SCC
OC
OC
4. Analysis and discussion
The numerical model had the same parameters of the experimental one, like modulus of elasticity and the applied load, justifying the development of one model for each series. In the contact evaluation, the numerical results were compared with those given by Eq. 4 [12].
(4)
40
s
σ
u
and
s
A
u
P
k
s
σ
Figure 10 shows the measurement points adopted for the bond stress evaluation.
The evaluated stresses were obtained by the contact elements on the interface and by the concrete elements under the con-tact surface.
4.1 SCC1 and OC1 series
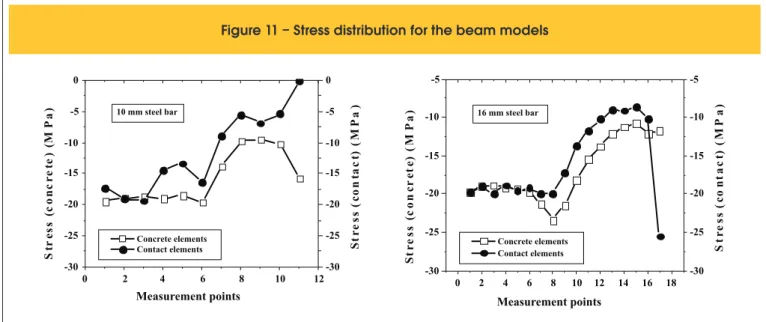
Figure 11 shows the variation of the bond stresses at the steel-concrete interface during the substep of the failure load.
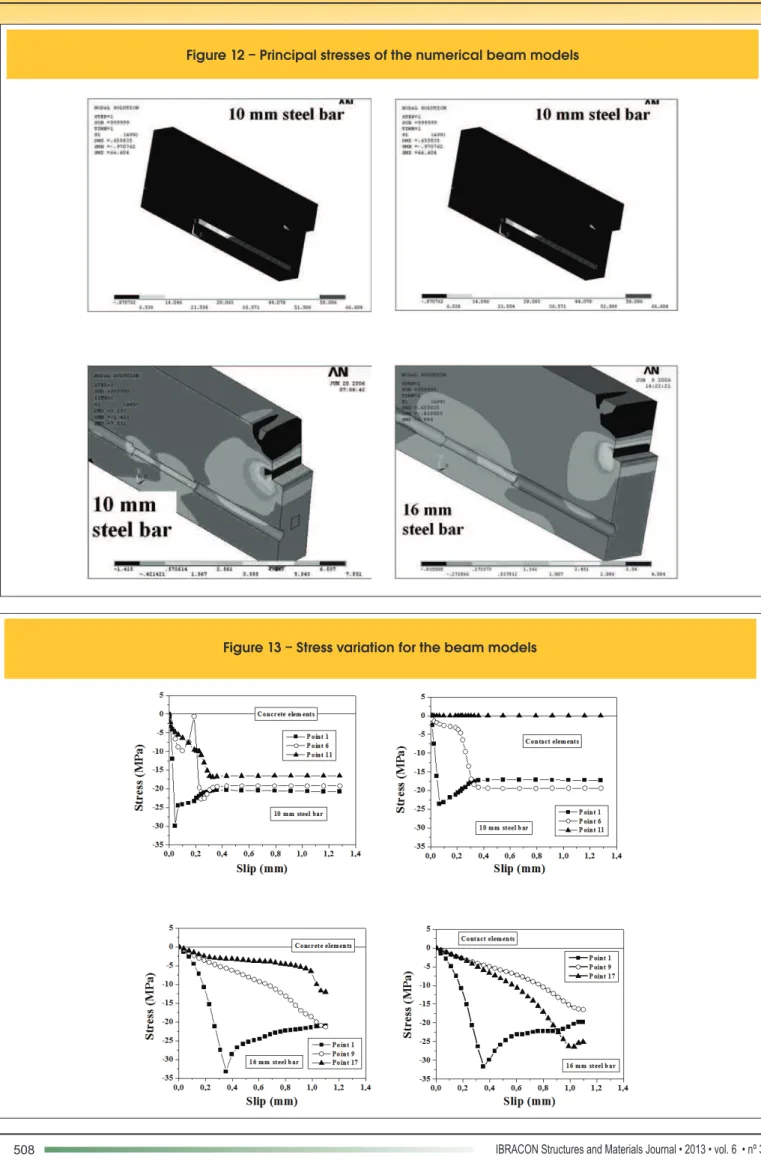
Figure 12 shows the principal stresses in the normal direction of the cross section for the numerical beam model. Also, the detail
Table 4 – Specimens division for tests
Model
P
u(kN)
(mm)
δ
u(mm)
s
uD
(mm)
FKN
FKT
τ
u(MPa)
B-SCC-C30-B10
B-SCC-C30-B16
B-SCC-C60-B10
B-SCC-C60-B16
B-OC-C30-B10
B-OC-C30-B16
B-OC-C60-B10
B-OC-C60-B16
32.66
61.99
42.35
92.48
33.49
70.77
41.58
90.84
3.97
6.59
27.08
40.96
3.82
7.32
29.87
42.95
0.398
0.938
0.096
0.215
0.295
0.758
0.068
0.660
12.0
18.0
31.0
50.0
12.0
18.0
31.0
50.0
3
40
0.0001
0.0001
3
40
0.0001
0.0001
1/0.15
1
1
1
1/0.15
1
1
1
13.00
11.57
16.86
17.25
13.33
13.20
16.55
16.95
of each beam without the steel bar and the steel hinge are shown. According to the numerical results, the variation of the stress-es at the steel bar is noticed, mainly for the beam with the 16 mm steel bar. Also, the stress at the steel-concrete interface shows a gradual variation, beginning at the start of the
de-velopment length until the other edge. The stresses shown in Figure 12 are in kN/cm2 and the positive sign indicates tension.
Figure 13 shows the stress variation from the concrete and con-tact elements.
Figure
9 – Numerical approaches of the experimental tests for SCC2 and OC2
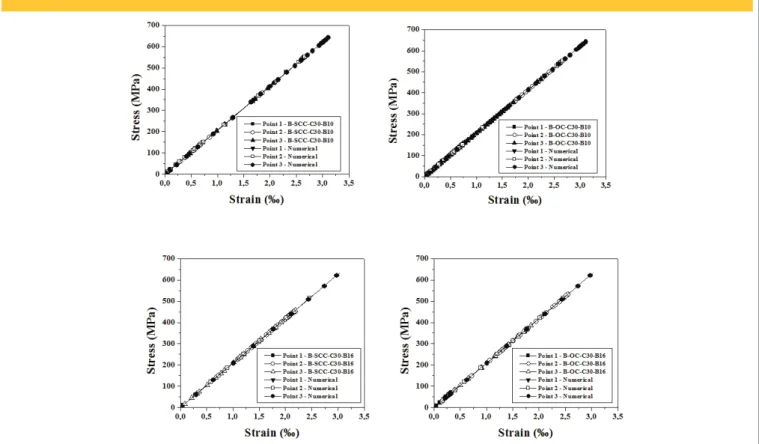
According to Figure 13, the stress behavior on the contact surface and in the concrete elements was almost the same. The point 1 presented the same behavior for both cases while the points 9 and 17 presented a signiicant difference, showing that the concrete el-ements have a gradual transfer of stresses, because the stress at point 9 is higher than at point 17. Also, the stress calculated by the contact elements at point 17 was higher than the stress on point 9. Figure 14 shows the comparison between the stresses from the test results of the strain gages placed on the steel bar and the numerical results.
As expected, according to Figure 14, the test results from the strain gages showed that the strains at the steel bar were linear for both models, showing that the numerical result led to a satis-factory approach.
4.2 SCC2 and OC2 series
Figure 15 shows the variation of the bond stress at the steel-con-crete interface during the substep of the failure load.
Figure 16 shows the principal stresses at the cross section nor-mal direction for beam numerical models. Also, the details of each beam without the steel bar and the steel hinge are shown. According to the numerical results, the variation of the stress-es at the steel bar can be observed, for both casstress-es. Also, the stress at the steel-concrete interface shows a gradual varia-tion, from the start of the development length until the other edge. Figure 17 shows the stress variation of the concrete and contact elements.
According to Figure 17, for both models with 10 and 16 mm, the general behavior was the same. The concrete elements present-ed the same behavior for the points 1 and 17, while the point 9 presented signiicant differences in its behavior. For the contact elements, it appears that only the point 1 resists to the steel bar sliding, because, for the other points, the calculated stresses were around zero. Figure 18 shows the comparison between the stress-es from the tstress-ests rstress-esults for the strain gagstress-es placed on the steel bar and the numerical results.
As expected, due to the high strength of the concrete, the results of the strain gages showed that the strains at the steel bar were non-linear for both models, showing that the numerical results led to a satisfactory approach (Figure 18).
4.3 Analysis of the bond behavior between
the series
According to the numerical results, the bond stress measured by contact and concrete elements assumed similar values for nor-mal concrete compressive strength, while for high strength con-crete there was high difference, mainly provoked by the contact elements.
According to Figure 11, the bond stress shows that there was a decreasing of its magnitude along the development length, but the
Figure 10 – Measurement points on the
bonded zone and on the steel bar
. śĂ▓
P
3P
2P
1P
1P
11P
6P
1P
17P
910 mm steel bar
16 mm steel bar
5
Steel bar
points of
Bonded zone
measurement
points of
measurement
Figure 11 – Stress distribution for the beam models
0 2 4 6 8 10 12
-30 -25 -20 -15 -10 -5 0 Concrete elements Contact elements Measurement points S tr es s (c on cr et e) (M P a) -30 -25 -20 -15 -10 -5 0
10 mm steel bar
St re ss (c on ta ct ) (M P a )
0 2 4 6 8 10 12 14 16 18 -30 -25 -20 -15 -10 -5 Concrete elements Contact elements Measurement points St re ss (c on cr et e) (M P a) -30 -25 -20 -15 -10 -5
16 mm steel bar
measured value showed a minimal stress presented in the steel bar surface. This assumption shows that the beginning of the de-velopment length was being used resisting the slip, while the other points on surface help only with a minimal amount of stress, dis-tributed in it.
For the high strength concrete, both numerical models (with 10 and 16 mm steel bars) showed similar behavior, also observed in the previous series. However, at failure an increase of bond stress at the end of the development length was observed. This behavior may be explained by the nature of the model’s failure, occurred by the steel bar yielding.
5. Conclusions
The presented paper describes the numerical and experimental investi-gation performed to evaluate the bond strength. Beam models based on the Rilem recommendation were used, comparing ordinary concrete and self-compacting concrete of same compressive strength. The numerical approach was based on inite element method, using Ansys® software. According to the results, the following conclusions can be made: 1. The beam models with self-compacting concrete and ordinary
concrete produced similar results, with a small advantage for the ordinary concrete;
Figure 1
5 – Stress distribution on the steel-concrete interface for the beam models
0 2 4 6 8 10 12
-30 -25 -20 -15 -10 -5 0
Concrete elements Contact elements
Measurement points
S
tr
es
s
(c
on
cr
et
e)
(M
P
a)
-80 -70 -60 -50 -40 -30 -20 -10 0
10 mm steel bar
S
tr
es
s
(c
on
ta
ct
)
(M
P
a)
0 2 4 6 8 10 12 14 16 18 -30
-25 -20 -15 -10 -5 0
Concrete elements Contact elements
Measurement points
S
tr
es
s
(c
on
cr
et
e)
(M
P
a)
-30 -20 -10 0
16 mm steel bar
S
tr
es
s
(c
on
ta
ct
)
(M
P
2. The numerical models presented good approach with the test results, mainly for the failure load and for the displacement val-ues; however, the slip results could not be well represented. The differences between the measured slip compared to the numerical results reached almost 54% (B-OC-C30-B10); 3. The stress vs. strain behavior of the steel bar was well
repre-sented by the numerical approach, giving reliable results and ensuring the numerical model can represent the test;
4. According to the stress distribution of the steel-concrete interface, both analyzed elements types (contact elements and concrete elements under the contact surface) showed similar results. However, the analysis of the variation of the stress during the test showed a better behavior when considering concrete elements, for both concrete com-pressive strength.
5. The strain pattern measured by test specimens showed the main strain values in the middle of the steel bar and in the posi-tion right before the embedment length. The numerical models showed the same behavior, but with inferior values that those obtained by test specimens. This may be explained by the yield limit established for the steel bar, which reduced the strain of the steel bar in the numerical models.
Finally, the utilization of numerical models to represent the bond behavior in a beam test, using ordinary concrete (OC) and self-compacting concrete (SCC), presented a good approach, showing that the concrete type did not affect the bond response, since the materials’ properties were similar. Also, according to the results,
Figure 18 – Comparison between the test results from the strain gages and the numerical result
the adopted parameters could be extended for others models with different compressive strength and other bar diameters.
6. Notation
t= Bond stress, MPa;
tu = Bond stress at the failure load, MPa; P
u= Failure load, kN;
k = Assumes 1.25 for f < 16 mm and 1.50 for f ≥ 16 mm; ss= Steel bar stress, MPa;
l
d= Development length, mm;
D = Displacement applied by the piston during test, mm;
fs= Steel bar diameter, mm; f
c= Concrete compressive strength, MPa;
s
u= Slip at the failure load, mm;
du= Maximum beam vertical displacement, mm; l= Experimental vs. numerical ratio;
f
o=Cylinder concrete compressive strength, MPa; e= Strain caused by the fc concrete stress, ‰; eo= Strain at cylinder concrete failure, ‰; FKN = Normal contact stiffness factor; FKT = Tangent contact stiffness factor.
7. Acknowledges
com-material donation.
8. Reference
[01] Bartos, P.J.M. 2000. Measurement of key properties of fresh self-compacting concrete. Proceedings of Measurement, testing and standardization: future needs in the ield of construction materials, Paris, 5-6 June, 6 p.
[02] Okamura, H. 1997. Self-compacting high-performance concrete. Concrete International, 19 (7): 50-54. [03] Gomes, P.C.C. 2002. Optimization and characterization
of high-strength self-compacting concrete. PhD. PhD Thesis, Universitat Politècnica de Catalunya, Escola Tècnica Superior D’Enginyers de Camins, Canals i Ports de Barcelona, 140 p., Barcelona, Spain. [04] Dehn F., Holshemacher K., and Weiβe, D. 2000.
Self-compacting concrete (SCC) time development of the material properties and the bond behavior. Proceedings of LACER, No. 5, 10 p.
[05] Holshemacher, K., Dehn, F., and Weiβe, D. 2002. Bond in high-strength concrete – inluence of rebar position. Proceedings of the 6th international symposium on utilization of high strength / high-performance concrete, Leipzig, Germany, pp.289-298. [06] Almeida Filho, F.M., De Nardin, S., and El Debs,
A.L.H.C. 2005. Evaluation of the bond strength of self-compacting concrete in pull-out tests. Proceedings of the Second North American Conference on the Design and Use of Self-Consolidating Concrete and Fourth International RILEM Symposium on
Self-Compacting Concrete, Chicago, Illinois.
[07] Almeida Filho, F.M. 2006. Contribution to the study of the bond between steel bars and self-compacting concrete. PhD thesis, São Paulo University, São Carlos, 1-308. (in Portuguese)
[08] Chan, Y.-W., Chen, Y.-S., and Liu, Y.-S. 2003. Effect of consolidation on bond of reinforcement in concrete of different workabilities. ACI Structural Journal, 100(4): 294-301.
[09] Bangash, M.Y.H. 1989. Concrete and concrete structures: numerical modeling and applications. Barking: Elsevier science publishers Ltd., 687p.
[10] Nielsen, M.P. 1998. Limit analysis and concrete plasticity. CRC Press, 908p.
[11] Isa, M.M., and Aguado, A. 2003. Comportamento da aderência entre o concreto auto-adensável de alta resistência e a armadura. Proceedings of the V Simpósio EPUSP sobre Estruturas de Concreto, São Paulo-SP, Brazil (in portuguese).
[12] Rilem-Fip-Ceb, 1973. Bond test for reinforcing steel: 1-Beam test (7-II-28 D). 2-Pullout test (7-II-128): Tentative recommendations. Materials and Structures, 6(32): 96-105.
[13] Hamza, A.M., and Naaman, A.E. 1996. Bond characteristics of deformed reinforcing steel bars embedded in SIFCON. ACI Materials Journal, 93(6):578-588
stress-slip relationship in reinforced concrete. ACI Journal, 76(1):19-45.
[15] Almeida Filho, F.M., De Nardin, S., and El Debs, A.L.H.C. 2004. Interface aço-concreto: análise dos parâmetros do contato e sua inluência na simulação via MEF. Proceedings of the XXV CILAMCE: Iberian Latin American Congress on Computational Methods, Recife-PE, Brazil (in portuguese).
[16] De Nardin, S., Almeida Filho, F.M., and El Debs, A.L.H.C. 2005a. Non-linear analysis of the bond strength behavior on the steel-concrete interface by numerical models and pull-out tests. Proceedings of the ASCE Conference “Structures 2005”, Vol. 171, New York, USA.
[17] De Nardin, S., Almeida Filho, F.M., El Debs, A.L.H.C., and El Debs, M.K. 2005b. Steel-concrete interface: inluence of contact parameters. Proceedings of the FIB International Conference: “Keep concrete attractive”, Budapest, Hungary, 6p.
[18] Haach, V.G., Oliveira Filho, J., Almeida Filho, F.M., De Nardin, S., and El Debs, A.L.H.C. 2004. Simulação numérica comparativa do comportamento da aderência em modelos tridimensionais e axissimétricos de arrancamento. Proceedings of the XXV CILAMCE: Iberian Latin American Congress on Computational Methods, Recife-PE, Brazil (in portuguese).
[19] Popovics, S. 1973. A numerical approach to the complete stress-strain curves for concrete. Cement and concrete research, 3(5): 583-599.