*e-mail: [email protected]
1 Introduction
In order to reduce production costs and to enhance adhesion between the electrodes and electrolyte in Solid Oxide Fuel Cells (SOFC) it is of great interest to perform a single sintering process of the whole cell. The main obstacle to perform the single sintering is the temperature needed to densify the electrolyte, since it is usually a high refractory ceramic. The high temperature needed to densify the electrolyte lead to secondary phase formation in the electrode/ electrolyte interfaces, increasing its electrical resistance, decreasing the cell performance.
One way to reduce the sintering temperature is using sintering additives, such as transition metal oxides. In general, by using these additives, it is possible to attain dense ionic conductor electrolytes in temperatures up to 300 °C lower when compared to samples which these sintering additives were not used. The main issue when using sintering additives in ionic conductor electrolytes is that depending on the quantity used, besides lowering the sintering temperature, it also inluences the electrical properties.
ZnO is widely used in protonic conductor perovskites, such as doped BaCeO3 and BaZrO3 1–7. In order to achieve high densities, these materials must be sintered at temperatures as high as 1700 °C. Using ZnO as a sintering additive, the sintering temperature can be lowered down to 1500 °C. The sintering mechanism is probably via liquid, since there is a low temperature euthetic formed by BaO. ZnO. The backdrop is that, since BaO from the perovskite is being consumed to form the liquid phase, the perovskite structure destabilizes, forming secondary phases which are detrimental to the electrical properties. The inal electrical
conductivity will be dependent on the amount of ZnO used and the sintering programm. It was also reported that at a concentration higher than 4 mol% lowers the ionic transport number of these electrolytes, probably due to a ZnO rich ilm in the grain boundaries, forming a percolated network of an n type semiconductor 3,5,6.
ZnO has also been used as sintering additive on rare-earth doped ceria electrolytes 8,9. In the ZnO- rare earth doped ceria electrolytes, the sintering temperature was lowered from 1500 °C down to 1350 °C. The lattice parameter of rare earth doped ceria samples decreases as ZnO content increases up to 0.6 mol%, remaining constant at higher concentrations due to ZnO solubility limit at this concentration, conirmed by the detection of a secondary phase in concentrations higher than 0.8 mol% by SEM images. The inal electrical properties of ZnO/ rare earth doped ceria electrolytes will depend on the powder synthesis route and the ZnO concentration. ZnO inluences the electrical properties of this electrolyte system in two ways, the irst one is increasing the electrical conductivity simply by the increase of density and the second one is decreasing the electrical conductivity due to defect interaction. In order to obtain samples sintered at lower temperatures with electrical conductivity similar to the ones without sintering additive it is important to optimize the contribution of both effects.
YSZ is the state-of-the-art electrolyte for SOFC. It is chemically stable under the fuel cell working conditions, but during sintering it can react with Cr- based electrodes. Lowering its sintering temperature would avoid this reaction, enhancing the electrode/ electrolyte interface electrical conductivity. There are several studies showing the use of sintering additives in YSZ 10–14. In a nutshell, the main issues
Microstructural and Electrical Features of Yttrium Stabilised
Zirconia with ZnO as Sintering Additive
Raphael Fortes Marcominia,b*, Dulcina Maria Pinatti Ferreira de Souzac
aDepartamento de Engenharia de Produção e Mecânica, Faculdade de Engenharia,
Universidade Federal de Juiz de Fora – UFJF, Rua José Lourenço Kelmer, s/n, Campus Universitário, Bairro São Pedro, CEP 36036-900, Juiz de Fora, MG, Brazil
bPrograma de Pós Graduação em Ciência e Engenharia de Materiais, Departamento de Engenharia de
Materiais – SMM, Escola de Engenharia de São Carlos – EESC, Universidade de São Paulo – USP, Av. João Dagnone, 1100 Jd. Sta Angelina, CEP 13563-120, São Carlos, SP, Brazil
cPrograma de Pós-Graduação em Ciência e Engenharia de Materiais, Universidade Federal de
São Carlos – UFSCar, Rod. Washington Luis, km 235, CEP 13565-905, São Carlos, SP, Brazil
Received: March 16, 2015; Revised: October 28, 2015; Accepted: November 17, 2015
Adding ZnO reduces sintering temperature of yttria stabilized zirconia. Adding up to 0.5 wt% of ZnO is possible to densify to 8 mol% yttria stabilized zirconia (TZ8Y) to 95% of relative density at 1300 °C, besides, the electrical conductivity increases about 30% at 800 °C when compared to pure TZ8Y with the same relative density and average grain size. These results show that TZ8Y co-doped with ZnO can be a potential electrolyte to solid oxide fuel cells and electrolyzer cells.
when using sintering additives in YSZ are destabilization of the cubic phase and secondary phase formation, both decreasing total electrical conductivity.
Using ZnO as a sintering additive in YSZ was reported by Liu, Lao15. In their work it was reported that ZnO is soluble up to 10 wt% in the YSZ lattice. Using ZnO, it was possible to decrease sintering temperature from 1500 °C down to 1300 °C and the electrical conductivity increased when using small amounts of ZnO, up to 0.5 wt%.
Fleger et al., 16 analysed the influence of several sintering additives on cubic zirconia added from barium, bismuth, calcium, cobalt, copper, iron, lithium, magnesium, manganese, nickel, strontium or zinc nitrates ranging from 1 to 3 at%. It was found that Fe, Mn, Ni, Co and Zn were conirmed to enhance 8YSZ sintering without destabilizing the cubic structure.
Despite the interesting results from Liu, Lao 15, in order to use YSZ- ZnO solid solutions as SOFC electrolytes, it is important to evaluate the YSZ- ZnO electrolytes under the SOFC reducing atmosphere working conditions, since ZnO is a well known n-type conductor in reducing atmospheres. This work will evaluate the inluence of ZnO as a sintering additive on the microstructure and electrical properties of YSZ and its prospect to be used as SOFC electrolytes.
2 Experimental
Proper amounts of YSZ, with yttrium content ranging from 3 to 10 mol% (Tosoh TZ3Y, TZ8Y and TZ10Y) and ZnO(Sigma Aldrich), content ranging from 0 up to 5 wt% were dispersed in iso-propanol containing PVB (Solutia B98) as dispersant. This suspension was homogenized for 6 h in a vibratory mill. After drying and granulating using a 140 µm sieve, the powder was isostatic pressed at 200 MPa into cyllindrical pellets, of 10 mm diameter and ca. 1.3 mm height. These pellets were subsequently sintered at 1300 °C/ 2 h. As a reference, a ZnO free TZ8Y sample was produced the same way and sintered at 1400 °C/ 2 h, temperature which ZnO doped YSZ and ZnO free YSZ samples present present densities higher than 95%.
2.1 Electrical Characterization
After sintering, platinum electrodes were painted on both faces of the pellets and spectroscopy impedance was performed using a HP 4192 gain phase analyser, in the temperature range from 300 to 800 °C, sinusoidal perturbation voltage of 100 up to 500 mV and frequency ranging from 5 Hz to 13 MHz. The results were independent of applied perturbation voltage, but the spectra taken at 500 mV presented better noise to signal ratio, so they were used for data processing and itting.
In order to evaluate the electrical behavior under reducing atmosphere, the samples were soaked at Ar and Ar/ H2 atmospheres for 2 h at 800 °C in order to achieve equilibrium. Oxygen partial pressure was monitored using a zirconia oxygen sensor of the outlet gas mounted in a furnace at constant temperature. After equilibrium was achieved, impedance spectroscopy was performed using the same parameters described before. The data from impedance spectroscopy analysis were itted using ZView, Scribdner Associates.
2.2 Microstructural Characterization
In order to evaluate the inluence of the sintering additive on the microstructure the sintered samples were grinded and polished downt to 1 µm diamond paste. After polishing, the samples were thermally etched at 1200 °C/ 30 min. The polished samples were analyzed by SEM coupled with EDS. Quantitative image analysis was performed using ImageJ (National Institute of Health) 17 .
The samples were also submitted to X ray diffraction analysis to detect the phases formed, Siemens D5000, CuKα radiation 0.1541 nm, 2θ ranging from 15 to 90 °, 0.033 ° step and 1 s acquisition time at room temperature.
For a iner analysis, Raman spectra were recorded at room temperature in back scattering geometry with a T64000 Jobin-Yvon triple spectrometer equipped with a CCD detector using the green line of an Ar+ laser (excitation wavelength 514.5nm).
3 Results and discussion
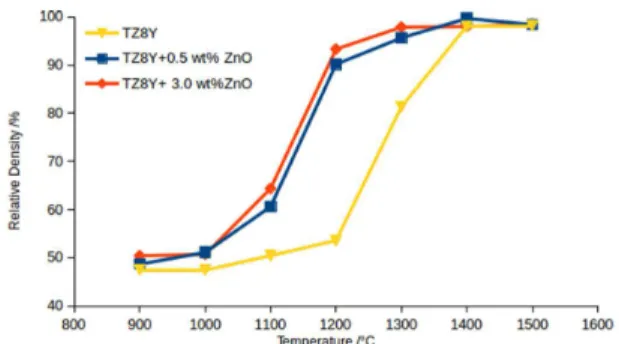
As can be seen in igure 1, sintering of YSZ, both with and without ZnO, starts at 1100 °C. When using ZnO as sintering additive, sintering ends at 1300 °C, while it only ends at 1400 °C in the reference. Besides lowering the temperature that sintering is completed, the density versus temperature curve is steeper when ZnO is added.
A similar phenomenum is observed by Dong et al., 18 and Kleinlogel, Gauckler 19 which is attributed to a liquid phase formed between the sintering additive and the matrix in nanosized ceria solid solutions. It has already been proposed by Liu, Lao 15 that the sintering mechanism when using ZnO as sintering additive is viscous lux, but it was not found any data about liquid formation neither between ZnO and ZrO220 nor between ZnO and Y
2O3. A possible source for the liquid phase is SiO2 impurities, since the system SiO2- ZnO presents an euthetic at 1510 °C 21, that can be lowered by the presence of other oxides.
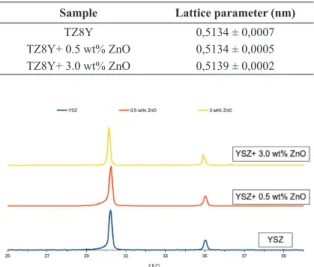
XRD diffractograms do not show any secondary phase, igure 2. Since the ionic radii of Zr4+ and Zn2+ are similar, 0,84 and 0,74 Å respectively 22, solid solution formation does not change considerably the cubic lattice parameter, table 1. SEM images show that up to 3.0 wt% ZnO there are only two phases present, igure 3. It can be seen from these images a bimodal grain size distribution, with large grains, ~1 µm,
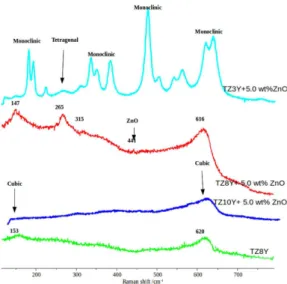
Raman spectra shows that when using either TZ3Y or TZ8Y as matrix, the presence of ZnO shifts the equilibrium of the partially stabilized zirconia, destabilizing the cubic structure to the tetragonal structure, and the tetragonal structure to the monoclininc structure. On using a matrix with higher yttrium content, TZ10Y, the ZnO effect on shifting the equilibrium and destabilizing the cubic structure is hindered. By comparing SEM images with Raman spectra, it can be assumed that the small spheres are either tetragonal or monoclinic zirconia particles. Since neither of these phases were detected by XRD, its volume is probably lower than 5% (lower detection limit of XRD equipment), and it would not affect the electrical properties as discussed elsewhere 23,24.
ZnO affected the electrical properties of the TZ8Y samples, igure 5. When ZnO is dissolved into the TZ8Y lattice it yields:
ZnO → ZnZr”+ Vo°° (1)
increasing the oxygen vacancy concentration, which would increase conductivity. On the other hand, the volume of the liquid phase responsible for lowering the sintering temperature increases as the ZnO content increase. The higher its volume, the higher is the blocked area at grain boundaries due to this isolating liquid phase. These two effects, increase of electrical conductivity due to charge carrier concentration and decrease due to a blocking secondary phase at grain boundaries, must be balanced in order to obtain the desired properties, in this case, high ionic conduction.
The impedance spectra from igure 5 were itted using the equivalent circuit from igure 5e and Zview software. In this circuit R1 is the bulk resistance, which is a function of composition and R2 is the blocker resistance, which is a function of microstructural features such as grain size, grain boundary thickness, porosity, inclusions, voids and so on [24]. Constant phase elements CPE1 and CPE2 are also related to Figure 2: XRD diffractograms of TZ8Y sintered at 1400 °C/ 2 h
and TZ8Y+ZnO solid solutions sintered at 1300 °C/ 2 h.
Table 1: Lattice parameters calculated from X ray diffractograms.
Sample Lattice parameter (nm)
TZ8Y 0,5134 ± 0,0007
TZ8Y+ 0.5 wt% ZnO 0,5134 ± 0,0005
TZ8Y+ 3.0 wt% ZnO 0,5139 ± 0,0002
homogeneously distributed and 100 nm spheres usually at grain boundaries. Due to the small size of these spheres it is not possible to determine its chemical composition via EDS. Since their size is smaller than the beam interaction volume, the point measurement would give the chemical composition from the matrix plus the secondary phase.
In order to understand the nature of these spheres, zirconia with several yttria contents were used. When comparing the microstructure from TZ10Y+5.0 wt% ZnO and TZ8Y+5.0 wt% ZnO, igures 3d and 3e respectively, it can be noticed that the spheres are present in the sample with TZ8Y and are not present in the sample containing TZ10Y. As an attempt to identify this secondary phase, Raman spectroscopy was performed on these samples and samples containing different amounts of yttrium, igure 4.
bulk and blocker features respectively. CPE is a non-ideal capacitor. To calculate capacitance from CPE, we used 25:
1 1
2
n n
n n
C = R Q sin π
-
(2)
where C is the capacitance, R is either the bulk or the blocker resistance, Q is the CPE pre-factor and n is the CPE exponent. The exponent n can vary between 0 and 1 (ideal capacitor) 25.
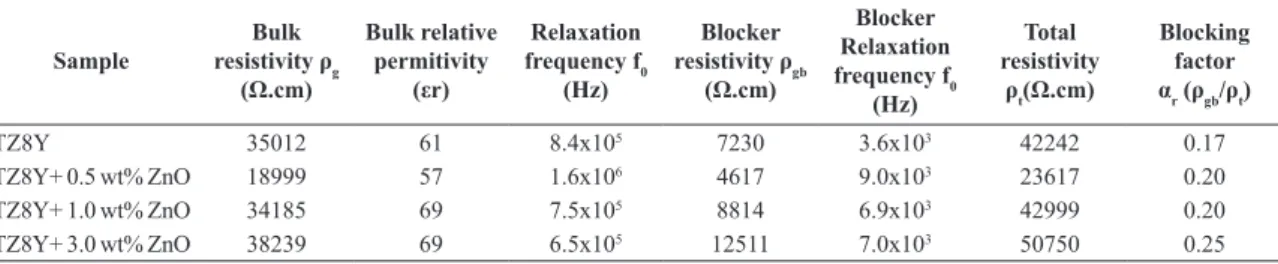
On analysing the impedance spectra, igure 5, it can be seen from the itting results, table 2, that the blocking factor (αr) from samples TZ8Y+ 0.5 wt% ZnO is higher than the blocking factor from TZ8Y, 0.20 and 0.14 respectively. This result shows that the microstructure plays a bigger role on the electrical conductivity of 0.5 wt% samples than on our reference sample (ZnO free TZ8Y), but since the bulk resistivity from 0.5 wt% samples is much lower, the total resistivity is much lower, ~42 kΩ.cm against ~24 kΩ.cm for TZ8Y+ 0.5 wt% ZnO at 350 °C.
When ZnO content is higher than 0.5 wt%, the number of mobile charge carriers decreases, increasing the bulk resistivity. The blocking factor increases, since the secondary phase volume also increases, thus reducing electrical conductivity to levels lower than the reference. Liu, Lao15 have shown similar results, where samples containing 0.5 wt% presented electrical conductivity 1.5 times higher than the reference YSZ at 800 °C.
Since ZnO is a well known n-type semiconductor, specially at low oxygen partial pressure, it was measured the electrical conductivity under reducing atmosphere, igure 6. It can be seen that even at low Po2, the conductivity remains stable, showing that ZnO in solid solution does not cause
n-type electronic conductivity in TZ8Y.
Since TZ8Y+ 0.5 wt% ZnO samples present conductivity 30% higher than the reference TZ8Y sample at 800 °C and is stable in a high range of Po2 (0.2- 10-24 atm) it is a potential material to be used as SOFC electrolytes.
It is also important to notice that adding only 0.5 wt% of ZnO to TZ8Y represents about 0.75 mol% of ZnO in relation Figure 4: Raman spectra of TZ8Y sintered at 1400 °C/ 2 h and
TZ8Y+ 5 wt% ZnO, TZ10Y+ 5 wt% ZnO, TZ3Y+ 5 wt% ZnO sintered at 1300 °C/ 2 h.
Figure 5: Impedance spectra measured at 350 °C, the small numbers are the log of frequency, for (a) TZ8Y sintered at 1400 °C (b) TZ8Y+ 0.5 wt% ZnO sintered at 1300 °C/ 2 h (c) TZ8Y+ 1.0 wt% ZnO sintered at 1300 °C/ 2 h (d) TZ8Y+ 3.0 wt% ZnO
to TZ8Y. According to equation (3), adding 0.75 mol% of ZnO to TZ8Y would represent an increase of about 10% on the oxygen vacancy concentration. Electrical conductivity is deined as:
= z e
σ µµ (3)
where z is the ion charge, e the charge of an electron, µ the charge carrier mobility and n the charge carrier concentration. Our results have shown that at 350 °C the electrical conductivity of TZ8Y+ 0.5 wt% samples are 80% higher than the reference TZ8Y samples, 4.23x10⁻⁵ S.cm-1 and 2.37×10⁻⁵ S.cm-1 respectively, while the bulk conductivity is 84% higher, 5.26x10⁻⁵ S.cm-1 for 0.5 wt% ZnO co-doped samples and 2.86x10⁻⁵ S.cm-1. At 800 °C the electrical conductivity is around 30% higher for the ZnO co-doped samples.
Using ImageJ 17, it was measured an average grain size of 0.7 ± 0.2 µm in the TZ8Y+ 0.5 wt% ZnO sample sintered at 1300 °C/ 2 h and an average grain size of 1.6± 0.3 µm in the reference TZ8Y sample sintered at 1400 °C/ 2 h. Since both samples have similar porosity and similar grain size, i.e., similar microstructural features, it is expected Figure 6: Conductivity at 800 °C under several Po2 of TZ8Y sintered at 1400 °C/ 2 h and TZ8Y+ ZnO solid solutions sintered at 1300 °C.
that this difference in electrical conductivity is not due to microstructural differences.
From equation 3, an increase of conductivity would be due to an increase in charge carrier concentration or charge carrier mobility. Since the increase in conductivity is much higher than the increase in charge carrier concentration (30% increase in conductivity at 800 °C and 84% increase of the bulk conductivity at 350 °C against 10% increase in charge carrier concentration!) it is possible to afirm, using equation 3, that besides an increase in charge carrier concentration, there is also an increase in charge carrier mobility. The cause of the enhancement in charge carrier mobility is still under investigation and will be published elsewhere.
4 Conclusions
ZnO is an eficient sintering additive in YSZ. The sintering temperature needed to achieve density > 95% drops from 1400 °C to 1300°C. When its added up to 0.5 wt%, besides lowering the sintering temperature, it also enhances its electrical conductivity when compared to a reference TZ8Y sample sintered at 1400 °C, . When higher amounts of ZnO are used, the electrical conductivity will be dependent on the sample thermal history since there is a blocking secondary phase formation that aids sintering. The electrical conductivity will be dependent on this secondary phase morphology. Despite ZnO is a well known n-type semiconductor, when used up to 3.0 wt%, its presence does not affect the solid solution electrolytic domain, what makes YSZ- ZnO solid solution a potential candidate to be used as SOFC electrolytes.
5 Acknowledgements
R.F. Marcomini acknowledges a thesis scholarship (process N◦ 2381-10-9) from CAPES. R. Martin and S. Coindeau, from CMTC (Grenoble-INP), are gratefully acknowledged for the SEM analysis and X-ray diffraction. Authors are thankful to D. Rouchon for RAMAN spectrometry
Table 2: Fitted impedance data using semicirquit from igure 5e.elements. Solid State Ionics doi: 10.1016/j.ssi.2009.04.002
Sample
Bulk
resistivity ρg (Ω.cm)
Bulk relative permitivity
(εr)
Relaxation frequency f0
(Hz)
Blocker
resistivity ρgb (Ω.cm)
Blocker Relaxation frequency f0
(Hz)
Total resistivity
ρt(Ω.cm)
Blocking factor
αr (ρgb/ρt)
TZ8Y 35012 61 8.4x10⁵ 7230 3.6x10³ 42242 0.17
TZ8Y+ 0.5 wt% ZnO 18999 57 1.6x10⁶ 4617 9.0x10³ 23617 0.20
TZ8Y+ 1.0 wt% ZnO 34185 69 7.5x10⁵ 8814 6.9x10³ 42999 0.20
TZ8Y+ 3.0 wt% ZnO 38239 69 6.5x10⁵ 12511 7.0x10³ 50750 0.25
6 References
1. Peng C, Melnik J, Luo J, Sanger AR, Chuang KT. BaZr0.8Y0.2O3−δ electrolyte with and without ZnO sintering aid: Preparation and characterization. Solid State Ionics. 2010;181(29):1372–1377. doi: 10.1016/j.ssi.2010.07.026
2. Wang H, Peng R, Wu X, Hu J, Xia C. Sintering behavior and conductivity study of yttrium-doped BaCeO 3 -BaZrO 3 solid solutions using ZnO additives. Journal of the American Ceramic Society. 2009;92(11):2623–2629. DOI: 10.1111/j.1551-2916.2009.03204.x.
3. Zhang C, Zhao H, Xu N, Li X, Chen N. Influence of ZnO addition on the properties of high temperature proton conductor Ba1.03Ce0.5Zr0.4Y0.1O3−δ synthesized via citrate–nitrate method. International Journal of Hydrogen Energy. 2009;34(6):2739–2746. doi: 10.1016/j.ijhydene.2009.01.061
4. Bakar SN, Talib IA, Osman N. The effects of ZnO addition on the properties of Y3+ doped BaZrO3 prepared by the Pechini method. Solid State Science and Technology. 2009;17(2):24–31.
Ceramic Society. 2005;88:2362–2368. doi: 10.1111/j.1551-2916.2005.00449.x
6. Peng Z, Guo R, Yin Z, Li J.Influences of ZnO on the properties of SrZr 0.9 Y 0.1 O 2.95 protonic conductor. Journal of the American Ceramic Society. 2008;91:1534–1538. doi: 10.1111/j.1551-2916.2007.02222.x
7. Tao S, Irvine JT. Conductivity studies of dense yttrium-doped BaZrO3 sintered at 1325°C. Journal of Solid State Chemistry. 2007;180(12):3493–3503. doi: 0.1016/j.jssc.2007.09.027 8. Li S, Ge L, Gu H, Zheng Y, Chen H, Guo L. Sinterability and
electrical properties of ZnO-doped Ce0.8 Y0.2O1.9 electrolytes
prepared by an EDTA-citrate complexing method. Journal of Alloys and Compounds. 2011;509(1):94–98. doi:10.1016/j. jallcom.2010.08.111
9. Gao L, Zhou M, Zheng Y, et al. Effect of zinc oxide on yttria doped ceria. Journal of Power Sources. 2010;195(10):3130–3134. doi: 10.1016/j.jpowsour.2009.11.117
10. Batista RM, Muccillo EN. Structure, microstructure and electrical conductivity of 8YSZ containing NiO. Ceramics International. 2011;37(6):1929–1934. doi: 10.1016/j.ceramint.2011.03.045 11. Song XC, Lu J, Zhang TS, Ma J. Sintering behavior and
mechanisms of NiO-doped 8mol% yttria stabilized zirconia. Journal of the European Ceramic Society. 2011;31(14):2621–2627. doi: 10.1016/j.jeurceramsoc.2011.03.025
12. Zhang T, Chan S, Kong L, Sheng PT, Ma J. Synergetic effect of NiO and SiO2 on the sintering and properties of 8 mol% yttria-stabilized zirconia electrolytes. Electrochimica Acta. 2009;54(3):927–934. doi: 10.1016/j.electacta.2008.08.028 13. Silva G, Muccillo E. Electrical conductivity of yttria-stabilized
zirconia with cobalt addition. Solid State Ionics. 2009;180(s11-13):835–838. doi: 10.1016/j.ssi.2009.02.003
14. Zhang T, Du Z, Li S, Kong LB, Song XC, Lu J. Transitional metal-doped 8 mol% yttria-stabilized zirconia electrolytes. Solid State Ionics. 2009180(23):1311–1317. doi: 10.1016/j. ssi.2009.08.004
15. Liu Y, Lao L. Structural and electrical properties of ZnO-doped 8 mol% yttria-stabilized zirconia. Solid State Ionics. 2006;177:159–163. doi: 10.1016/j.ssi.2005.10.002
16. Flegler AJ, Burye TE, Yang Q, Nicholas JD. Cubic Yttria stabilized zirconia sintering additive impacts: a comparative study. Ceramics International. 2014;40:16323-16335. doi: 10.1016/j.ceramint.2014.07.071
17. Marcomini RF, Sousa DM. Caracterização microestrutural de materiais cerâmicos utilizando o programa de processamento digital de imagens Image J. Cerâmica. 2011; 57(341):100-105. doi:10.1590/S0366-69132011000100013
18. Dong Y, Hampshire S, Lin B, Ling Y, Zhang X. High sintering activity Cu–Gd co-doped CeO2 electrolyte for solid oxide fuel cells. Journal of Power Sources. 2010;195(19):6510–6515. doi: 10.1016/j.jpowsour.2010.03.053
19. Kleinlogel C, Gauckler LJ. Sintering and properties of nanosized ceria solid solutions. Solid State Ionics. 2000;135(1-4):567–573. DOI: 10.1016/S0167-2738(00)00437-9
20. Štefanić G, Musić S, Ivanda M. Phase development of the ZrO2–ZnO system during the thermal treatments of amorphous precursors. Journal of Molecular Structure. 2009;924-926:225–234. doi: 10.1016/j.molstruc.2008.10.044
21. Bunting E. Phase equilibria in the system SiO2–ZnO. Journal of American Ceramic Society. 1930;4:131–136. DOI: 10.1111/ j.1151-2916.1930.tb16797.x
22. Lide DR, editor. CRC Handbook of Chemistry and Physics. 84th.ed. New York: CRC Press; 2004. http://www.znu.ac.ir/ data/members/rasoulifard_mohammad/crc.pdf
23. Marcomini RF, de Souza DP, Kleitz M, Dessemond L, Steil MC. Blocking effect of ZnO in YSZ/ZnO composites. ECS Journal of Solid State Science and Technology. 2012;1(6):N127–N134. doi: 10.1149/2.004301jss
24. Kleitz M, Dessemond L, Steil MC. Model for ion-blocking at internal interfaces in zirconias. Solid State Ionics. 1995;75:107-115.